Market Overview
| Study Period | 2020 - 2031 |
|---|---|
| Forecast Data Period | 2026 - 2031 |
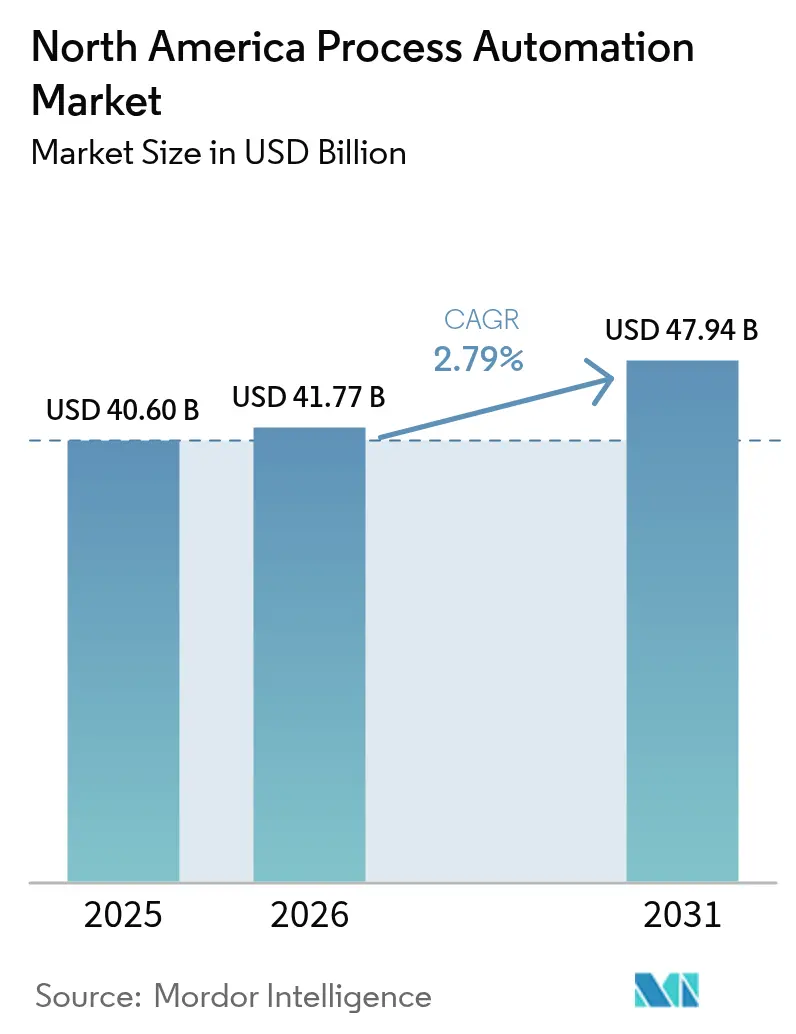
| Base Year Market Size (2025) | USD 40.60 Billion |
| Market Size (2026) | USD 41.77 Billion |
| Market Size (2031) | USD 47.94 Billion |
| Growth Rate (2026 - 2031) | 2.79% CAGR |
| Market Concentration | Medium |
Major Players *Disclaimer: Major Players sorted in no particular order Image © Mordor Intelligence. Reuse requires attribution under CC BY 4.0. | |
North America Process Automation Market Analysis by Mordor Intelligence
The North America process automation market size is projected to expand from USD 40.60 billion in 2025 and USD 41.77 billion in 2026 to USD 47.94 billion by 2031, registering a CAGR of 2.79% between 2026 to 2031. Real-time optimization, carbon-pricing exposure, and tightening safety regulations are prompting refiners, chemical makers, and pharmaceutical plants to phase out legacy distributed control systems and adopt edge-enabled, cybersecurity-hardened architectures. Operators are shifting budgets toward data-driven energy-efficiency projects because federal and provincial carbon levies reward every percentage point of natural-gas savings. Wireless instrumentation is gaining ground in hazardous zones where trenching costs and hot-work permits inflate the price of new cabling, while protocol-agnostic middleware is opening brownfield facilities to multi-vendor software solutions. Competitive dynamics are intensifying as cloud hyperscalers enter the automation value chain with managed historians and machine-learning services that bypass proprietary hardware.
Key Report Takeaways
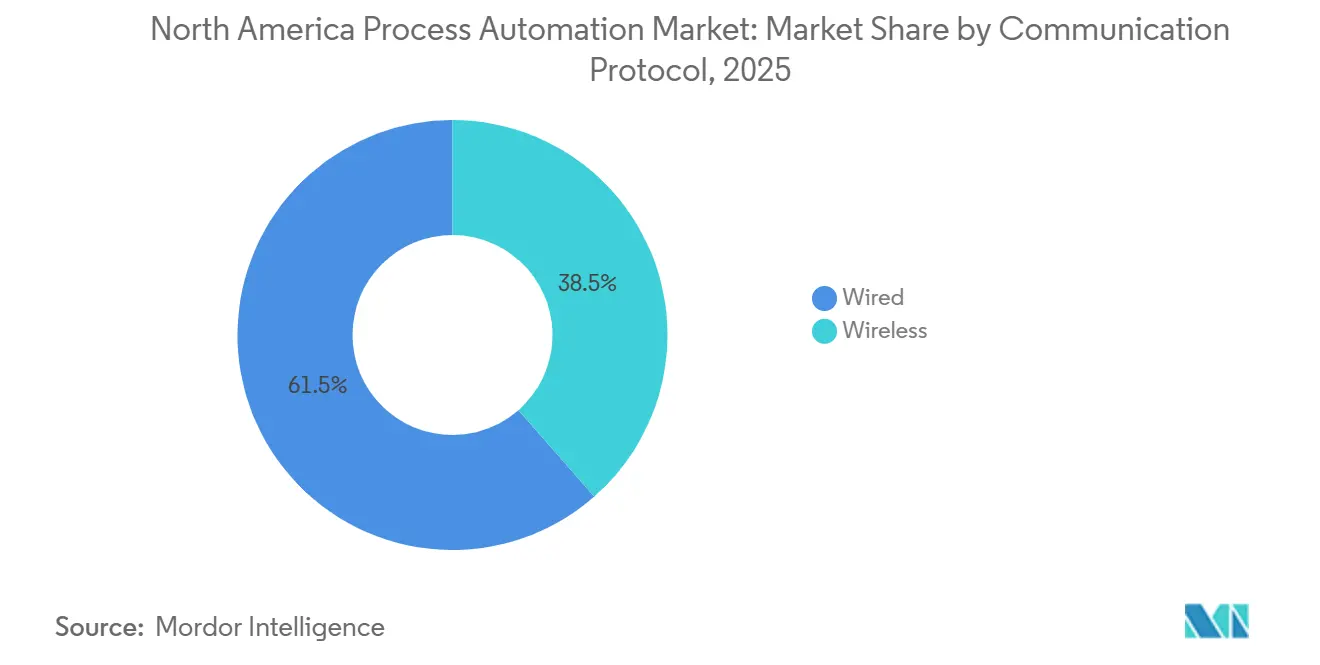
- By communication protocol, wired communication captured 61.19% of the North America process automation market share in 2025 while wireless alternatives are forecast to grow at a 3.11% CAGR through 2031.
- By system type, hardware represented 58.43% of revenue in 2025 but software is projected to post the fastest expansion at a 3.56% CAGR to 2031.
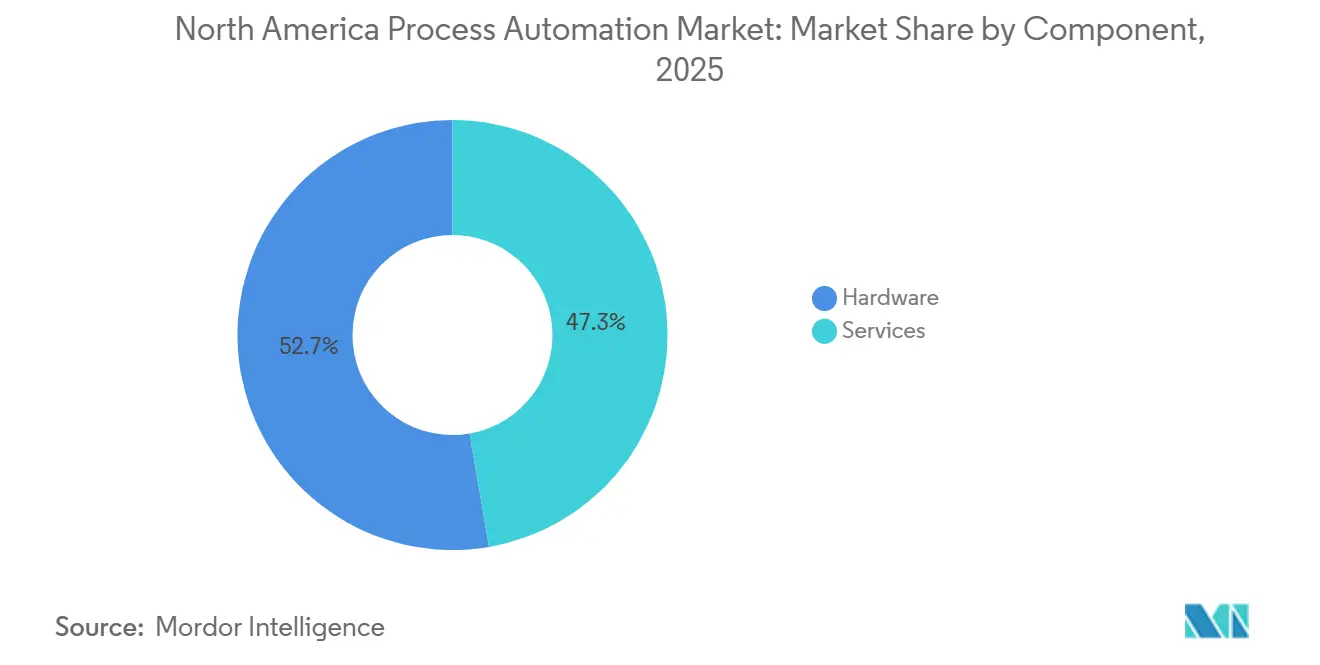
- By component, hardware generated 52.71% of 2025 spending, whereas services are expected to advance at the fastest 3.24% CAGR through 2031.
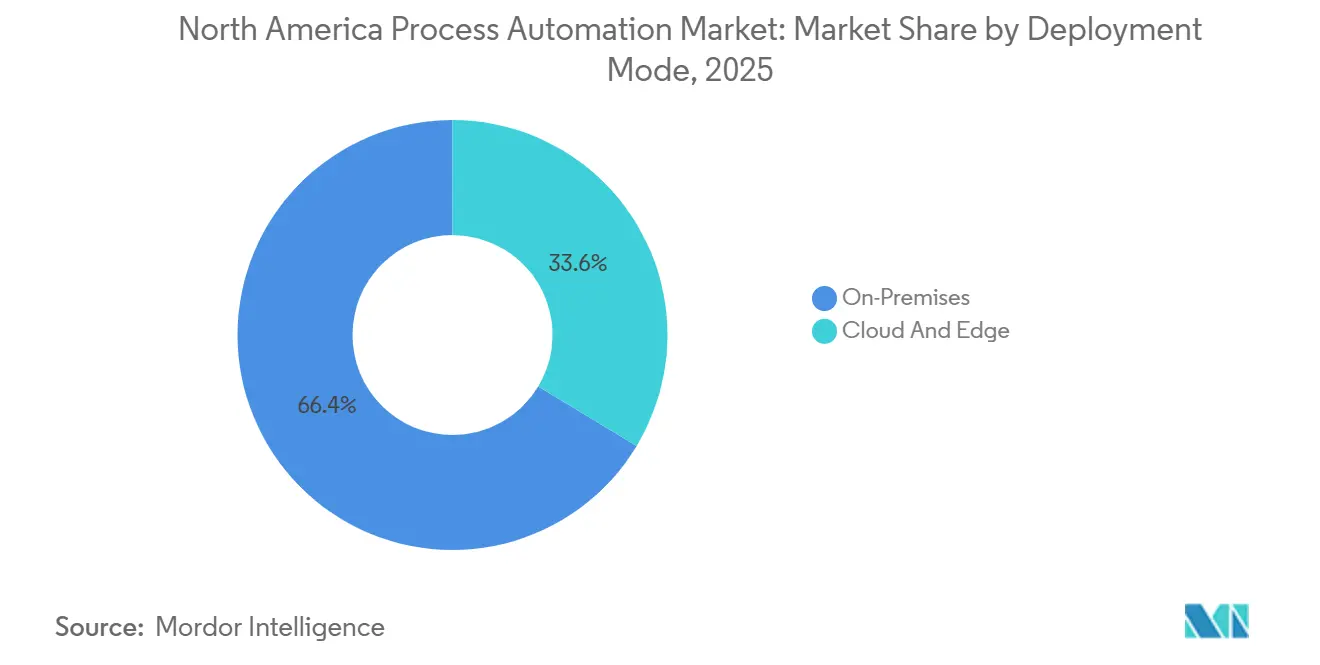
- By deployment mode, on-premises deployments held 66.37% of spending in 2025 while cloud and edge architectures are projected to increase at a 3.85% CAGR over the forecast period.
- By end-user industry, oil and gas led with 21.55% revenue share in 2025 whereas pharmaceutical manufacturing is poised to deliver the quickest rise at a 4.53% CAGR through 2031.
- By geography, the United States commanded 78.68% of regional revenue in 2025 while Mexico is projected to register the strongest growth at a 4.62% CAGR to 2031.
Note: Market size and forecast figures in this report are generated using Mordor Intelligence’s proprietary estimation framework, updated with the latest available data and insights as of 2026.
North America Process Automation Market Trends and Insights
Drivers Impact Analysis*
| Driver | (~) % Impact on CAGR Forecast | Geographic Relevance | Impact Timeline |
|---|---|---|---|
| Rising Focus on Energy-Efficiency and OpEx Reduction | +0.80% | United States (Gulf Coast, Midwest), Canada (Alberta oil sands) | Medium term (2-4 years) |
| Heightened Demand for Safety-Instrumented Systems | +0.60% | United States (Texas, Louisiana refineries), Canada (petrochemical hubs) | Short term (≤ 2 years) |
| Proliferation of Industrial IoT Platforms | +0.50% | United States (manufacturing belt), Mexico (nearshoring corridors) | Medium term (2-4 years) |
| Shift Toward Predictive and Prescriptive Maintenance Analytics | +0.40% | United States, Canada | Medium term (2-4 years) |
| Carbon-Intensity Penalties Accelerating Digital Process Control | +0.50% | Canada (federal carbon tax zones), United States (California, Northeast states) | Long term (≥ 4 years) |
| Demand for Fenceless Cobots in Hybrid Process Lines | +0.20% | United States (food and beverage, pharmaceutical packaging) | Long term (≥ 4 years) |
| Source: Mordor Intelligence | |||
Rising Focus on Energy-Efficiency and OpEx Reduction
Process manufacturers are recasting automation as an emissions-cutting tool. The U.S. Department of Energy’s 2024 Industrial Decarbonization Roadmap outlines a 10%-15% reduction target for industrial energy intensity by 2030, prioritizing advanced process control and real-time optimization for chemical and refining assets.[1]U.S. Department of Energy, “Industrial Decarbonization Roadmap,” energy.gov Canadian oil-sands operators face a legislated carbon price of CAD 170 per tonne by 2030, prompting the rollout of edge analytics that adjust combustion-air ratios and feedwater chemistry inside steam generators, trimming natural-gas use by up to 5% per barrel of synthetic crude.[2]Government of Canada, “Carbon Pricing,” canada.ca Payback periods under 18 months have been documented at Gulf Coast facilities that fine-tune distillation and heat-exchanger networks through multivariable controllers. These early wins are steering 2026 capital budgets toward digital debottlenecking rather than pure capacity expansions.
Heightened Demand for Safety-Instrumented Systems
A string of refinery and chemical-plant incidents in 2024-2025 elevated regulatory scrutiny. The U.S. Chemical Safety and Hazard Investigation Board linked several fires to inadequate safety-integrity-level verification, spurring retrofits of pneumatic trip systems with smart positioners that enable online diagnostics.[3]Chemical Safety Board, “Investigation Reports,” csb.gov Compliance with OSHA Process Safety Management now requires documented proof tests, driving purchases of integrated safety controllers that interface with existing DCS networks through secure OPC-UA gateways. Vendors report double-digit order growth for safety PLCs as pharmaceutical and food processors adopt the same architectures to satisfy sterile-fill and allergen-control mandates.
Proliferation of Industrial IoT Platforms
Industrial IoT deployments have moved from pilot to production. Microsoft and Siemens offer Azure-based templates that funnel data from wellhead controllers and pipeline SCADA systems to cloud historians without bespoke coding.[4]Microsoft Corporation, “Azure Industrial IoT Templates,” microsoft.com Edge gateways handle latency-sensitive analytics locally, achieving sub-100 ms loop response while maintaining cloud scalability. Mexican tier-one automotive suppliers in Nuevo León are using such edge-to-cloud stacks to synchronize stamping presses with continuous coating lines, shortening model changeovers and supporting nearshoring strategies.
Shift Toward Predictive and Prescriptive Maintenance Analytics
Predictive maintenance now combines wireless vibration, thermal, and process data with machine-learning models that rank corrective actions by economic impact. At a major Texas refinery, wireless sensors on 1,200 rotating assets generated early warnings six weeks before traditional threshold alarms, allowing maintenance during low-margin windows. Prescriptive software then simulated energy penalties linked to deferring heat-exchanger cleaning, quantifying the trade-off for planners. The convergence of OT data diodes with IT analytics is widening the adoption curve despite cybersecurity constraints imposed by federal pipeline-security directives.
Restraints Impact Analysis*
| Restraint | (~) % Impact on CAGR Forecast | Geographic Relevance | Impact Timeline |
|---|---|---|---|
| High Upfront CapEx and Integration Complexity | -0.50% | United States (brownfield refineries, chemical plants), Canada (oil sands) | Short term (≤ 2 years) |
| Brown-Field Interoperability Challenges | -0.40% | United States (Gulf Coast, Midwest), Canada (Alberta) | Medium term (2-4 years) |
| Operational Cybersecurity Talent Deficit | -0.30% | United States, Canada | Medium term (2-4 years) |
| Long-Term Service-Contract Lock-Ins Limiting Vendor Switch | -0.20% | United States, Canada | Long term (≥ 4 years) |
| Source: Mordor Intelligence | |||
High Upfront CapEx and Integration Complexity
Comprehensive migrations from proprietary DCS platforms can exceed USD 50 million per site, a sum that clashes with payback horizons demanded by corporate finance teams. An American Fuel and Petrochemical Manufacturers survey found that 62% of refineries defer cloud historians because of cutover risks and the need for dual operations during commissioning. Brownfield plants often rely on legacy fieldbus networks that necessitate costly protocol converters when interfacing with modern edge devices, stretching project timelines to seven years when tackled in phased turnarounds.
Operational Cybersecurity Talent Deficit
The Industrial Control Systems Cyber Emergency Response Team recorded a 40% vacancy rate for engineers certified on IEC 62443 in 2025, forcing operators to outsource managed security services that lengthen vendor lock-ins. A ransomware incident at a Midwest chemical plant revealed that attackers exploited historian servers bridging IT and OT networks, illustrating the skills gap in segmentation and patch management. Competition for talent from finance and telecom sectors inflates salary premiums and strains operational budgets, slowing digital-transformation roadmaps.
*Our forecasts treat driver/restraint impacts as directional, not additive. The impact forecasts reflect baseline growth, mix effects, and variable interactions.
Segment Analysis
By Communication Protocol: Wireless Gains in Hazardous Zones
Wired networks held 61.19% of North America process automation market share in 2025. Their dominance stems from entrenched HART, PROFIBUS, and Foundation Fieldbus loops that anchor safety-critical interlocks and high-speed controls. WirelessHART and ISA100.11a devices, however, are forecast to expand at a 3.11% CAGR as intrinsic-safety-certified transmitters allow deployment inside Class I Division 1 areas, eliminating conduit runs that can cost USD 3,000 per meter. Shell’s Norco refinery used 400 wireless transmitters to cut installation labour by 60% while maintaining 99.5% packet reliability. In parallel, edge gateways normalize wired and wireless data so that predictive algorithms detect sensor drift regardless of medium. Regulatory updates to NFPA 70 have formalized this coexistence by permitting wireless devices where risk assessments validate signal integrity.
Wired links remain indispensable for emergency shutdown valves, burner-management systems, and compressor anti-surge controls because IEC 61511 demands deterministic latency. Consequently, the North America process automation market retains a hybrid topology in which wireless augments, rather than replaces, critical hardwired loops. Project teams now model radio-frequency propagation in 3-D digital twins to pre-empt interference before issuing hot-work permits.


By System Type: Software Outpaces Hardware Growth
Hardware generated 58.43% of 2025 revenue, yet software is projected to register the leading 3.56% CAGR through 2031. Open-standard controllers running on commercial off-the-shelf hardware are eroding the pricing power of proprietary DCS cabinets. Subscription-based advanced process control suites mean operators can unlock new functionality without capital projects, a trend exemplified by pulp and paper mills that deploy multivariable controllers to shave 6% off steam demand. Meanwhile, North America process automation market size for manufacturing execution systems is rising as pharmaceutical firms embrace electronic batch records to comply with FDA data-integrity guidance.
Cyber-hardened SCADA upgrades form a brisk replacement cycle because many midstream pipeline systems still run on unsupported operating systems vulnerable to ransomware. Vendors now package SCADA kernels inside virtual machines hosted on hardened Linux, slashing patch windows and supporting rapid disaster recovery. Smart sensors with embedded diagnostics lengthen calibration intervals, reinforcing the shift from capital equipment toward digital lifecycle services.
By Component: Services Surge on Lifecycle Management
Hardware accounted for 52.71% of 2025 component spend, yet services are forecast to climb at a 3.24% CAGR, the fastest within the North America process automation market. Scarcity of in-house engineers able to integrate cloud APIs, edge containers, and legacy I/O has elevated demand for vendor-led lifecycle agreements that guarantee uptime or energy savings. Emerson, for example, prices its Plantweb Optics program on a monthly monitored-asset basis, converting a traditional CAPEX sale into an OPEX subscription. Cybersecurity services are the fastest-growing slice following Transportation Security Administration directives that mandate continuous vulnerability assessments for pipeline SCADA.
Software components are moving from perpetual licenses to consumption-based arrangements that align fees with value realized. AspenTech’s 2024 pivot to a subscription model initially faced resistance, yet customers now appreciate the ability to scale licenses during turnarounds and receive algorithm updates without fresh validation cycles. Hardware suppliers facing low-cost Asian entrants are bundling analytics to preserve margins, blending the hardware-software boundary.
By Deployment Mode: Cloud Gains Despite Latency Concerns
On-premises deployment held 66.37% of 2025 outlays, reflecting ingrained risk aversion toward internet connectivity in control rooms. Cloud and edge solutions, however, are projected to advance at a 3.85% CAGR as hyperscalers certify infrastructure for regulated industries. Chevron’s hybrid architecture streams time-compressed summaries from wellhead edge nodes to Azure-hosted models that optimize artificial-lift parameters, trimming local server footprints by 70% while upholding sub-second safety-loop response.
FDA-aligned audit trails delivered by validated cloud instances are warming pharmaceutical executives to off-prem historians. Subscription fees and data-egress costs remain watchpoints, so many operators adopt edge devices that host containerized analytics locally and forward only aggregated KPIs.
By End-User Industry: Pharmaceutical Leads Growth
Oil and gas delivered 21.55% of 2025 revenue, but pharmaceutical plants are projected to log the fastest 4.53% CAGR as FDA continuous-manufacturing guidance rewards closed-loop control. Pfizer’s Kalamazoo line maintains tablet weight within 2% relative standard deviation using inline spectroscopy tied to feedback loops, a precision unattainable in batch mode.
Moderna’s mRNA vaccine facilities employ automated bioreactor controls that adjust flow rates based on real-time analytics, accelerating scale-up. Chemical complexes on the U.S. Gulf Coast continue to invest heavily in advanced control to squeeze yield gains from megaproject crackers, while water utilities adopt batch-recipe management software to meet nutrient-discharge caps.
Geography Analysis
The United States contributed 78.68% of North America process automation market size in 2025. Gulf Coast refineries concentrate distributed control systems more densely than any other region worldwide, and recent ransomware incidents have elevated cybersecurity modernization to a board-level priority. Northeast pharmaceutical corridors are adopting continuous-manufacturing lines that eliminate end-product batch testing, bolstering demand for process analytical technology. The U.S. market is projected to rise at a measured 2.5% CAGR through 2031 as operators balance brownfield constraints against carbon-pricing incentives.
Canada’s share is smaller, yet its oil-sands projects represent some of the most automation-intensive facilities in the world. Carbon levies that reached CAD 80 per tonne in 2024 and escalate annually have unlocked budgets for advanced control, predictive maintenance, and emissions monitoring. Suncor and Canadian Natural Resources have earmarked more than CAD 2 billion for digitalization between 2024-2026, targeting 5% cuts in steam-to-oil ratios. Growth is tempered, however, by reinvestment discipline and a narrower industrial base beyond hydrocarbons.
Mexico is forecast to expand at a 4.62% CAGR, the fastest national pace, fuelled by nearshoring of automotive, electronics, and aerospace supply chains. Tesla, BMW, and Samsung plants in Nuevo León, San Luis Potosí, and Querétaro are installing high-precision PLCs, HMIs, and manufacturing-execution software to meet North American content rules under USMCA. Government infrastructure plans and technical-college partnerships aim to relieve skills shortages, while grid-stability upgrades underpin the reliability demanded by electric-vehicle battery-cell lines.
Competitive Landscape
The North America process automation market exhibits moderate concentration. ABB, Siemens, Schneider Electric, Rockwell Automation, and Emerson leverage multi-decade installed bases and long-term service contracts that raise switching costs by roughly 30% of replacement CAPEX. Software layers are less consolidated: AspenTech, AVEVA, and a cohort of edge-analytics start-ups provide protocol-agnostic applications that slot atop any controller, eroding proprietary moats. Siemens acquired Brightly Software in 2024 to deepen asset-performance management services, turning one-off sales into recurring revenue.
Rockwell Automation’s collabouration with Microsoft embeds Azure machine-learning inside FactoryTalk, letting customers analyze historian data without migrating from Logix controllers. ABB’s USD 180 million Louisiana petrochemical contract showcases demand for distributed control tightly coupled with edge analytics, while Emerson’s USD 300 million Austin expansion adds a cybersecurity operations center to support IEC 62443 compliance.
White-space opportunities are opening in hybrid process-discrete environments such as continuous-tableting or flexible beverage packaging, where Beckhoff and B&R offer PC-based control that unifies motion, vision, and logic on a single platform. Hyperscalers AWS, Microsoft, and Google Cloud now market managed historians and anomaly detection as a service, threatening to commoditize traditional value propositions anchored in proprietary integration expertise. Vendors able to deliver pre-validated architectures for FDA 21 CFR Part 11 or IEC 61511 slash project lead times by a year, conferring a competitive edge in highly regulated segments.
North America Process Automation Industry Leaders
ABB Ltd.
Siemens AG
Schneider Electric SE
General Electric Company
Rockwell Automation, Inc.
- *Disclaimer: Major Players sorted in no particular order


Recent Industry Developments
- October 2025: The International Society of Automation honored Rockwell Automation for its FactoryTalk Optix human-machine interface platform after the company demonstrated how mobile screens and augmented-reality overlays give operators a clearer picture of plant conditions in real time
- September 2025: Honeywell rolled out a new line of wireless pressure transmitters that run on both ISA100 and WirelessHART, offer longer battery life, and provide richer self-diagnostics—features aimed at oil-and-gas sites that sit far from wired networks
- August 2025: Yokogawa Electric released CENTUM VP R6.09, weaving artificial-intelligence algorithms into its flagship control system so chemical and petrochemical plants can tighten loops automatically and spot failures before they occur
- July 2025: Phoenix Contact enlarged its networking lineup with managed Ethernet switches that include stronger cybersecurity features and Time-Sensitive Networking support, letting process-control engineers move deterministically timed data across converged OT/IT networks


North America Process Automation Market Report Scope
The North America Process Automation Market Report is Segmented by Communication Protocol (Wired, Wireless), System Type (Hardware: SCADA, DCS, PLC, HMI, Process Safety Systems, Valves and Actuators, Electric Motors, Sensors and Transmitters; Software: APC, Data Analytics, MES, Other Software), Component (Hardware, Software, Services), Deployment Mode (On-Premises, Cloud and Edge), End-User Industry (Oil and Gas, Chemical and Petrochemical, Power and Utilities, Water and Wastewater, Food and Beverage, Pulp and Paper, Pharmaceutical, Other End-User Industry), and Geography (United States, Canada, Mexico). The Market Forecasts are Provided in Terms of Value (USD).
By Communication Protocol
| Wired |
| Wireless |
By System Type
| Hardware | Scada |
| Distributed Control System (Dcs) | |
| Programmable Logic Controller (Plc) | |
| Human-Machine Interface (Hmi) | |
| Process Safety Systems | |
| Valves And Actuators | |
| Electric Motors | |
| Sensors And Transmitters | |
| Software | Advanced Process Control (Arc, Mvc, Inferential) |
| Data Analytics And Reporting | |
| Manufacturing Execution Systems (Mes) | |
| Other Software |
By Component
| Hardware |
| Software |
| Services |
By Deployment Mode
| On-Premises |
| Cloud And Edge |
By End-User Industry
| Oil And Gas |
| Chemical And Petrochemical |
| Power And Utilities |
| Water And Wastewater |
| Food And Beverage |
| Pulp And Paper |
| Pharmaceutical |
| Other End-User Industry |
By Country
| United States |
| Canada |
| Mexico |
| By Communication Protocol | Wired | |
| Wireless | ||
| By System Type | Hardware | Scada |
| Distributed Control System (Dcs) | ||
| Programmable Logic Controller (Plc) | ||
| Human-Machine Interface (Hmi) | ||
| Process Safety Systems | ||
| Valves And Actuators | ||
| Electric Motors | ||
| Sensors And Transmitters | ||
| Software | Advanced Process Control (Arc, Mvc, Inferential) | |
| Data Analytics And Reporting | ||
| Manufacturing Execution Systems (Mes) | ||
| Other Software | ||
| By Component | Hardware | |
| Software | ||
| Services | ||
| By Deployment Mode | On-Premises | |
| Cloud And Edge | ||
| By End-User Industry | Oil And Gas | |
| Chemical And Petrochemical | ||
| Power And Utilities | ||
| Water And Wastewater | ||
| Food And Beverage | ||
| Pulp And Paper | ||
| Pharmaceutical | ||
| Other End-User Industry | ||
| By Country | United States | |
| Canada | ||
| Mexico | ||


Key Questions Answered in the Report
How fast is the North America process automation market expected to grow through 2031?
It is forecast to expand from USD 41.77 billion in 2026 to USD 47.94 billion by 2031 at a 2.79% CAGR.
Which segment is projected to grow fastest in the coming years?
Software, covering advanced process control, analytics, and MES, is expected to post a 3.56% CAGR through 2031.
Why are wireless protocols gaining share despite wired dominance?
Wireless devices slash installation costs in hazardous areas and enable temporary monitoring during turnarounds while edge gateways handle data reliability.
What is driving pharmaceutical investment in automation?
FDA continuous-manufacturing guidance and serialization rules reward real-time process control and electronic batch records, pushing a 4.53% CAGR.
How are carbon taxes influencing Canadian automation spending?
Rising levies up to CAD 170 per tonne by 2030 motivate oil-sands operators to digitize steam generation and extraction loops to cut fuel intensity.
What role do cloud providers play in the automation landscape?
Hyperscalers offer managed historians and AI services that reduce on-site servers, though many operators retain edge devices for latency-critical loops.
Page last updated on:


