
Technology, Media and Telecom
5th MayPricing Strategy for Semiconductor Components
3 Min Read
The North America Payment Gateway Market Report is Segmented by Type (Hosted, Self-/Non-Hosted), Enterprise Size (Small & Medium Enterprises, Large Enterprises), Channel (Online/Web, Mobile In-App, In-Store POS), End-User Industry (Retail & E-Commerce, Travel & Hospitality, BFSI, Media & Entertainment, Other End-User Industries), and Geography (United States, Canada). The Market Forecasts are Provided in Terms of Value (USD).
Market Overview
| Study Period | 2020 - 2031 |
|---|---|
| Base Year For Estimation | 2025 |
| Forecast Data Period | 2026 - 2031 |
| Market Size (2026) | USD 18.01 Billion |
| Market Size (2031) | USD 46.99 Billion |
| Growth Rate (2026 - 2031) | 21.14 % CAGR |
| Market Concentration | Medium |
Major Players *Disclaimer: Major Players sorted in no particular order. Image © Mordor Intelligence. Reuse requires attribution under CC BY 4.0. |
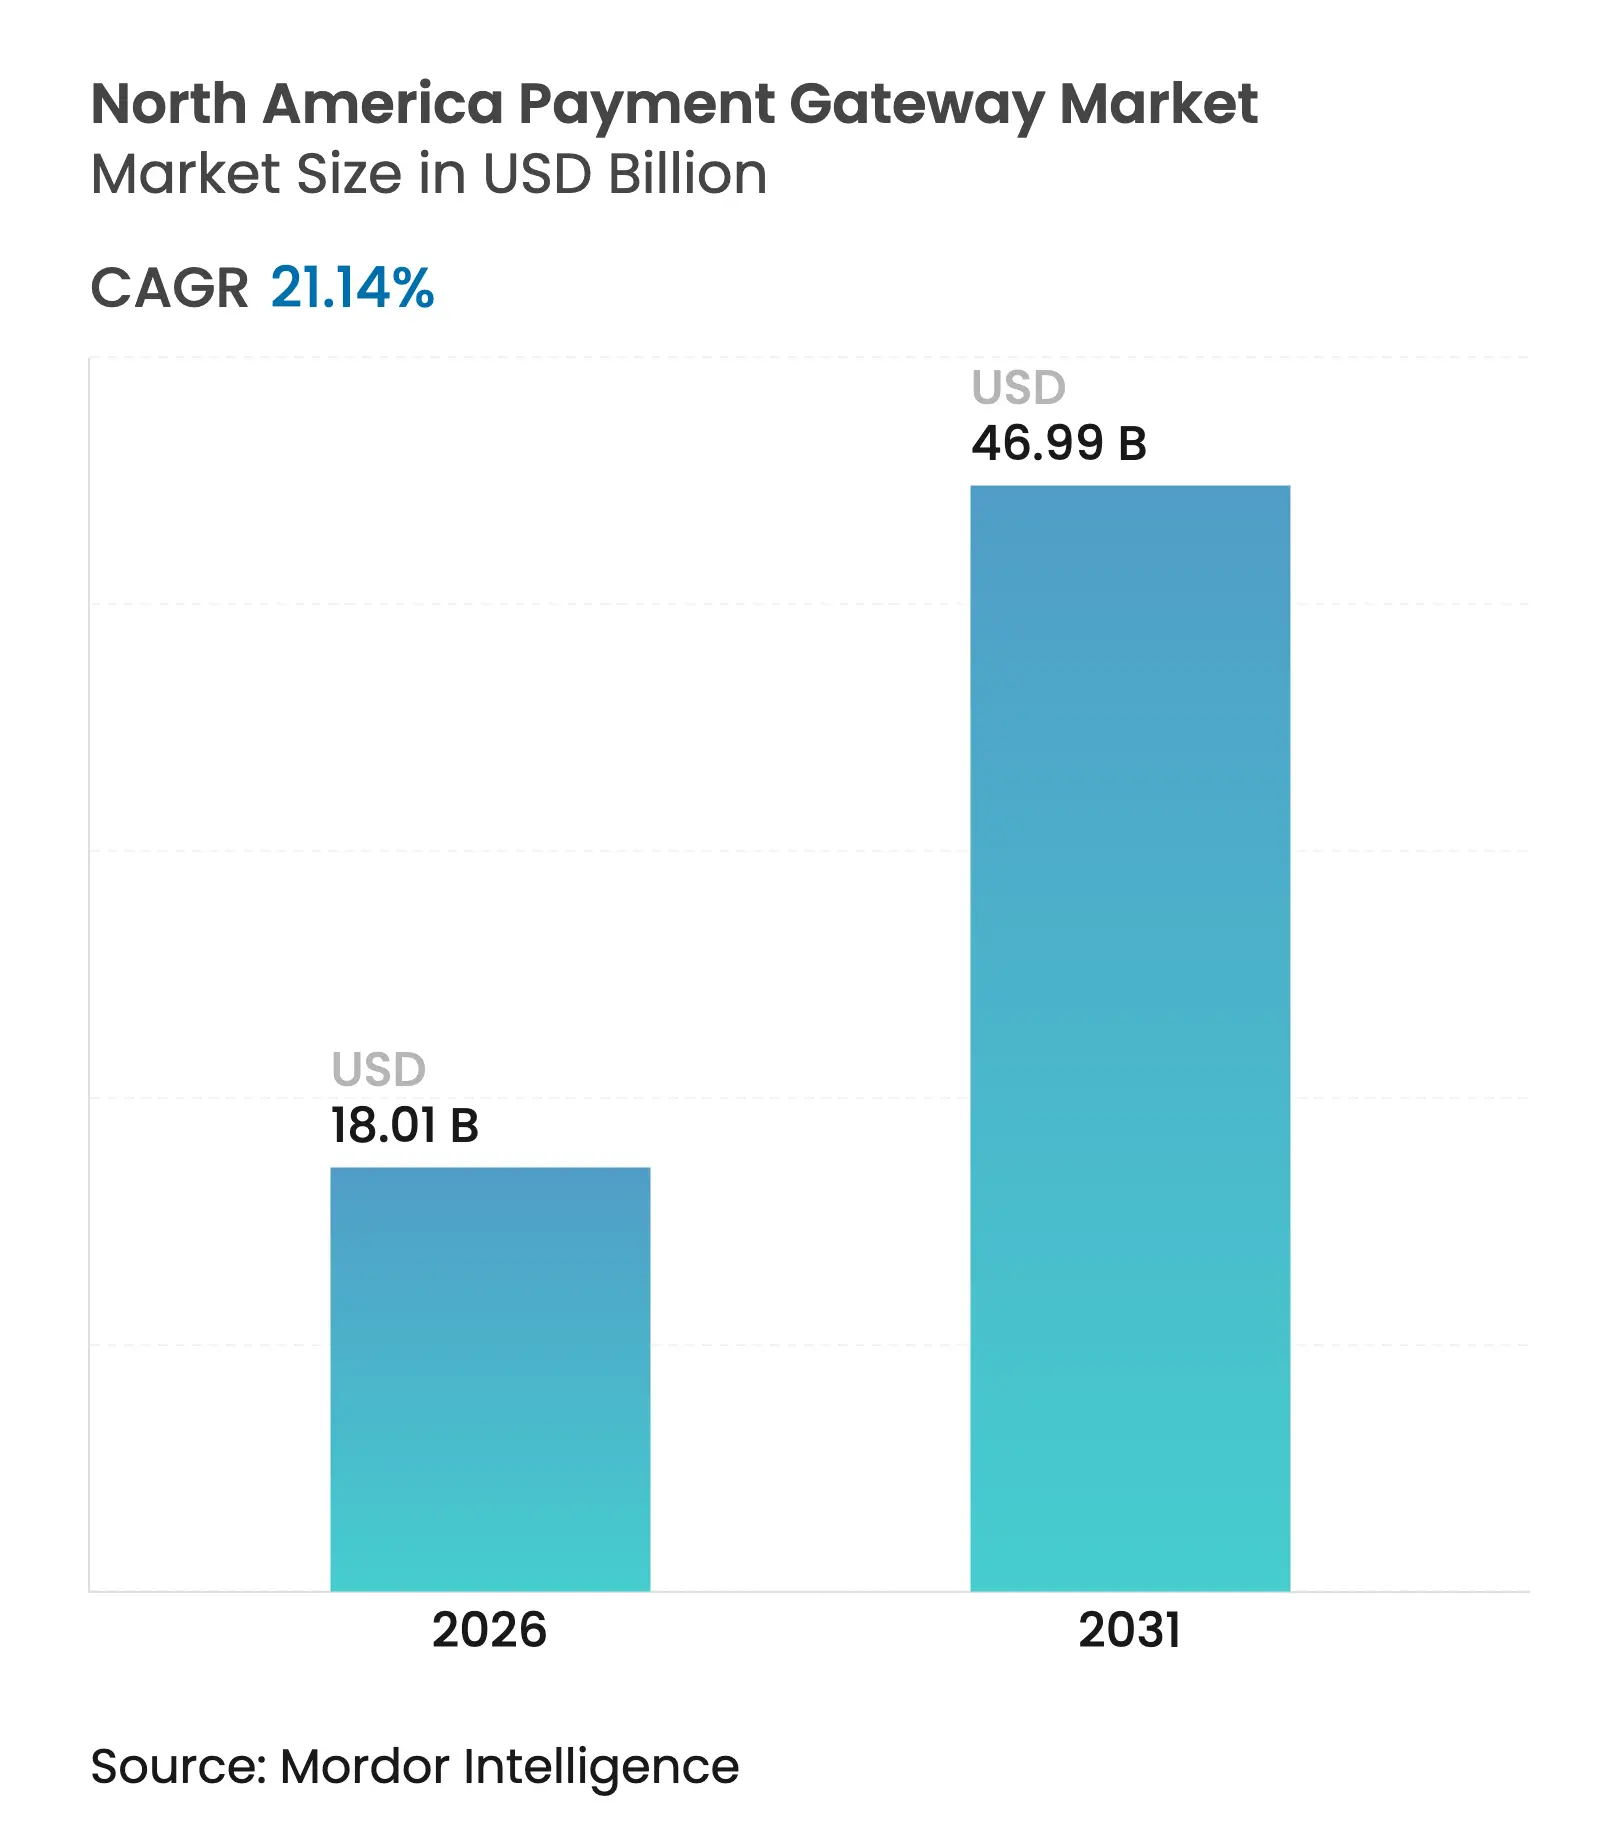
The North America Payment Gateway Market size was valued at USD 14.87 billion in 2025 and estimated to grow from USD 18.01 billion in 2026 to reach USD 46.99 billion by 2031, at a CAGR of 21.14% during the forecast period (2026-2031). The growth arc reflects sweeping changes in digital commerce, including mobile-first checkouts, cross-border trade, and tokenization. Rapid wallet adoption among Gen Z consumers, regulatory modernization in Canada, and merchants’ shift toward API-driven architectures are accelerating gateway upgrades. Intensifying litigation over interchange fees is forcing providers to pivot toward subscription models and value-added services, while fraud pressures are pushing artificial-intelligence tools deeper into gateway stacks. Competitive intensity is rising as banks introduce proprietary rails and fintech challengers specialize in industry-specific orchestration.
Key Report Takeaways
Note: Market size and forecast figures in this report are generated using Mordor Intelligence's proprietary estimation framework, updated with the latest available data and insights as of 2026.
Drivers Impact Analysis
| Drivers | (~) % Impact on CAGR | Geographic Relevance | Peak Impact | |||
|---|---|---|---|---|---|---|
Surge in Mobile-Wallet & Contactless Payments Adoption
Across the United States
Surge in Mobile-Wallet & Contactless Payments Adoption
Across the United States
| +6.5 | United States, with spillover to urban Canadian markets | Short term (≤ 2 yrs) | (~) % Impact on CAGR:
+6.5
|
Geographic Relevance
:
United States, with spillover to urban Canadian markets
|
Peak Impact
:
Short term (≤ 2 yrs)
|
Rapid Growth of Cross-Border E-commerce Enabled by USMCA
& Canada-US Trade Expansion
Rapid Growth of Cross-Border E-commerce Enabled by USMCA
& Canada-US Trade Expansion
| +5.4 | US-Canada border regions, major logistics hubs | Medium term (~ 3-4 yrs) | |||
Scaling of Buy-Now-Pay-Later Gateways Among Gen-Z
Consumers in North America
Scaling of Buy-Now-Pay-Later Gateways Among Gen-Z
Consumers in North America
| +4.3 | Urban centers across US and Canada | Medium term (~ 3-4 yrs) | |||
SMB Digitalization Incentives & Federal Support
Programs Driving Gateway Uptake
SMB Digitalization Incentives & Federal Support
Programs Driving Gateway Uptake
| +3.2 | Nationwide US, concentrated in underserved regions | Long term (≥ 5 yrs) | |||
Increasing Tokenization and Network-Token Roll-out
Enhancing Gateway Value Proposition
Increasing Tokenization and Network-Token Roll-out
Enhancing Gateway Value Proposition
| +2.8 | Major metropolitan areas first, then nationwide | Medium term (~ 3-4 yrs) | |||
Migration to API-First, Cloud-Native Gateway Architectures
Reducing Merchant Time-to-Market
Migration to API-First, Cloud-Native Gateway Architectures
Reducing Merchant Time-to-Market
| +2.1 | Tech-forward regions (West Coast, Northeast US, Toronto) | Short term (≤ 2 yrs) | |||
| Source: Mordor Intelligence | ||||||
Surge in Mobile-Wallet & Contactless Payments Adoption Across the United States
Mobile-wallet penetration reached 65% of American adults in July 2024 and 91% among Gen Z, signaling a structural leap in checkout expectations.[1]Billtrust Research Team, “2025 Gen Z Payment Trends Revealed,” *Billtrust*, Feb 25, 2025, billtrust.com Wallet-centric behavior is rewriting gateway feature roadmaps as merchants race to support token-based provisioning and near-instant in-app checkouts. Brand loyalty is fragile: 81% of Gen Z shoppers abandoned merchants after a poor payment experience. Providers lacking device-agnostic wallet support risk volume erosion as biometric authentication and device token standards converge.
Rapid Growth of Cross-Border E-commerce Enabled by USMCA & Canada–US Trade Expansion
B2B cross-border payments are expected to swell from USD 39.3 trillion to USD 56.1 trillion globally by 2030, with North American corridors taking a sizeable slice.[2]“Top 8 Key Trends in Payments for 2024 & Beyond,” *IR*, Apr 17, 2025, ir.com The USMCA’s streamlined customs processes and Canada’s Retail Payment Activities Act create compliance complexity that only multi-currency, rule-aware gateways can solve. Providers capable of integrated foreign-exchange and automated tax handling are securing disproportionate share of high-ticket cross-border flows.
Scaling of Buy-Now-Pay-Later Gateways Among Gen-Z Consumers in North America
BNPL usage nearly doubled to 46% among Gen Z within one year. Higher-value discretionary purchases are migrating from revolving credit to installment finance, requiring gateways to onboard multiple BNPL endpoints and deliver real-time credit decision routing. Platforms that bundle unified BNPL APIs for merchants are commanding premium pricing and stickier merchant relationships.
SMB Digitalization Incentives & Federal Support Programs Driving Gateway Uptake
Eighty-five percent of US SMEs now accept digital payments, helped by tax credits and low-cost POS grants.[3]Subramanyam Neti et al., “Impact of Digital Payments on Small and Medium Enterprises,” *Journal of Emerging Technologies and Innovative Research*, Oct 2024, jetir.org Yet 68% cite upfront integration costs as a barrier, underscoring demand for plug-and-play gateway packages. Banks still hold 75% share of SMB financial services, but digital challengers have captured 20% by promoting faster settlements and simplified onboarding.
Restraints Impact Analysis
| Restraints | (~) % Impact on CAGR | Geographic Relevance | Peak Impact | |||
|---|---|---|---|---|---|---|
Rising Incidence of Account-Takeover & CNP Fraud
Elevating Chargeback Costs
Rising Incidence of Account-Takeover & CNP Fraud
Elevating Chargeback Costs
| -4.3 | Nationwide US and Canada, higher in major urban centers | Medium term (~ 3-4 yrs) |
(~) % Impact on CAGR
:
-4.3
|
Geographic Relevance
:
Nationwide US and Canada, higher in major urban centers
|
Peak Impact
:
Medium term (~ 3-4 yrs)
|
Interchange-Fee Caps & Litigation Against Card
Networks Compressing Gateway Margins
Interchange-Fee Caps & Litigation Against Card
Networks Compressing Gateway Margins
| -3.2 | US nationwide, with regulatory spillover to Canada | Long term (≥ 5 yrs) | |||
Complex State-Level Data-Privacy Laws (CCPA, CPRA, Québec
Bill-64) Raising Compliance Burden
Complex State-Level Data-Privacy Laws (CCPA, CPRA, Québec
Bill-64) Raising Compliance Burden
| -2.1 | California, Virginia, Colorado, Quebec | Medium term (~ 3-4 yrs) | |||
High Dependence on Network Uptime; Outages Prompt Merchant
Switching & Reputation Risk
High Dependence on Network Uptime; Outages Prompt Merchant
Switching & Reputation Risk
| -1.8 | Nationwide, critical in high-volume retail corridors | Short term (≤ 2 yrs) | |||
| Source: Mordor Intelligence | ||||||
Rising Incidence of Account-Takeover & CNP Fraud Elevating Chargeback Costs
US CNP fraud losses hit USD 9.2 billion in 2023 and global losses are tracking toward USD 28.1 billion by 2026. Merchants are demanding risk engines that blend behavioral analytics with device intelligence, yet stricter risk controls can depress checkout conversion. Gateways must fine-tune fraud-model thresholds to cut chargebacks projected to top USD 12.8 billion by 2026 without adding friction.
Interchange-Fee Caps & Litigation Against Card Networks Compressing Gateway Margins
The USD 30 billion Visa-Mastercard settlement announced in March 2024 is lowering average domestic-credit interchange by up to 7 basis points and enlarging merchant surcharging rights. Illinois’s Interchange Fee Prohibition Act bans interchange on taxes and tips from July 2025. Gateways are countering margin compression by rolling out subscription bundles that package fraud tools, analytics dashboards, and yield-optimized routing.
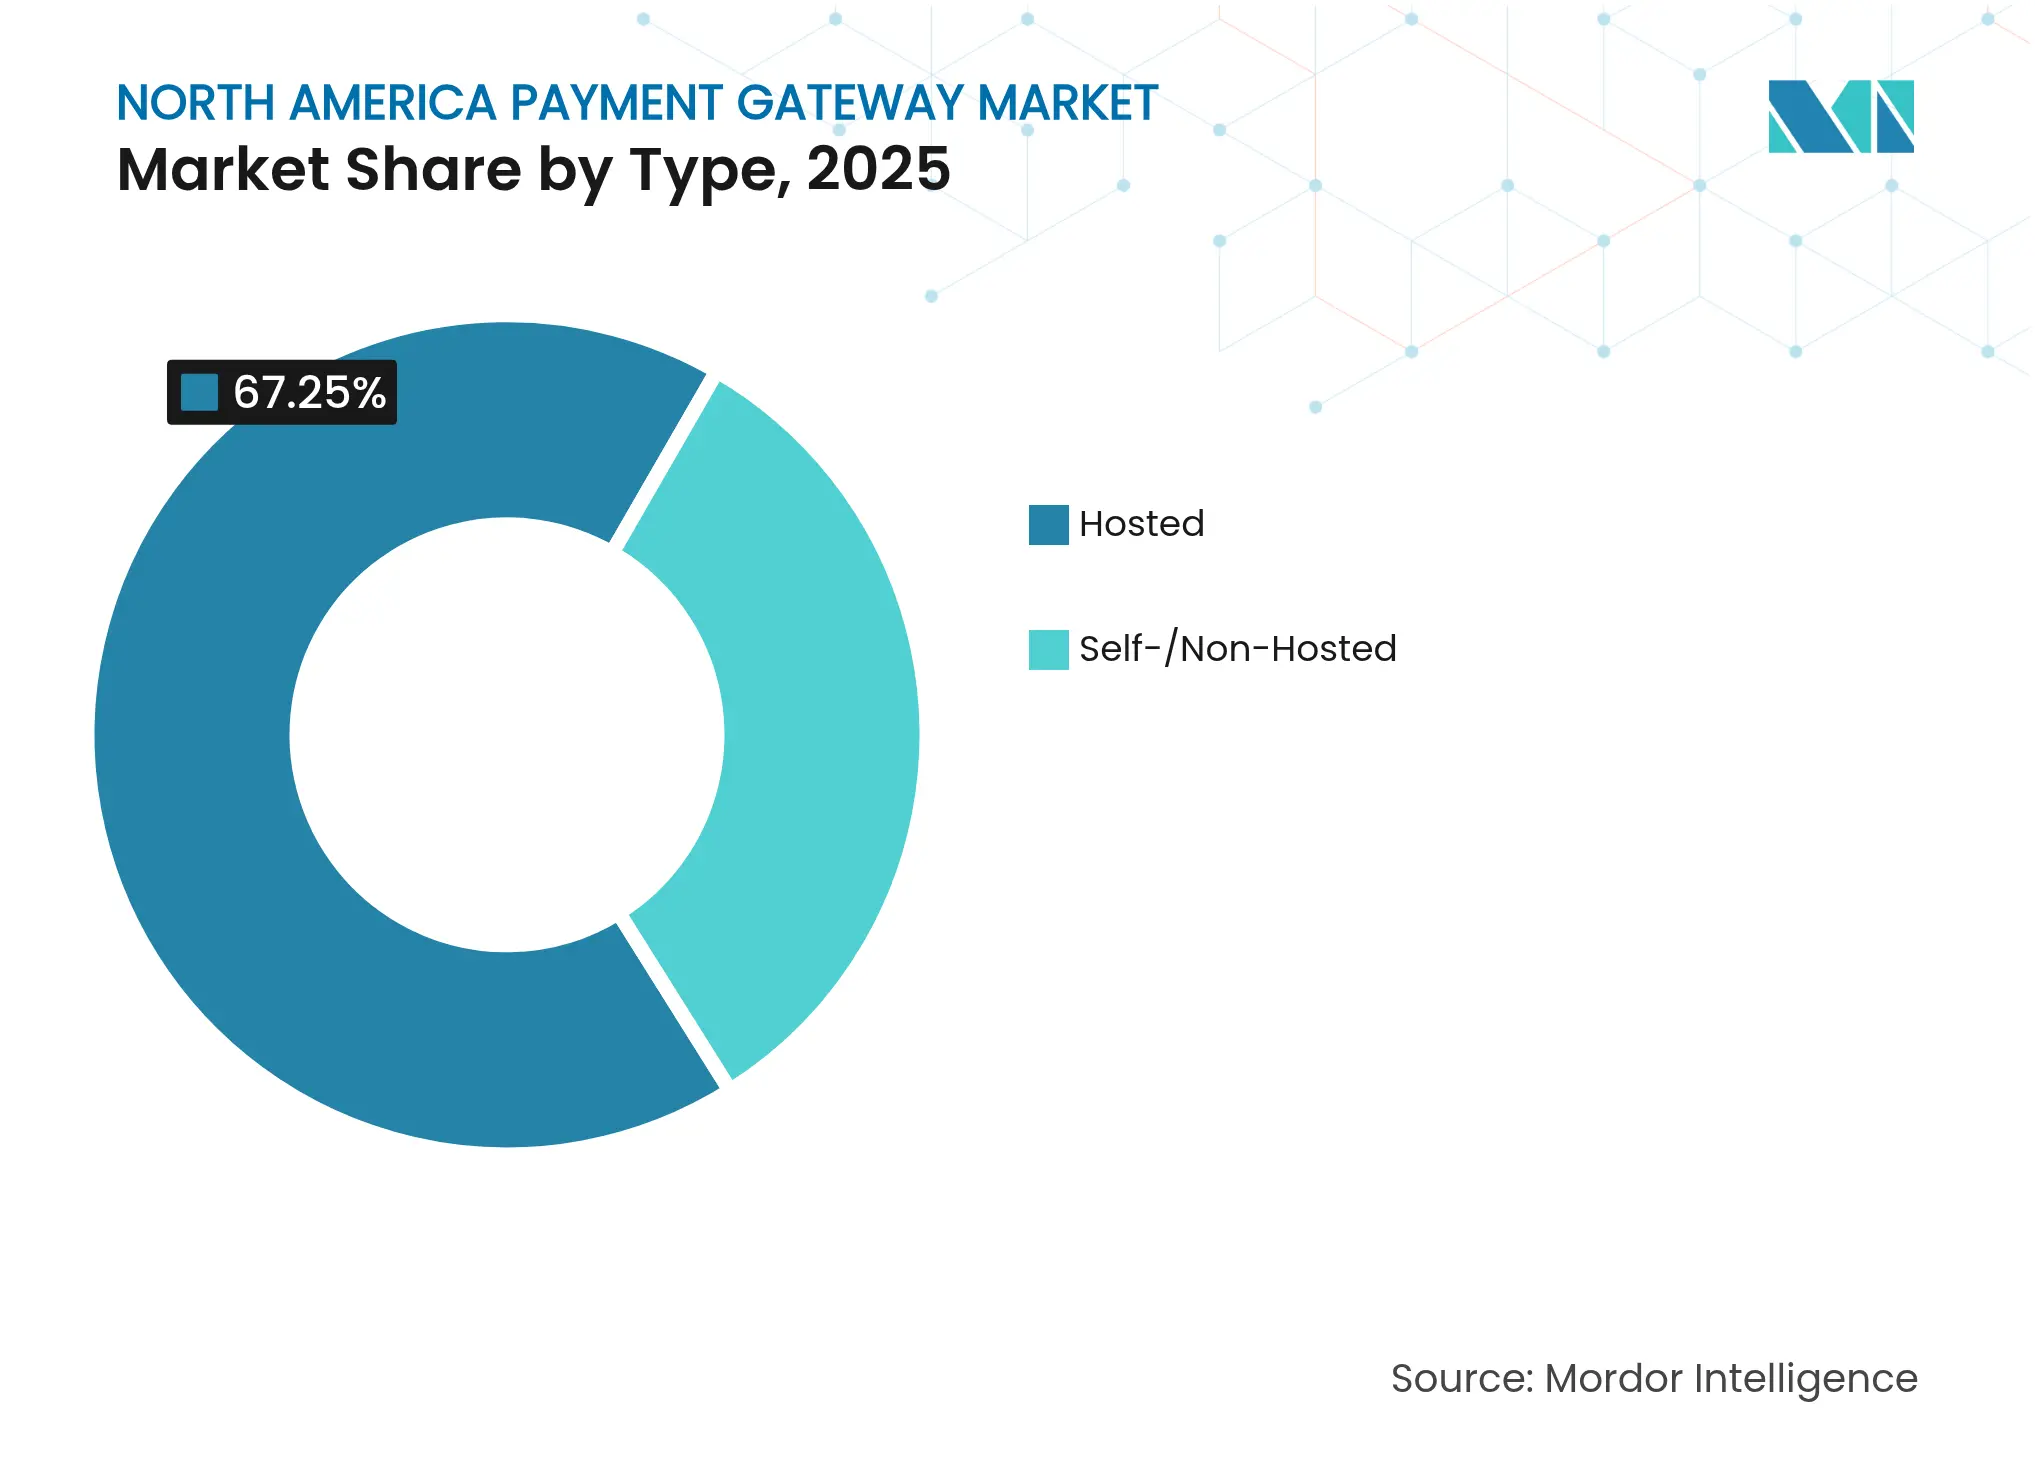
By Type: API-First Architectures Accelerate Market Evolution
Hosted gateways commanded 67.25% of 2025 transactions, securing the largest slice of the North America payment gateway market share due to turnkey compliance and quick launch. Self-/non-hosted deployments are growing faster at 24.9% CAGR, reflecting merchant appetite for deeper brand control and bespoke checkout flows. Providers are therefore re-engineering their stacks around modular micro-services that give merchants on-demand access to risk engines, token vaults, and alternative-payment rails.
API-first design now underpins both hosted and self-hosted offerings. Merchants measure vendors less on per-transaction cost and more on documentation clarity, sandbox fidelity, and versioning cadence. Stripe’s API release velocity illustrates why developer-led decision making is shaping supplier shortlists. As cloud-native infrastructure matures, hybrid models hosted front-ends with self-hosted tokenization blur traditional segmentation, making API governance the primary differentiator in the North America payment gateway market.
Note: Segment shares of all individual segments available upon report purchase
By Enterprise Size: SMEs Drive Innovation Despite Large-Enterprise Dominance
Large enterprises generated 59.55% of 2025 gateway revenue, reflecting higher ticket values and omnichannel complexity that often requires multiple vendor integrations. Despite a smaller baseline, SMEs are set to outpace with a 24.46% CAGR, propelled by grant-funded digitization and app-store style plug-ins. Gateway vendors are customizing onboarding kits pre-configured webhooks, auto-KYC flows, and embedded reconciliation tools to shrink time-to-live from weeks to days, an acute need for resource-constrained operators.
Solution roadmaps are bifurcating. Enterprise modules prioritize SAML authentication, payment data lakes, and cross-border treasury services, while SME bundles lean on guided dashboards and flat-rate pricing. Nomentia’s analysis of SME payment hubs confirms strong demand for single-pane-of-glass control that collapses ACH, card, and wallet reconciliation into one ledger. Vendors that straddle both ends of the segment spectrum secure resilience in the North America payment gateway industry.
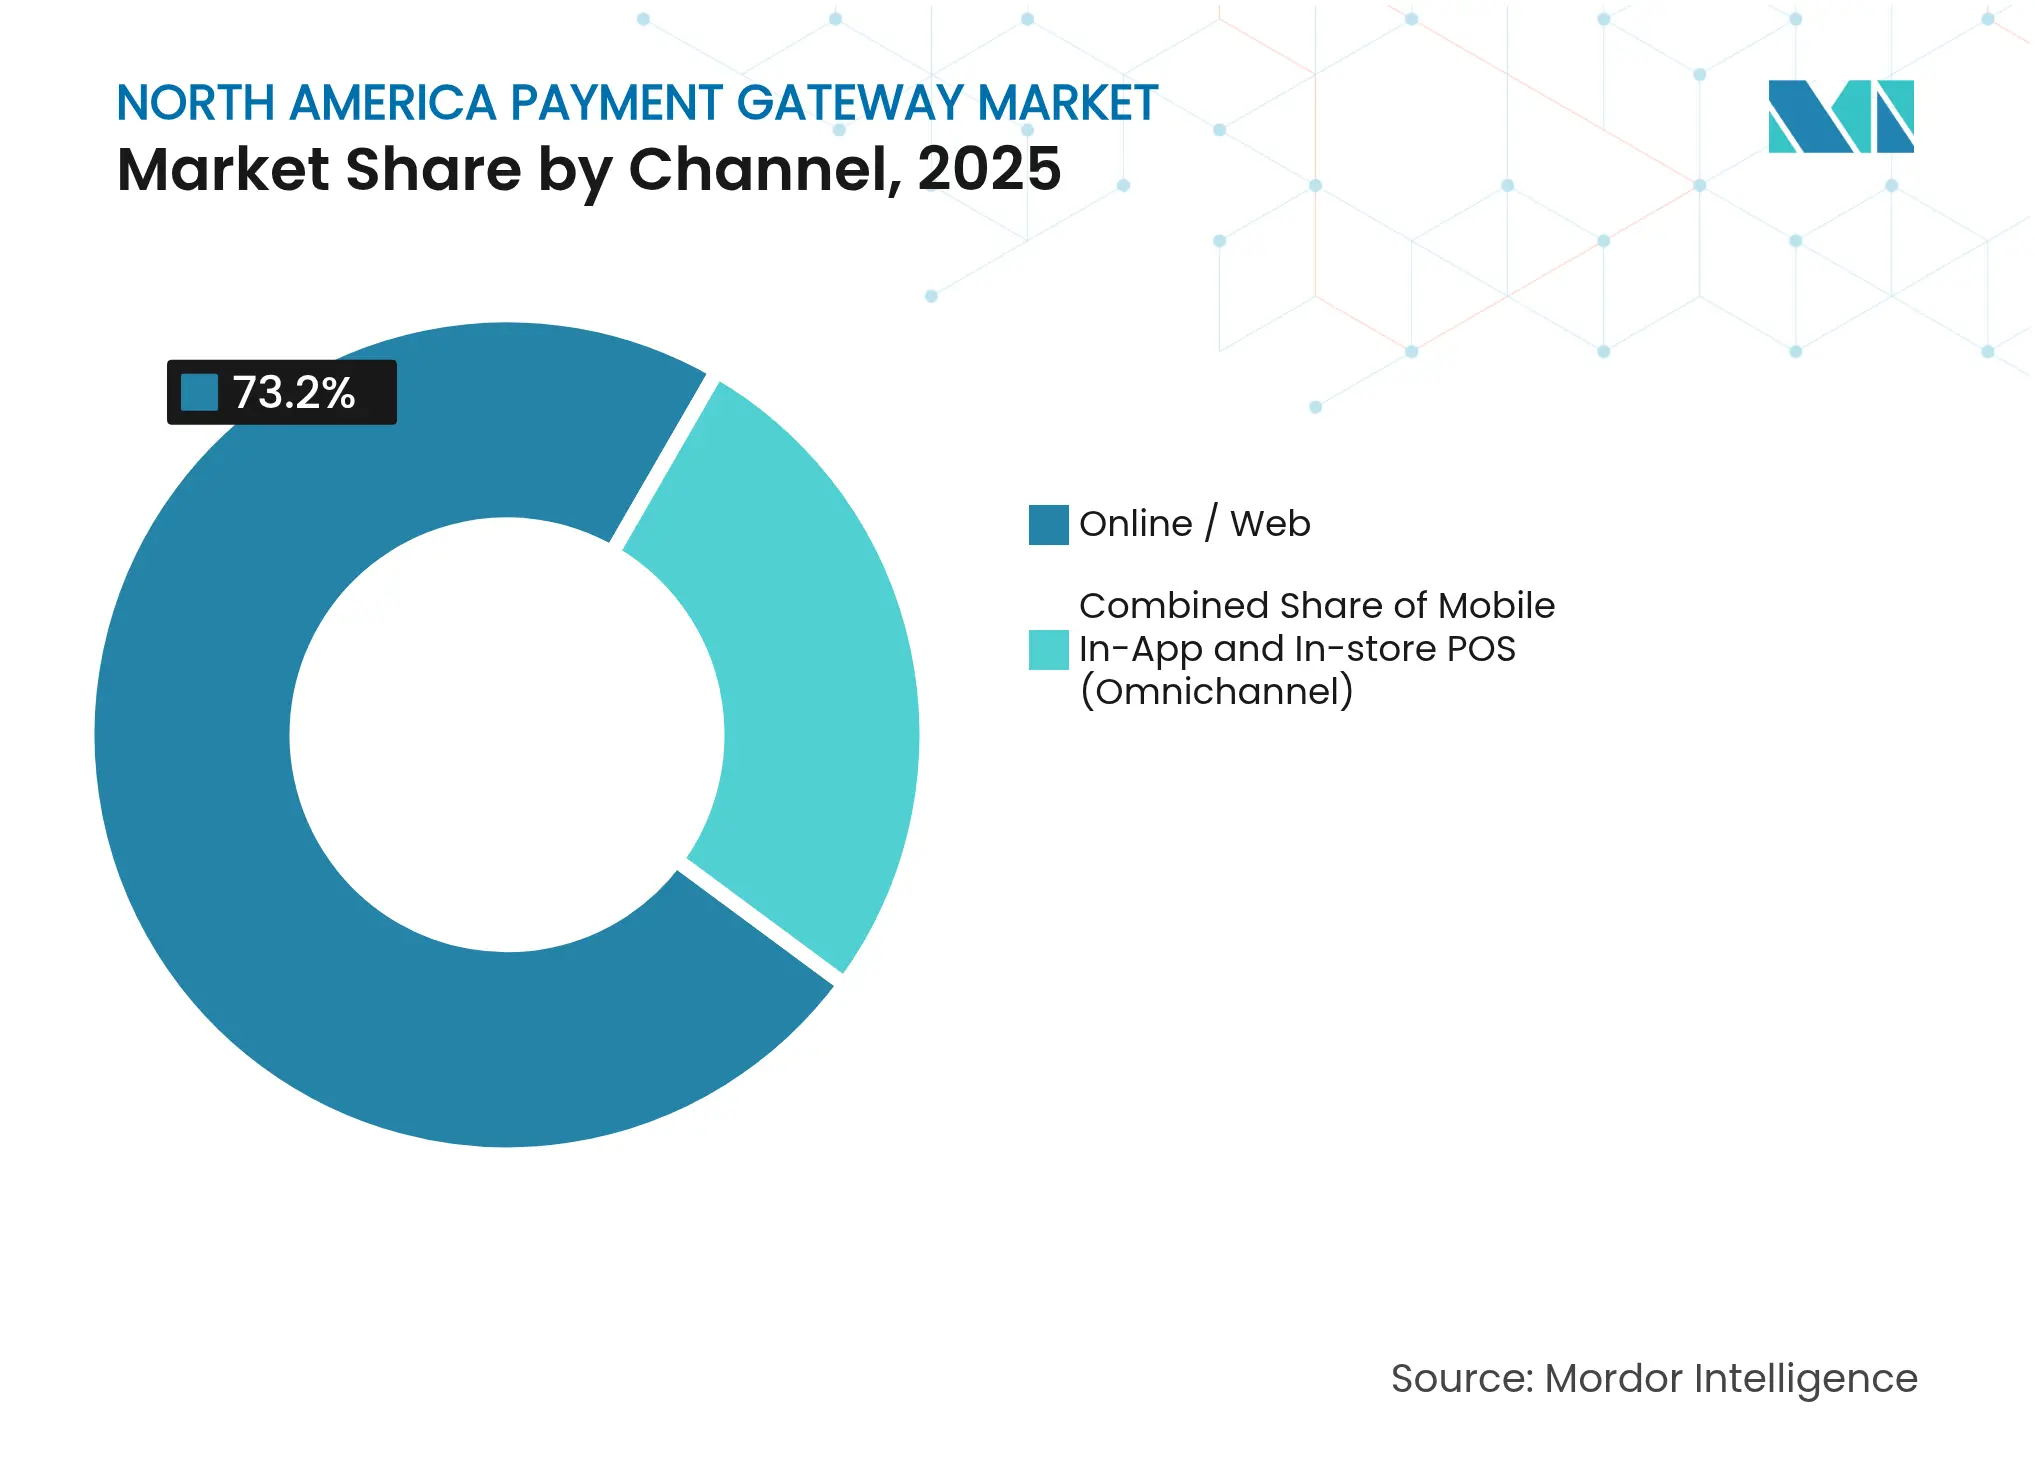
By Channel: Mobile In-App Transactions Reshape Gateway Requirements
Online/web checkouts still processed 73.20% of 2025 volume, anchoring the North America payment gateway market size at USD 14.87 billion in the base year. Mobile in-app flows, however, are forecast to rise at 26.75% CAGR, pushing the channel’s share steadily upward. The shift is forcing gateways to optimize for biometric authentication, deep-link payment sheets, and carrier-grade latency standards.
Device-native wallets are no longer optional. Thunes projects mobile-wallet value to hit USD 17 trillion globally by 2029. Concurrently, Tap to Pay on iPhone availability in Canada, rolled out by J.P. Morgan Payments and Sephora, evidences how POS innovation influences back-end gateway orchestration. Gateways that synchronize token lifecycle management across web, app, and in-store sessions are best placed to defend share.
Note: Segment shares of all individual segments available upon report purchase
By End-User Industry: Retail Dominance Challenged by Travel Sector Growth
Retail and e-commerce booked 45.72% of the total 2025 value, confirming the sector’s scale advantage and early adoption of gateways. Travel and hospitality, disrupted by pandemic headwinds, is rebounding at a projected 25.72% CAGR, injecting new volume and specialized requirements into the North America payment gateway market. Airlines now expect orchestration platforms that consolidate payment, refund, and ancillaries in a single API, evidenced by CellPoint Digital’s ability to manage 7.9 million transactions per hour.
Media & entertainment segments are likewise pioneering recurring-billing finesse and micro-content monetization, which demand granular token management to mitigate card-on-file risk. Gateways that modularize subscription logic and real-time entitlement checks will capture emerging spend. Diversification across verticals reduces revenue cyclicality and amplifies stickiness in the North America payment gateway market.
The United States generated 89.65% of 2025 turnover, anchoring the North America payment gateway market and benefiting from a broad consumer base and mature e-commerce adoption. Canada’s projected 23.88% CAGR through 2031 signals sharp catch-up potential, buoyed by Real-Time Rail roll-out and open banking frameworks aimed at modernizing retail payments.
Regulatory environments diverge. Canada’s Retail Payment Activities Regulations (SOR/2023-229) require gateway providers to hold segregated end-user funds and implement operational risk frameworks. The US operates under a mosaic of state-level consumer-privacy statutes, adding documentation overhead for multi-state merchants. Code of Conduct rules in Canada mandate transparent fee disclosure and restrict contract lock-ins, increasing merchant leverage during negotiations.
Cross-border commerce under USMCA introduces dual-currency invoicing and tax compliance challenges. Gateways that automate FX at mid-market spreads and pre-populate Harmonized System codes for customs are gaining wallet share. Providers that internalize these complexities enable merchants to address North-South corridors without bespoke integrations, enhancing their leadership in the North America payment gateway market.
Market Concentration
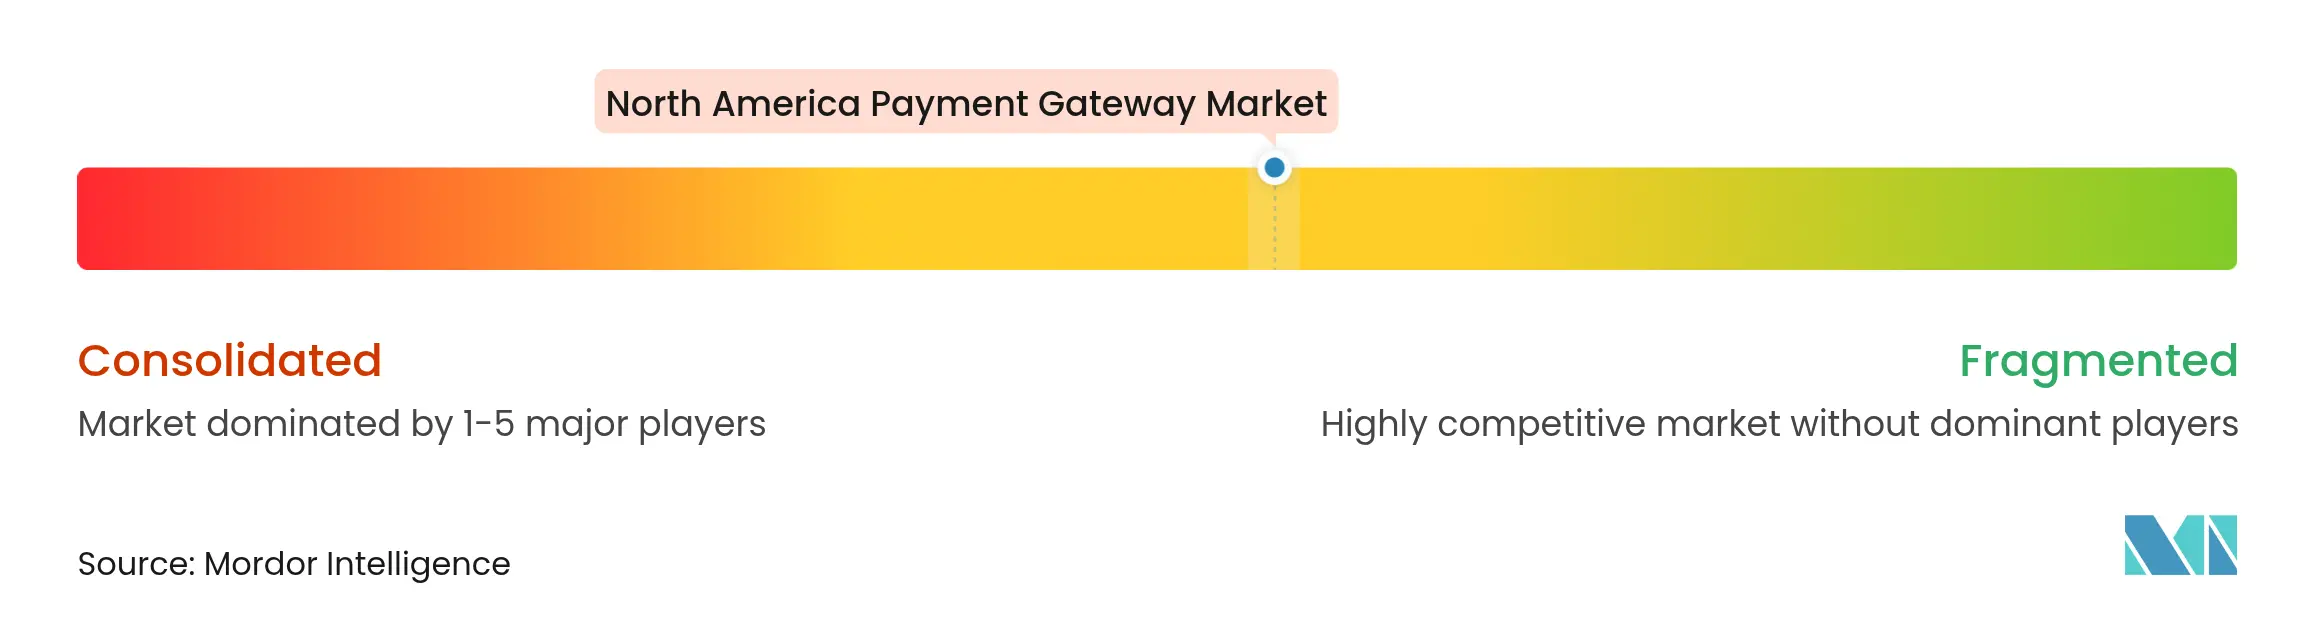
The market exhibits moderate concentration, with PayPal, Stripe, and Block Inc. among the top earners. Stripe processed USD 1.4 trillion in 2024 volume—a 38% year-on-year rise—securing 17.15% of global processing flows while fortifying its technology moat. PayPal is amplifying non-payment services, leveraging a USD 13.8 billion cash reserve to cross-sell working-capital and loyalty modules.
Incumbent banks are repurposing their settlement networks into merchant-facing products; J.P. Morgan Payments processed roughly USD 10 trillion daily and grew revenue 6% year-over-year to USD 4.7 billion in Q4 2024. Worldline and Crédit Agricole’s CAWL joint venture highlights how European acquirers enter North America through partnerships rather than direct greenfield builds.
Innovation focal points include network tokens—Visa reported 34% fraud reduction and 4.7% authorization uplift where tokens replace PAN data. Providers combining token vaults with machine-learning risk engines are setting the next performance bar. Consolidation pressures will persist as smaller PSPs face rising compliance costs, prompting M&A and ecosystem alliances within the North America payment gateway market.

*Disclaimer: Major Players sorted in no particular order
1. INTRODUCTION
2. RESEARCH METHODOLOGY
3. EXECUTIVE SUMMARY
4. MARKET LANDSCAPE
5. MARKET SIZE AND GROWTH FORECASTS (VALUE)
6. COMPETITIVE LANDSCAPE
7. MARKET OPPORTUNITIES AND FUTURE OUTLOOK
A payment gateway is a technology that retailers use to enable client debit or credit card purchases. The primary function of an online payment gateway is to authorize the exchange of money between a retailer and a customer. It is crucial to make an online purchase and authorize transactions between sellers and buyers.
The North American payment gateway market is segmented by type (hosted and non-hosted), enterprise (small and medium enterprise (SME) and large enterprise), end user (travel, retail, BFSI, media and entertainment, and other end users), and country (United States and Canada). The market size and forecasts are provided in terms of value (USD) for all the above segments.
Pricing Strategy for Semiconductor Components
3 Min Read
Accelerating Additive Manufacturing Adoption in India
3 Min Read
Unlocking Saudi Arabia’s Regional Tourism Growth Potential
5 Min Read
When decisions matter, industry leaders turn to our analysts. Let’s talk.