
Market Overview
| Study Period | 2021 - 2031 |
|---|---|
| Forecast Data Period | 2026 - 2031 |
| Base Year Market Size (2025) | USD 3.78 Billion |
| Market Size (2026) | USD 4.01 Billion |
| Market Size (2031) | USD 5.41 Billion |
| Growth Rate (2026 - 2031) | 6.14% CAGR |
| Market Concentration | Medium |
Major Players
*Disclaimer: Major Players sorted in no particular order Image © Mordor Intelligence. Reuse requires attribution under CC BY 4.0. |
|
North America Milk Protein Market Analysis by Mordor Intelligence
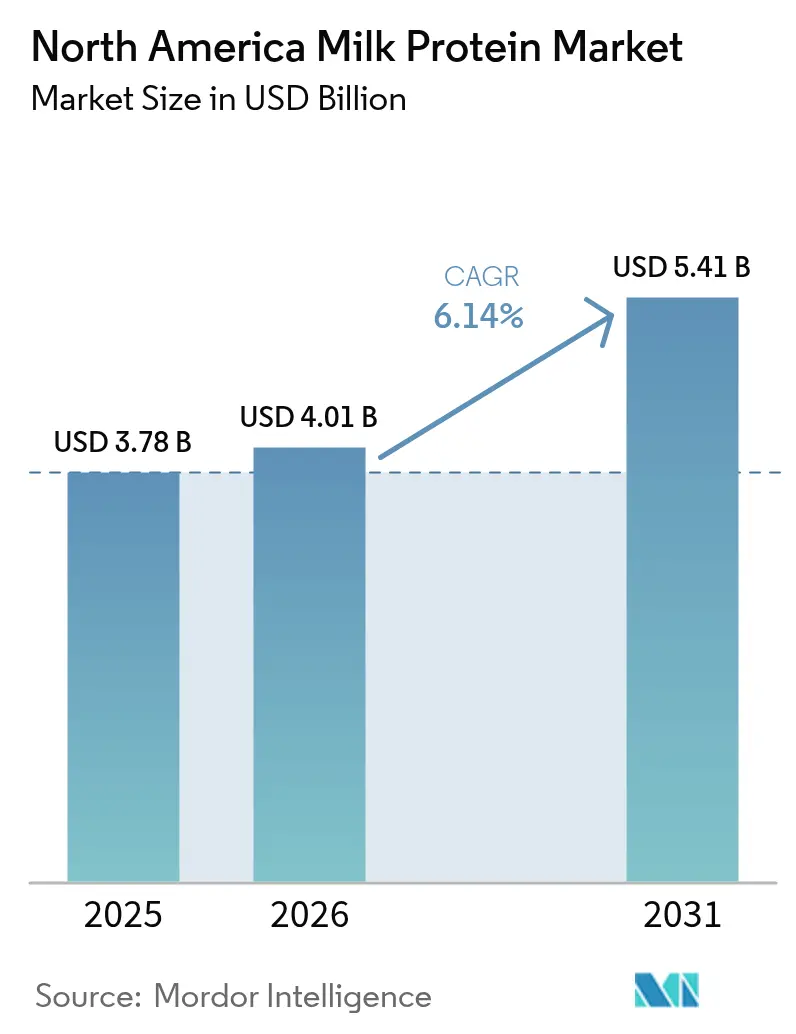
The North America milk protein market size was valued at USD 3.78 billion in 2025 and estimated to grow from USD 4.01 billion in 2026 to reach USD 5.41 billion by 2031, at a CAGR of 6.14% during the forecast period (2026-2031). This trajectory reflects structural shifts in consumer protein consumption rather than cyclical demand fluctuations. Sixty-one percent of Americans increased their protein intake in 2024 compared to 48% in 2019, with Gen Z consumers leading the charge at 66% adoption of high-protein diets [1]Source: International Food Information Council, "protein intake", ific.org. The simultaneous rise of GLP-1 medications for weight management has created an unexpected tailwind, as patients prioritize protein to preserve lean muscle mass during rapid weight loss [2]Source: U.S Food & Drug Administration, "GLP-1 medications", fda.gov. Sports-nutrition brands are introducing clear whey beverages that pair high protein density with light, juice-like sensory profiles, while food and beverage producers fortify mainstream bakery, snack, and dairy-alternative lines to improve amino-acid quality. Vertically integrated cooperatives in the United States are expanding ultrafiltration and spray-drying capacity, and cross-border trade provisions under USMCA allow U.S. suppliers to serve Mexico’s fast-growing middle-class demand. Margin volatility persists because of milk-supply contraction, higher feed costs, and H5N1-related biosecurity measures, yet structural demand resilience limits downside risk.
Key Report Takeaways
- By type, Milk Protein Concentrate held 86.65% of the North America milk protein market share in 2025, whereas Milk Protein Isolate is forecast to advance at a 6.92% CAGR through 2031.
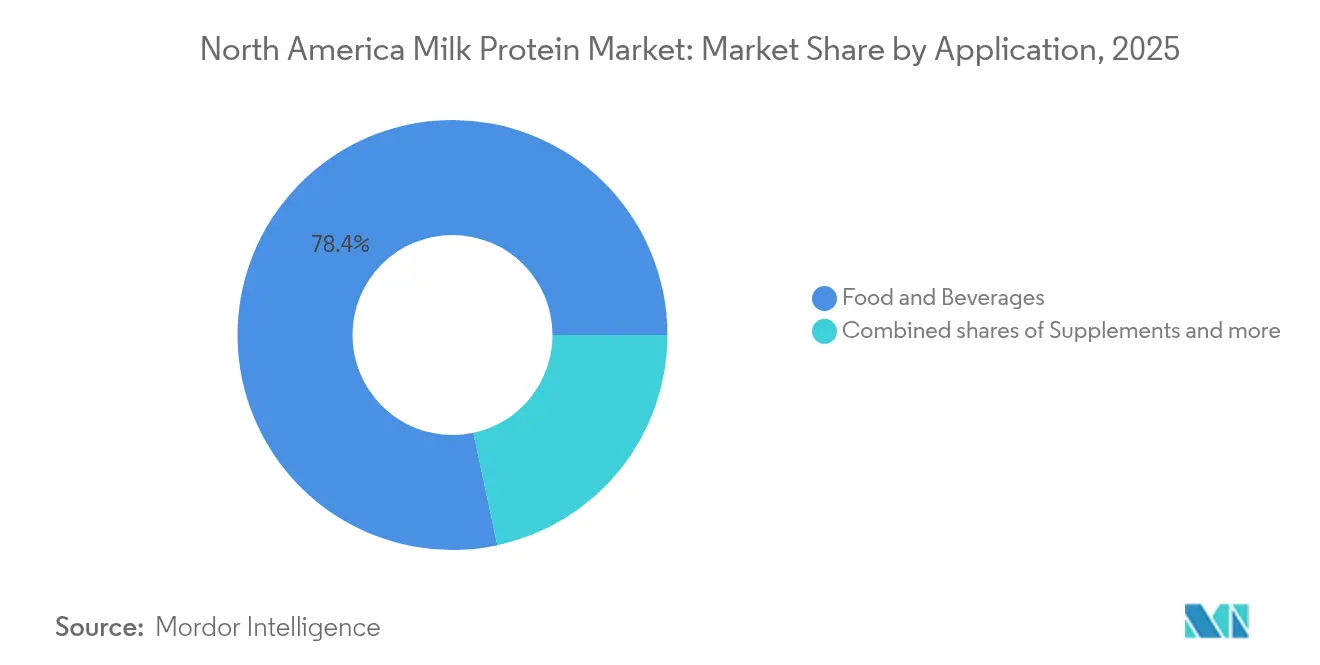
- By application, Food and Beverages commanded 78.35% of the North America milk protein market size in 2025, while Supplements is projected to record a 5.69% CAGR to 2031.
- By geography, the United States accounted for 84.95% of 2025 revenue, yet Mexico is expected to post the fastest 6.21% CAGR during 2026-2031.
Note: Market size and forecast figures in this report are generated using Mordor Intelligence’s proprietary estimation framework, updated with the latest available data and insights as of 2026.
North America Milk Protein Market Trends and Insights
Drivers Impact Analysis*
| Driver | (~) % Impact on CAGR Forecast | Geographic Relevance | Impact Timeline |
|---|---|---|---|
| Rising demand for high-protein diets among fitness-conscious consumers | +1.8% | United States, Canada, with spillover to Mexico's urban centers | Medium term (2-4 years) |
| Adoption of clean-label ingredients by food manufacturers | +1.2% | North America, strongest in the United States' premium retail channels | Long term (≥ 4 years) |
| Increased use of milk proteins in sports nutrition products | +1.5% | United States, Canada, particularly in ready-to-drink and bar formats | Short term (≤ 2 years) |
| Increasing popularity of dairy-based protein in meal replacements and snacks | +0.9% | United States, Canada, driven by Millennial and Gen Z demographics | Medium term (2-4 years) |
| Innovation in flavored and ready-to-use milk protein powders for convenience | +0.7% | United States, Canada, expanding to Mexico e-commerce channels | Short term (≤ 2 years) |
| Increasing R&D investments by manufacturers to create specialized proteins for clinical and pediatric nutrition | +1.0% | United States, Canada, with regulatory harmonization under the FDA and Health Canada | Long term (≥ 4 years) |
| Source: Mordor Intelligence | |||
Rising Demand for High-Protein Diets Among Fitness-Conscious Consumers
Social media platforms have transformed protein from a niche bodybuilding concern into a mainstream dietary priority, with TikTok and Instagram influencers amplifying high-protein meal plans to audiences that skew younger and more diverse than traditional fitness communities. Sixty-six percent of Gen Z consumers now follow high-protein diets, a cohort that historically prioritized plant-based eating but increasingly views dairy proteins as compatible with sustainability goals when sourced from regenerative agriculture systems. The proliferation of GLP-1 receptor agonists like semaglutide for weight management has created an unanticipated protein demand surge, as healthcare providers recommend 1.2 to 1.6 grams of protein per kilogram of body weight to mitigate muscle loss during pharmacologically induced weight reduction. This medical nutrition overlap positions milk proteins, particularly whey and casein blends, as functional ingredients rather than commodity additives. Quarterly whey protein ingredient sales in North America approached significant number, with ready-to-drink formats capturing share from powder-based products as convenience trumps cost per serving for time-constrained consumers[3]Source: U.S Department of Agriculture, "whey protein ingredient", ams.usda.gov.
Adoption of Clean-Label Ingredients by Food Manufacturers
Fifty-six percent of consumers express willingness to pay premium prices for products with recognizable ingredient lists, a threshold that favors milk proteins over synthetic isolates or heavily processed alternatives. The FDA's December 2024 update to the "healthy" nutrient content claim explicitly excludes protein isolates from the Food Group Equivalence calculation, inadvertently creating a regulatory advantage for whole-food protein sources like milk protein concentrate that deliver co-packaged calcium, phosphorus, and B vitamins. This rule change compels reformulation teams to reconsider ingredient hierarchies, particularly in breakfast cereals and snack bars, where "healthy" front-of-pack claims drive trial among health-conscious shoppers. Dairy cooperatives have responded by investing in non-GMO verification and grass-fed certifications; Organic Valley reported that its grass-fed whey protein sales grew in 2024, outpacing conventional whey by a 3-to-1 margin. Clean-label positioning also insulates milk proteins from the ultra-processed food backlash, as ingredient transparency audits by retailers and consumer advocacy groups increasingly flag additives with E-numbers or chemical-sounding names.
Increased Use of Milk Proteins in Sports Nutrition Products
Sports nutrition has evolved from a niche category dominated by tubs of unflavored powder into a USD 15 billion North American market spanning ready-to-drink shakes, protein bars, and single-serve sachets that compete directly with traditional snacks. Leucine content, the branched-chain amino acid most directly linked to muscle protein synthesis, gives whey protein isolate a biochemical edge over plant proteins, with 2.5 grams of leucine per 25-gram serving compared to 1.8 grams in pea protein isolate. Arla Foods Ingredients launched Lacprodan ISO. Clear in 2024, a whey protein isolate engineered for transparent, juice-like beverages that avoid the chalky mouthfeel consumers associate with traditional protein shakes. This innovation addresses a critical barrier to category expansion: sensory fatigue among frequent users who tire of creamy, milkshake-style products. Fonterra's Nutiani WPC-80, introduced in 2024, targets the value segment with an 80% protein whey concentrate that delivers cost savings of 15-20% versus isolates while maintaining solubility in cold water. The shift toward clear and light formats also aligns with hydration trends, as consumers increasingly view protein beverages as functional refreshment rather than meal replacements.
Increasing Popularity of Dairy-Based Protein in Meal Replacements and Snacks
Portable nutrition has migrated from clinical settings, where meal replacement shakes served patients with dysphagia or malnutrition, into mainstream retail as time-pressed professionals and parents seek satiating alternatives to traditional meals. Millennials and Gen Z consumers, who comprise 58% of meal replacement purchasers, prioritize convenience and macronutrient balance over calorie restriction, a shift that favors high-protein formulations with 20-30 grams per serving. Milk protein concentrate offers formulators a cost-effective base that delivers both fast-digesting whey and slow-digesting casein, creating a sustained amino acid release that extends satiety for 3-4 hours post-consumption. The FDA's March 2024 qualified health claim for yogurt and type 2 diabetes risk reduction has amplified interest in dairy proteins' metabolic benefits, prompting snack brands to highlight milk-derived ingredients on front-of-pack labels. Ready-to-eat protein snacks, including cheese crisps, protein puffs, and fortified granola, grew in dollar sales during 2024, outpacing traditional salty snacks by a factor of three. This category expansion benefits milk protein suppliers by creating demand for specialized ingredients like micellar casein and native whey, which command 25-40% price premiums over commodity whey protein concentrate.
Restraints Impact Analysis*
| Restraint | (~) % Impact on CAGR Forecast | Geographic Relevance | Impact Timeline |
|---|---|---|---|
| Lactose intolerance limiting consumer acceptance of milk proteins | -0.6% | United States (higher among African American, Hispanic, Asian American populations), Canada | Medium term (2-4 years) |
| Stringent regulatory approvals for functional and enriched foods | -0.4% | United States (FDA), Canada (Health Canada), Mexico (COFEPRIS) | Long term (≥ 4 years) |
| Competition from plant-based protein alternatives | -0.8% | United States, Canada, particularly in retail grocery and foodservice channels | Short term (≤ 2 years) |
| Supply chain disruptions affecting milk protein availability | -0.5% | United States (primary production region), with spillover to Canada and Mexico | Short term (≤ 2 years) |
| Source: Mordor Intelligence | |||
Lactose Intolerance Limiting Consumer Acceptance of Milk Proteins
Approximately 36% of the United States population experiences some degree of lactose malabsorption, with prevalence reaching 80% among African Americans, 80-100% among American Indians, 90-100% among Asian Americans, and 50-80% among Hispanic/Latino populations, according to the National Institute of Diabetes and Digestive and Kidney Diseases. This demographic reality constrains addressable market size, particularly as ethnic diversity increases. The U.S. Census Bureau projects that non-Hispanic whites will comprise less than 50% of the population by 2045. However, most individuals with lactose intolerance can consume up to 12 grams of lactose per day without symptoms, equivalent to one cup of milk, and many milk protein ingredients contain minimal residual lactose after ultrafiltration processing. Milk Protein Isolate typically contains less than 1% lactose, compared to 4-5% in fluid milk, positioning it as a viable option for lactose-sensitive consumers when paired with appropriate labeling. The rise of lactose-free dairy products, which grew in dollar sales during 2024, demonstrates that enzymatic lactose hydrolysis can preserve the sensory and functional properties of milk proteins while expanding consumer accessibility. Manufacturers are also exploring A2 beta-casein milk proteins, which some consumers report cause less digestive discomfort than conventional A1 milk, though peer-reviewed evidence remains inconclusive.
Stringent Regulatory Approvals for Functional and Enriched Foods
The FDA's December 2024 revision to the "healthy" nutrient content claim introduced a paradox for protein-fortified foods: while the rule encourages higher protein content, it simultaneously excludes protein isolates from Food Group Equivalence calculations, complicating front-of-pack messaging for products like protein bars and fortified cereals. Each new functional claim requires either a GRAS self-determination or a formal FDA GRAS notice, a process that can span 12-18 months and cost USD 50,000 to USD 150,000 in toxicology studies and regulatory consulting. Arla Foods Ingredients' β-lactoglobulin GRAS notice, filed in 2024, exemplifies the documentation burden: the submission included protein characterization, manufacturing process validation, dietary exposure assessments, and safety studies across multiple animal models. Canada's supplemented foods regulations impose additional complexity, requiring pre-market authorization for any food containing added amino acids or protein hydrolysates above specified thresholds, effectively creating a dual-track approval process for North American launches. Mexico's COFEPRIS has tightened scrutiny of health claims on protein products, mandating clinical substantiation for any statement implying disease risk reduction or physiological benefit. These regulatory frictions disproportionately impact smaller manufacturers who lack dedicated regulatory affairs teams, entrenching the competitive advantage of multinational ingredient suppliers.
*Our forecasts treat driver/restraint impacts as directional, not additive. The impact forecasts reflect baseline growth, mix effects, and variable interactions.
Segment Analysis
By Type: Isolate Gains Despite Concentrate Dominance
Milk Protein Concentrate captured 86.65% market share in 2025, a dominance rooted in its cost-effectiveness and versatility across bakery, beverage, and dairy alternative applications where 70-85% protein content suffices. Yet Milk Protein Isolate will expand at 6.92% CAGR through 2031, the fastest growth among protein types, as sports nutrition brands prioritize formulations exceeding 90% protein to maximize per-serving protein density while minimizing carbohydrates and fats. Clear whey beverage innovations, exemplified by Arla's Lacprodan ISO.Clear launched in 2024, require the near-complete removal of lipids and minerals that would cause turbidity, a specification only isolates can meet. Hydrolyzed Milk Protein occupies a specialized niche in infant formula and medical nutrition, where pre-digested peptides reduce allergenicity and accelerate absorption; the FDA's 2024 infant formula guidance emphasizing protein quality metrics like DIAAS has prompted manufacturers to reformulate with hydrolyzed whey fractions that better mimic human breast milk amino acid profiles.
Concentrate's market leadership reflects its dual functionality as both a protein source and a texturizing agent in processed foods. Bakery applications leverage concentrate's water-binding capacity to extend shelf life and improve crumb structure, while beverage formulators use it to create body and mouthfeel in protein-fortified juices and smoothies. The 13-15% lactose content in most concentrates limits use in lactose-free products but provides a natural sweetness that reduces added sugar requirements, aligning with clean-label trends. Isolate's premium pricing, typically 25-40% above concentrate on a per-pound basis, restricts adoption to applications where protein purity justifies the cost, such as ready-to-drink shakes targeting athletes and meal replacements marketed to weight management consumers. Membrane filtration technology advances, including ceramic membranes that tolerate higher operating temperatures and pressures, are gradually narrowing the cost gap by improving isolate production yields.




By Application: Supplements Accelerate as Food & Beverage Matures
Food and Beverages commanded 78.35% of market volume in 2025, spanning bakery fortification, protein-enriched beverages, dairy and dairy alternative products, ready-to-eat meals, and snacks, yet the Supplements segment will grow fastest at 5.69% CAGR through 2031 as infant formula, sports nutrition, and elderly nutrition applications converge on high-quality protein as a core functional ingredient. Within Food and Beverages, bakery applications benefit from milk protein's ability to improve dough elasticity and water retention, extending shelf life by 2-3 days in commercial bread production, a critical advantage for retailers seeking to reduce waste. Dairy and dairy alternative products increasingly incorporate milk protein to bridge the nutritional gap between plant-based milks and bovine milk; pea-milk blends fortified with whey protein isolate deliver 8-10 grams of complete protein per serving, matching dairy milk's amino acid profile while maintaining vegan-friendly front-of-pack positioning for flexitarian consumers.
Supplements' accelerated growth trajectory reflects demographic and regulatory tailwinds. The aging of North America's population, with the 65+ cohort projected to reach 73 million by 2030, is driving demand for medical nutrition products that address sarcopenia, with leucine-enriched milk proteins offering superior muscle protein synthesis versus plant alternatives. Sports and performance nutrition, while more mature than clinical segments, continues to expand as protein supplementation normalizes beyond hardcore athletes. Animal feed applications remain marginal in North America, where high-value human nutrition uses absorb most milk protein production, unlike Europe, where whey permeate finds significant use in piglet starter feeds. Personal care and cosmetics applications, though small in volume, command premium pricing for milk-derived peptides used in anti-aging serums and hair care products, with brands like Drunk Elephant and The Ordinary incorporating whey protein hydrolysates for their collagen-boosting properties.
Geography Analysis
The United States held 84.95% of North America's milk protein market in 2025, a concentration reflecting the country's vertically integrated dairy cooperatives, advanced processing infrastructure, and proximity to end-use manufacturers in sports nutrition and clinical nutrition. Dairy Farmers of America, Hilmar Cheese, Leprino Foods, and Idaho Milk Products collectively operate over 40 milk protein production facilities across the Upper Midwest and Southwest, benefiting from low-cost milk supply in regions like Wisconsin, California, and New Mexico.
Yet Mexico will expand fastest at 6.21% CAGR through 2031, propelled by urbanization rates exceeding 80%, a growing middle class with rising disposable incomes, and USMCA trade provisions that facilitate duty-free ingredient imports from U.S. suppliers. Mexican consumers are shifting from traditional protein sources like beans and pork toward convenient, shelf-stable formats including protein bars, fortified beverages, and instant breakfast drinks, a transition mirroring South Korea's trajectory a decade earlier. Canada's market, while smaller in absolute terms, exhibits sophisticated regulatory frameworks that shape product innovation. Health Canada's 2024 approval of Remilk's precision-fermentation β-lactoglobulin signals openness to novel production methods, potentially positioning the country as a test market for animal-free dairy proteins before broader North American rollout. The FrieslandCampina-Vitalus Nutrition joint venture in Ontario produces specialized infant formula proteins for export to Asian markets, leveraging Canada's reputation for food safety and traceability. The rest of North America, encompassing Caribbean and Central American markets, remains import-dependent and price-sensitive, with limited domestic processing capacity constraining growth to population-driven demand increases. Cross-border supply chains are tightening; U.S. cheese exports grew 5.5% in 2024, driven by Mexican demand for mozzarella and cheddar used in processed foods, while whey protein concentrate shipments to Mexico increased 8% as local sports nutrition brands scaled production.
Regulatory Landscape
Milk protein ingredients sold into North America fall under food standards, allergen labeling, and product-claim controls, which influence both formulation choices and time-to-market. In the United States, FDA standards of identity for dairy foods (21 CFR Part 131) limit the use of milk protein concentrates in standardized products such as certain cheeses, which pushes many fortified applications into non-standardized categories where naming and labeling details are central to compliance. Across the region, milk is a major allergen, so labeling requirements remain prominent for ingredients such as milk protein concentrate, milk protein isolate, and whey fractions.
Canada regulates dairy composition and labeling through the Safe Food for Canadians Regulations and the Canadian Standards of Identity (Volume 1), with additional specifications in documents such as the Canadian Grade Compendium (Volume 4) covering microbiological and compositional requirements for products like casein and caseinates. For novel and recombinant dairy proteins, Health Canadas Novel Food pathway is a key gate, as shown by Health Canadas 2024 approval of precision-fermentation beta-lactoglobulin, indicating that animal-free dairy proteins can reach market under defined safety assessment and labeling expectations.
Value Chain Analysis
The North America milk protein value chain starts with on-farm milk production and procurement, often via cooperatives, and moves into primary processing into cheese and other dairy products that generate whey and skim streams as the main feedstocks for concentration. Midstream value creation is concentrated in membrane filtration (ultra/microfiltration, nanofiltration), evaporation, and spray drying, which convert liquid streams into milk protein concentrate, milk protein isolate, whey protein concentrate/isolate, and specialty fractions. This stage is highly capital intensive and tends to favor vertically integrated cooperatives and large processors with scale. A recent proof point is Agropurs installation of a nanofiltration system at its Lake Norden, South Dakota plant, which reflects continued investment in higher-margin whey-derived powders.
Downstream channels include bulk ingredient sales to food and beverage manufacturers (bakery, beverages, snacks, dairy and dairy alternatives) as well as to supplements and medical nutrition. Distribution typically runs through direct contracts, ingredient distributors, and specialized blenders that configure tailored functional systems. A structural bottleneck remains tied to cheese output, so incremental protein capacity depends on major additions in filtration and drying infrastructure rather than simple debottlenecking. On pricing and contracting, US regulatory and market mechanisms influence returns for components used in protein production, including the amended Federal Milk Marketing Order skim milk composition factors implemented in 2025, which better align payment formulas with observed component trends.
Competitive Landscape
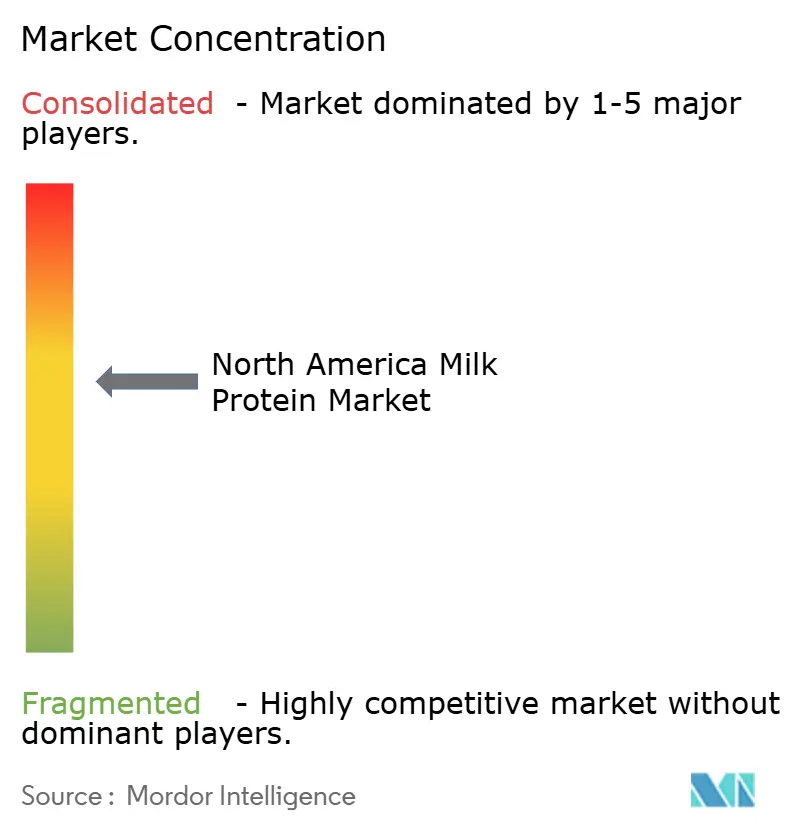
The North America milk protein market registers moderate concentration, with players like Dairy Farmers of America, Glanbia, Fonterra, Hilmar Cheese, and Leprino Foods. Regional cooperatives and specialized processors retain competitive niches in organic, grass-fed, and non-GMO segments. Strategic emphasis has shifted from horizontal consolidation toward vertical integration and capacity expansion; Dairy Farmers of America's USD 200 million investment in its Clovis, New Mexico, facility in 2024 exemplifies the preference for greenfield and brownfield projects that add 20,000-30,000 metric tons of annual whey protein concentrate capacity rather than acquiring competitors.
Glanbia's August 2024 divestiture of its Performance Nutrition consumer brands to Bain Capital for USD 2.3 billion represents a strategic retreat from downstream competition with customers, allowing Glanbia Nutritionals to focus on ingredient solutions where it holds proprietary bioactive extraction technologies. Opportunities are emerging at the intersection of precision fermentation and traditional dairy processing, where companies like Arla Foods Ingredients are filing GRAS notices for recombinant milk proteins that can be produced without lactose, enabling truly allergen-free formulations for sensitive populations.
Membrane filtration technology patents filed in 2024 reveal a race to reduce energy consumption and water usage in protein concentration processes, with ceramic membrane systems demonstrating 30-40% lower operating costs versus polymeric membranes in pilot-scale trials. Smaller players like AMCO Proteins and Actus Nutrition are carving defensible positions through organic and grass-fed certifications that command 25-35% price premiums in natural channel retail, a strategy that insulates them from commodity price volatility while accessing consumers willing to pay for provenance and animal welfare attributes.
North America Milk Protein Industry Leaders
-
Dairy Farmers of America, Inc.
-
Glanbia PLC
-
Fonterra Co‑operative Group
-
Saputo Inc.
-
Arla Foods Ingredients Group P/S
- *Disclaimer: Major Players sorted in no particular order

Market Opportunities and Future Outlook
Product and process investments across the region are widening the role of milk proteins beyond traditional powders, particularly where manufacturers need reliable supply, customized functionality, and cleaner labels. In 2026, Idaho Milk Products opened a USD 190 million ice cream and powder blending facility in Jerome, Idaho, adding large-scale blending and dry handling capability that supports tailored protein systems for food and beverage and nutrition customers. Capacity additions in dairy processing also broaden the upstream base that ultimately feeds whey and dairy ingredient streams into protein fractionation and drying, including Schreiber Foods USD 132.9 million expansion in Shippensburg, Pennsylvania (announced 2026) and Upstate Niagara Cooperatives West Seneca, New York project.
Opportunities also show up where trade and regulatory frictions raise the value of higher-protein, higher-value forms and clearer ingredient definitions. USMCA dynamics and Canadian policy discussions have increased focus on product form and classification, with industry attention shifting toward protein isolates in part to navigate export thresholds that more directly affect traditional skim milk powder and some milk protein concentrate flows. In Canada, CFIA consultations on common names for milk ingredients, including differentiation of modified milk ingredients and milk-derived ingredients, create whitespace for suppliers that can align naming, specifications, and customer labeling needs, supporting both retail claims and cross-border ingredient sourcing.
Recent Industry Developments
- May 2026: Idaho Milk Products opened a USD 190 million ice cream and powder blending facility in Jerome, Idaho, adding large-scale blending and dry handling capacity. The site is positioned to support higher-throughput, more customized dairy ingredient formats that complement milk protein and whey protein supply into food, beverage, and nutrition applications.
- December 2025: FrieslandCampina Ingredients announced plans to acquire Wisconsin Whey Protein, a US producer of whey protein isolate, alongside a planned facility expansion to more than double isolate production capability. The move deepens its North American footprint in high-value whey and milk protein ingredients and strengthens its ability to serve sports nutrition and functional food customers with tighter specifications.
- August 2024: Fonterra signaled a strategic shift toward Business-to-Business channels by prioritizing ingredients and foodservice while moving away from select consumer and integrated businesses. This reallocation of focus supports greater emphasis on ingredient portfolios such as whey and milk protein offerings sold into large-scale manufacturers.


Research Methodology Framework and Report Scope
Market Definition and Coverage
For this study, the market covers milk-derived protein ingredients sold in North America and used in food, beverage, nutrition, and related formulations. The value is measured as revenues generated from selling milk protein products across the region during the study period.
Scope exclusions: This estimate excludes raw fluid milk, lactose and dairy fats, and finished consumer products where milk protein is only one of many ingredients.
Segmentation Overview
-
By Type
- Milk Protein Concentrate
- Milk Protein Isolate
- Hydrolyzed Milk Protein
-
By Application
- Animal Feed
- Personal Care and Cosmetics
-
Food and Beverages
- Bakery
- Beverages
- Breakfast Cereals
- Condiments/Sauces
- Dairy and Dairy Alternative Products
- Meat/Poultry/Seafood and Meat Alternative Products
- RTE/RTC Food Products
- Snacks
-
Supplements
- Baby Food and Infant Formula
- Elderly Nutrition and Medical Nutrition
- Sport/Performance Nutrition
-
Geography
- United States
- Canada
- Mexico
- Rest of North America
Data Sources, Market Sizing, and Validation
Desk Research
Desk work started by mapping what is produced, traded, and consumed across the United States, Canada, and Mexico, and then aligning that with how milk proteins are used in packaged foods and sports nutrition. We relied on public datasets and technical references to keep assumptions grounded, especially when product labels and ingredient naming vary across countries.
Core sources included public materials such as USDA dairy and ingredients statistics, Statistics Canada dairy publications, the US International Trade Commission trade data, and UN Comtrade import and export series, followed by regulatory and standards references such as FDA guidance for food ingredients and Codex/IDF technical documents. Company annual reports, investor presentations, and press releases were used to sanity check capacity additions, plant utilization comments, and mix shifts across concentrates, isolates, and hydrolyzed proteins. Where it improved coverage, a paid subscription for company financials, patent databases, and an import and export shipment-level database was used to validate entity activity and directional trade flows. These examples are not exhaustive, and other sources were also reviewed to collect data, validate assumptions, and clarify open questions.
Primary Interviews and Surveys
Primary interviews and surveys were used to test demand signals and pricing logic, and then to confirm what portion of dairy-protein value should sit inside the milk-protein scope. We spoke with a balanced set of stakeholders across ingredient producers, distributors, and downstream users such as food formulators and sports nutrition brands, and coverage was spread across North America to reduce single-country bias.
Distribution of primary research fieldwork respondents
| Company type | Respondent position | Region |
|---|---|---|
| Top tier: 25% | CXOs: 15% | |
| Mid tier: 55% | Functional/Unit leaders: 30% | |
| Smaller Players: 20% | Managers: 55% |
Market-Sizing & Forecasting
Sizing was built using top-down and bottom-up logic, with the main structure coming from a demand-pool view tied to dairy ingredient consumption in North America. We started from protein ingredient usage across key application pools, then filtered to milk-protein types using inclusion rules and typical formulation rates, before values were derived through price ranges that align with traded and contracted behavior.
Inputs that shaped the model included milk solids availability, trade flows of milk protein concentrates and isolates, utilization of filtration and drying capacity, application-level demand trends in sports nutrition and functional foods, and observed price spreads between concentrates, isolates, and hydrolyzed proteins. When data points were missing by country or by type, gaps were handled using proxy ratios based on trade shares and validated conversion factors, and then adjusted after interview feedback.
Forecasts were developed using scenario analysis around a base case, where volumes were driven by end-use growth and product reformulation trends, and prices were guided by expected dairy input cost movement and mix shift toward higher protein content. Assumptions were re-checked with experts so the final curve reflects what buyers and sellers expect, not only historic time series behavior.
Data Validation & Update Cycle
Validation was done by checking whether modeled demand aligns with independent signals such as dairy solids supply trends, ingredient import and export direction, and publicly stated capacity changes from producers. Large variances triggered a second review of conversion factors, country weights, and the price bands used for each milk protein type, followed by outreach when the gap could not be explained by seasonality or mix.
Before sign-off, outputs go through multi-step analyst review, with checks on year-to-year movements, unit consistency, and whether the narrative drivers align with the numbers. Reports are refreshed annually, and interim updates are made when material events occur such as major capacity additions, trade policy shifts, or sharp dairy input price swings. Right before delivery, a fresh pass is completed so the output reflects the latest updated view.
Mordor Intelligence's North America Milk Protein Market Size Compared With Other Published Estimates
Published market values for North American milk protein often do not match because groups choose different product boundaries and they also treat adjacent dairy proteins differently. The mix of years used, how prices are averaged, and how trade is netted out can also move the final number, even when the same region is being discussed.
The largest gaps usually come from scope and pricing logic. For example, some estimates blend broader dairy protein ingredients or count certain whey streams that are not consistently sold as milk protein ingredients. Another common driver is how ASP progression is handled, where one study may apply a single regional average price while another applies type-specific ranges that reflect concentrates versus isolates, and then validates those bands through interviews and trade-linked checks.
Benchmark comparison
| Source | Market Size | Gaps in Research Methodology |
|---|---|---|
| Mordor Intelligence | USD 3.78 B (2025) | |
| Trade Journal A | USD 4.23 B (2025) | Uses a broader ingredient bucket that can fold in dairy proteins beyond milk protein, and applies a single average price with limited visibility on concentrate versus isolate mix. |
| Industry Association B | USD 3.45 B (2025) | Leans more on member-reported volumes, which can undercount cross-border shipments and private-label ingredient supply, and often holds pricing conservative during dairy input volatility. |
The table shows a spread around the same base year, and in Mordor Intelligence's model the total is built only from milk protein ingredient types sold into North America, with type-level price bands and trade-linked checks applied before final aggregation. In practice, once scope is kept tight and price and mix are handled consistently, the output becomes easier to trace back to clear drivers and to re-run as new capacity, trade, and demand signals appear.


Key Questions Answered in the Report
What is the current value of the North America milk protein market?
The market stands at USD 4.01 billion in 2026.
How fast is the segment for Milk Protein Isolate expanding?
Milk Protein Isolate is forecast to grow at 6.92% CAGR between 2026 and 2031.
Which application area is growing quickest in North America?
The Supplements segment is projected to record a 5.69% CAGR through 2031.
Why is Mexico the fastest-growing geography?
Urbanization, rising middle-class income, and duty-free access to U.S. ingredients under USMCA are driving a 6.21% CAGR outlook.
Page last updated on:






