
Market Overview
| Study Period | 2021 - 2031 |
|---|---|
| Forecast Data Period | 2026 - 2031 |
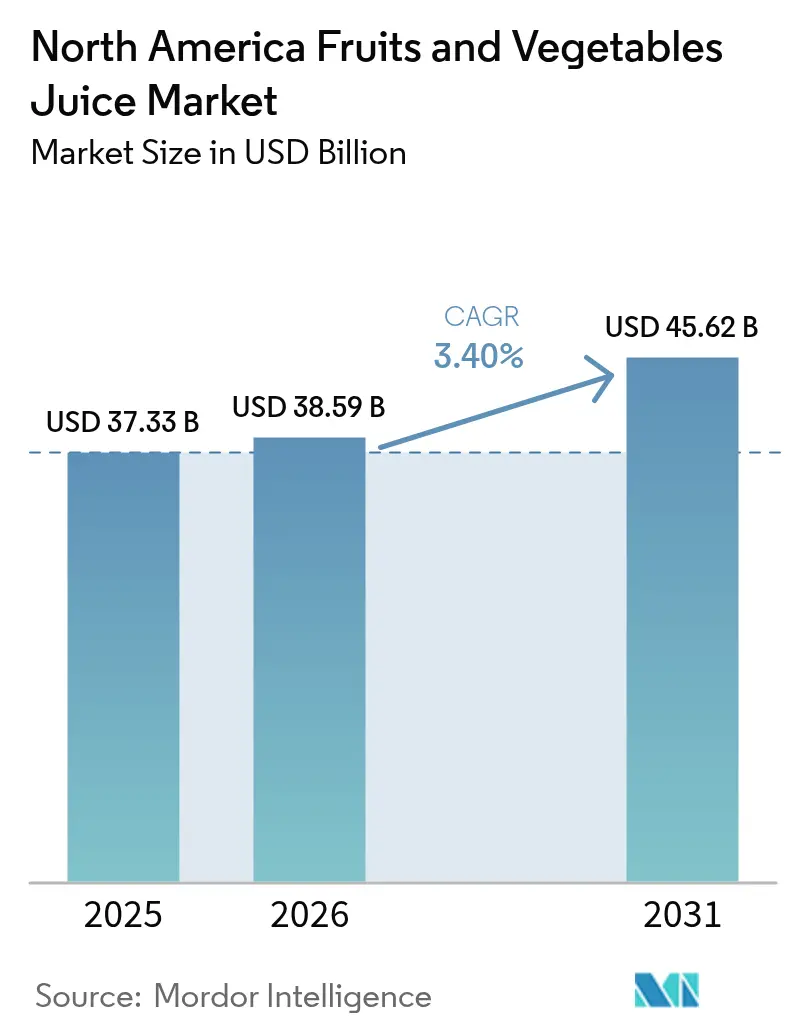
| Base Year Market Size (2025) | USD 37.33 Billion |
| Market Size (2026) | USD 38.59 Billion |
| Market Size (2031) | USD 45.62 Billion |
| Growth Rate (2026 - 2031) | 3.40 % |
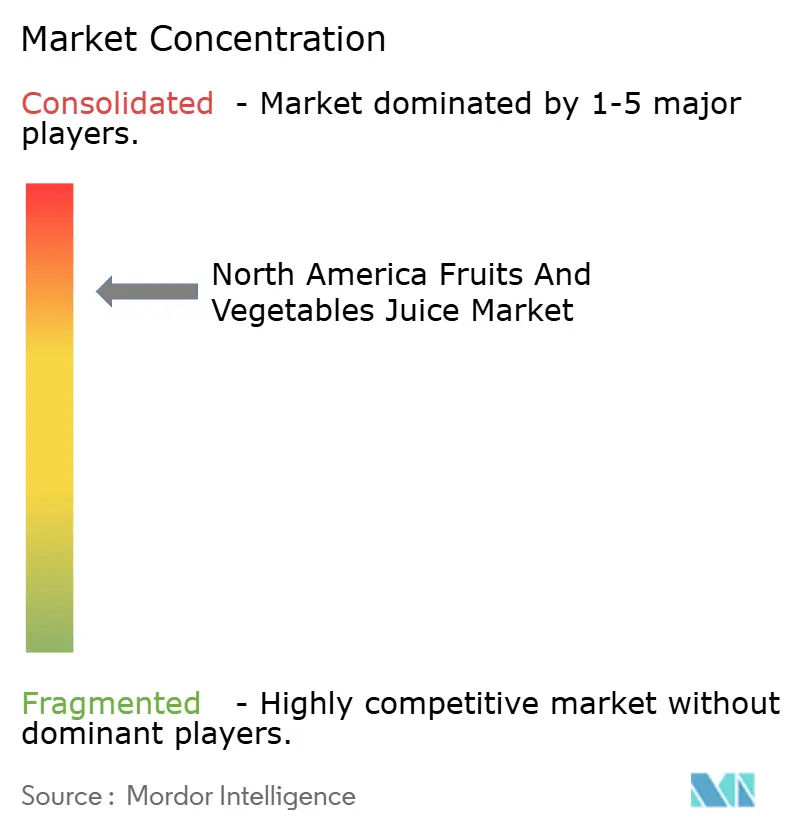
| Market Concentration | High |
Major Players *Disclaimer: Major Players sorted in no particular order Image © Mordor Intelligence. Reuse requires attribution under CC BY 4.0. | |
North America Fruits And Vegetables Juice Market Analysis by Mordor Intelligence
The North America fruits and vegetables juice market size is projected to expand from USD 37.33 billion in 2025 and USD 38.59 billion in 2026 to USD 45.62 billion by 2031, registering a 3.4% CAGR between 2026 and 2031. Retailers are resetting shelf layouts as the December 2024 FDA ruling lets 100% juice carry a “healthy” claim, while the January 2025 front-of-package proposal spotlights added sugars and forces legacy SKUs to streamline recipes. Demand is also tilting toward probiotic-fortified vegetable blends, premium cold-pressed formats, and USDA-certified organic lines that win high-margin space in Whole Foods and Sprouts. Producers are racing to lock in Brazilian citrus contracts after Florida’s greening-driven crop collapse, and investment in high-pressure processing (HPP) is scaling because it delivers “never heated” claims the clean-label cohort now expects. California’s EPR law is another catalyst, lifting recycled-content targets for PET bottles and nudging pouch suppliers toward mono-material laminates that can actually move through curbside streams.
Key Report Takeaways
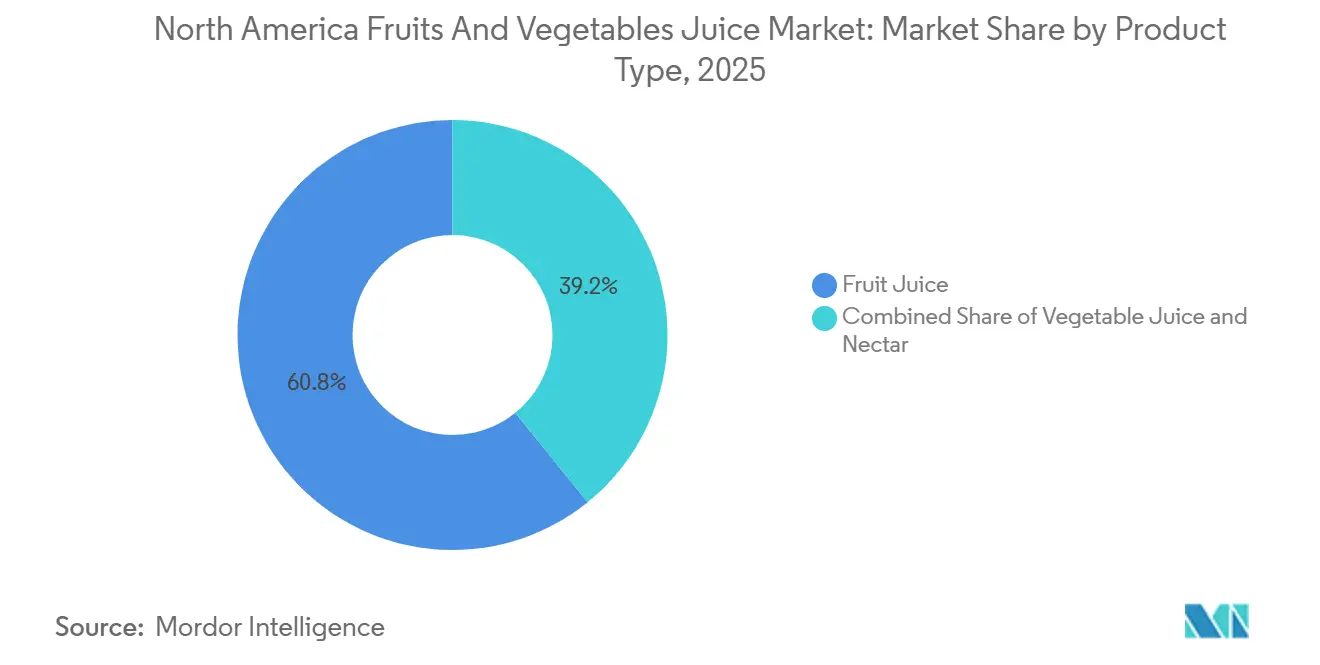
- By product type, fruit juice led with 60.82% of the North America fruits and vegetables juice market share in 2025, while vegetable juice is advancing at a 4.21% CAGR to 2031.
- By category, conventional offerings held 80.61% of the North American fruits and vegetables juice market in 2025, yet organic lines are projected to deliver the fastest growth at a 5.03% CAGR through 2031.
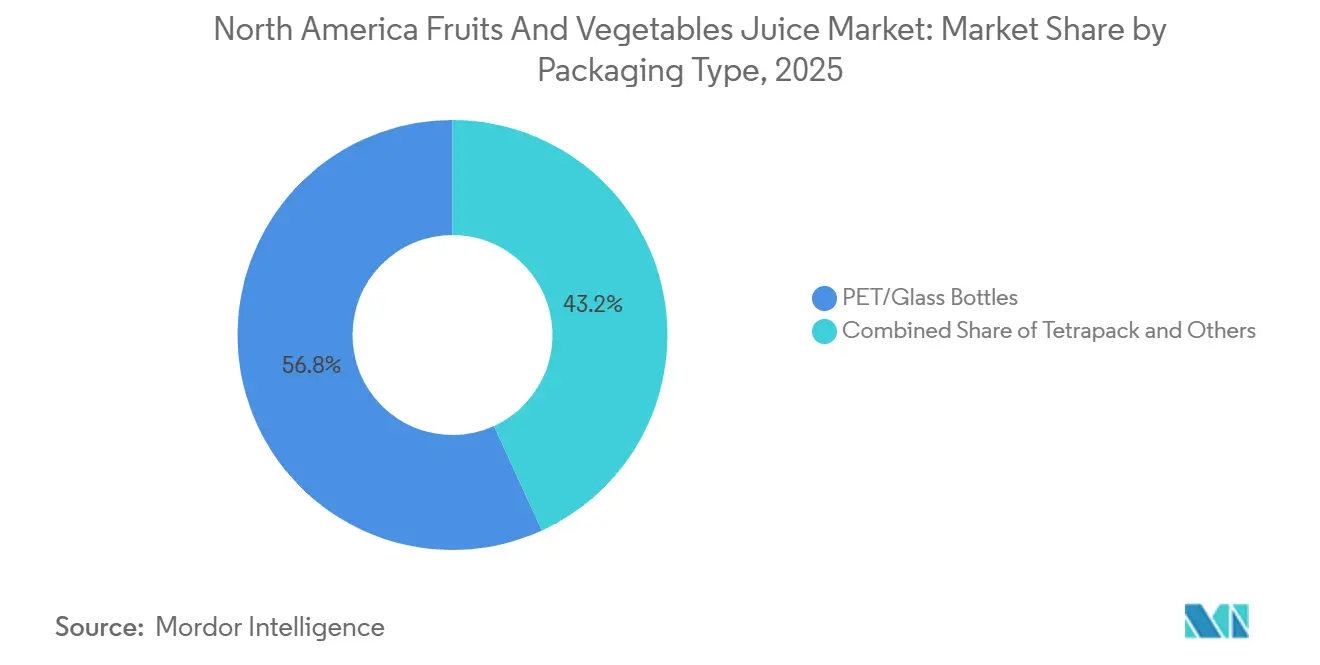
- By packaging, PET and glass bottles captured 56.83% of the North American fruits and vegetables juice market in 2025; pouches are the fastest-growing segment, expanding at a 3.78% CAGR over the same horizon.
- By distribution channel, off-trade dominated with 86.07% share in 2025, whereas on-trade is set to outpace at 4.63% CAGR to 2031.
- Geographically, the United States retained 67.52% of the revenue share in 2025; Mexico is the growth engine, with a 4.87% CAGR expected through 2031.
Note: Market size and forecast figures in this report are generated using Mordor Intelligence’s proprietary estimation framework, updated with the latest available data and insights as of 2026.
Market Trends and Insights
Drivers Impact Analysis of North America Fruits And Vegetables Juice Market*
| Driver | (~)% Impact on CAGR Forecast | Geographic Relevance | Impact Timeline |
|---|---|---|---|
| Growing preference for clean-label and natural beverages | +0.8% | United States, Canada, with spillover to urban Mexico | Medium term (2-4 years) |
| Rising demand for functional and fortified juices | +0.7% | United States, Canada | Medium term (2-4 years) |
| Expansion of premium and cold-pressed juice segments | +0.5% | United States (coastal metros), Canada (Toronto, Vancouver) | Short term (≤ 2 years) |
| Technological advancements improving shelf life and quality | +0.4% | North America-wide, led by U.S. processing hubs | Long term (≥ 4 years) |
| Smart packaging and QR codes enhancing product provenance | +0.3% | United States, early adoption in Canada | Medium term (2-4 years) |
| Growth of convenience-driven consumption formats | +0.6% | United States, Mexico, Canada | Short term (≤ 2 years) |
| Source: Mordor Intelligence | |||
Growing Preference for Clean-Label and Natural Beverages
Consumer demand for ingredient transparency is reshaping formulation strategies across the juice category. The FDA's updated "healthy" claim, finalized in December 2024, permits 100% juice products to carry the designation if they meet limits on saturated fat, sodium, and added sugars, a regulatory shift that incentivizes reformulation away from concentrate-based blends toward not-from-concentrate (NFC) processing. This change directly addresses a long-standing paradox: juices with inherent fructose were previously excluded from "healthy" labeling, even when free of additives. Brands are now repositioning NFC lines to capitalize on the claim, with Tropicana and Simply leading reformulation efforts. The trend extends beyond sugar reduction; preservative-free cold-pressed juices processed via HPP are capturing shelf space in Whole Foods and Sprouts, where clean-label attributes command 15-20% price premiums over conventional pasteurized equivalents. This preference is particularly pronounced among millennials and Gen Z cohorts, who cross-reference ingredient lists via smartphone apps before purchase, effectively turning transparency into a competitive moat.
Rising Demand for Functional and Fortified Juices
Functional fortification is migrating juice from a hydration staple to a wellness delivery vehicle. Brands are embedding probiotics, collagen peptides, and adaptogens such as ashwagandha into vegetable juice blends to target immunity, gut health, and stress management. Campbell's V8 launched a "+Energy" line in 2025 fortified with green tea extract and B vitamins, positioning the product as a morning coffee alternative[1]Source: Campbell Soup Company, “V8 Brand Portfolio and Product Innovations,” CAMPBELLSOUPCOMPANY.COM. This shift is driven by consumer willingness to pay USD 1.50-2.00 more per bottle for functional claims, a margin uplift that offsets rising ingredient costs. Regulatory frameworks under the FDA's Generally Recognized as Safe (GRAS) notification process allow the rapid introduction of novel botanicals, accelerating innovation cycles. However, the trend also introduces complexity: fortified juices must balance taste masking (probiotics can impart sourness) with label appeal, requiring co-investment in flavor encapsulation technologies. The functional segment is expanding fastest in urban U.S. markets where disposable income supports experimentation, but it remains nascent in price-sensitive Mexican retail channels.
Expansion of Premium and Cold-Pressed Juice Segments
Cold-pressed juice, processed via HPP at pressures exceeding 87,000 psi, retains heat-sensitive vitamins and enzymes that thermal pasteurization destroys, creating a sensory and nutritional differentiation that justifies retail prices of USD 8-12 per 16-ounce bottle. Suja Life and Pressed Juicery have expanded distribution beyond natural-channel stores into conventional supermarkets, with Suja reporting a 2024 partnership with Walmart to place cold-pressed SKUs in 1,500 stores. This mainstreaming of premium formats is enabled by HPP equipment manufacturers such as Hiperbaric and Avure Technologies, reducing per-unit processing costs through higher-throughput machines. The segment's growth is also tied to the "juice cleanse" wellness trend, which positions multi-day juice regimens as detoxification protocols. However, cold-pressed products face a structural challenge: shelf life of 30-45 days versus 60-90 days for pasteurized juice, requiring tighter inventory management and higher spoilage risk. Retailers are responding by dedicating refrigerated endcaps to cold-pressed brands, signaling category prioritization despite logistical complexity.
Technological Advancements Improving Shelf Life and Quality
Innovations in aseptic processing and modified atmosphere packaging (MAP) are extending juice shelf life without compromising sensory attributes. Tetra Pak's latest aseptic carton technology, deployed in 2025, uses a thinner aluminum layer that reduces material costs by 8% while maintaining oxygen barrier properties critical for preventing oxidation[2]Source: Tetra Pak, “Aseptic Processing and Packaging Technology Innovations,” TETRAPAK.COM. This advancement matters because oxidation degrades vitamin C and alters flavor profiles, leading to consumer rejection. Simultaneously, pulsed electric field (PEF) processing, a non-thermal technology that applies short, high-voltage pulses to inactivate microbes, is gaining traction among organic juice producers who cannot use preservatives. PEF equipment suppliers such as Elea Technology report a 40% increase in North American installations between 2024 and 2025, driven by demand for "raw" juice that meets food safety standards without heat treatment. These technologies enable brands to claim "never heated" or "cold-processed" on labels, attributes that resonate with clean-label consumers. The capital intensity of PEF and HPP systems, however, creates a barrier to entry for smaller processors, consolidating technological advantage among well-capitalized players.
Restraints Impact Analysis of North America Fruits And Vegetables Juice Market*
| Restraint | (~) % Impact on CAGR Forecast | Geographic Relevance | Impact Timeline |
|---|---|---|---|
| Heightened regulatory and consumer scrutiny on sugar content | -0.6% | United States, Canada | Short term (≤ 2 years) |
| Packaging and sustainability compliance costs | -0.4% | United States (California, leading), Canada | Medium term (2-4 years) |
| Volatility in raw material and agricultural input costs | -0.7% | North America-wide, acute in U.S. orange juice supply | Short term (≤ 2 years) |
| Competition from alternative healthy beverages | -0.5% | United States, Canada | Medium term (2-4 years) |
| Source: Mordor Intelligence | |||
Volatility in Raw Material and Agricultural Input Costs
Citrus supply chains are under acute stress, with orange juice concentrate prices reaching multi-decade highs in 2024-2025. Florida's orange production fell to 15.85 million boxes in the 2024-2025 season, down from 40 million boxes a decade prior, due to citrus greening disease (Huanglongbing) that has no cure and affects 90% of the state's groves, according to the USDA[3]Source: U.S. Department of Agriculture, “Citrus: World Markets and Trade,” USDA.GOV. This domestic shortfall has increased reliance on Brazilian imports, which accounted for 78% of the U.S. orange juice supply in 2024, exposing processors to fluctuations in the Brazilian real and geopolitical risks. FCOJ futures traded at USD 4.20 per pound in early 2025, up 25% year-over-year, directly compressing processor margins, according to the USDA. Apple and grape juice face similar pressures: drought conditions in Washington State reduced apple yields by 12% in 2024, while labor shortages in California's Central Valley delayed grape harvests, increasing spoilage. These input cost shocks are difficult to pass through to retailers, who resist mid-year price increases that disrupt promotional calendars, leaving processors to absorb margin hits or reformulate with lower-cost ingredients such as pear juice, which risks alienating purist consumers.
Packaging and Sustainability Compliance Costs
Extended producer responsibility (EPR) legislation is transferring end-of-life packaging costs from municipalities to beverage companies, fundamentally altering cost structures. California's SB 54, effective January 2025, requires producers to fund recycling infrastructure and achieve 65% recycling rates by 2032, with non-compliance penalties of up to USD 50,000 per day, according to the California Department of Resources Recycling and Recovery[4]Source: California Department of Resources Recycling and Recovery, “Extended Producer Responsibility for Packaging (SB 54),” CALRECYCLE.CA.GOV. Juice brands are responding by investing in recyclable PET bottles with 25-30% post-consumer recycled (PCR) content, but PCR resin trades at a 15-20% premium over virgin PET due to supply constraints. Glass bottles, favored by premium brands for their inert properties and perceived quality, face even steeper challenges: glass is 40% heavier than PET, increasing transportation emissions and costs. Some producers are exploring refillable glass systems, but reverse logistics for bottle collection remain economically unviable outside dense urban markets. The compliance burden disproportionately affects smaller brands, which lack the scale to negotiate favorable PCR contracts or invest in proprietary recycling loops, potentially consolidating the market toward larger players with dedicated sustainability teams.
*Our forecasts treat driver/restraint impacts as directional, not additive. The impact forecasts reflect baseline growth, mix effects, and variable interactions.
North America Fruits And Vegetables Juice Market Segment Analysis
By Product Type:
Vegetable Juices Gain Functional EdgeVegetable juices are expanding at a 4.21% CAGR through 2026-2031, outpacing the overall market as brands fortify carrot, beet, and tomato bases with functional ingredients such as turmeric, ginger, and probiotics. Campbell's V8 brand launched a "+Immunity" line in 2025 featuring elderberry and zinc, targeting cold-and-flu season demand. This functional pivot addresses a long-standing challenge: vegetable juices historically underperformed due to taste barriers, with earthy or bitter notes limiting appeal beyond health purists. Flavor masking technologies, including natural sweeteners such as monk fruit and stevia, are broadening the addressable market. Fruit juices, which held 60.82% market share in 2025, remain dominant due to entrenched breakfast consumption habits and superior taste acceptance, but the segment faces headwinds from sugar-reduction trends and pediatric consumption guidelines that restrict juice intake. Nectar products, blending juice with water and sweeteners, occupy a middle ground, offering lower price points that appeal to cost-conscious Hispanic consumers in the U.S. Southwest and Mexico. However, nectars are vulnerable to clean-label scrutiny, as many formulations include added sugars and preservatives to extend shelf life, attributes increasingly rejected by wellness-focused buyers.
The product type segmentation reflects a broader bifurcation: fruit juices are doubling down on premiumization (cold-pressed, organic, single-origin) to justify higher price points, while vegetable juices are pursuing functional differentiation to escape commodity status. Brands such as Suja and Evolution Fresh are launching "green juice" blends combining kale, spinach, and cucumber with apple or pineapple for palatability, targeting post-workout recovery and detox occasions. These products command USD 8-10 per bottle, versus USD 4-6 for conventional orange juice, demonstrating that vegetable-forward formulations can achieve premium positioning when tied to specific wellness benefits. The challenge lies in scaling beyond niche natural-channel distribution: vegetable juices accounted for only 12-15% of total juice volume in 2025, indicating significant headroom but also the need for sustained consumer education to shift perceptions.



By Category:
Organic Certification Becomes Premium GatewayOrganic juices are growing at 5.03% CAGR through 2026-2031, driven by USDA National Organic Program (NOP) certification becoming a non-negotiable attribute for premium shelf placement in retailers such as Whole Foods, Sprouts, and Trader Joe's. Uncle Matt's Organic, a Florida-based producer, reported 30% revenue growth in 2024-2025, attributing gains to expanded distribution in conventional supermarkets where organic sections now occupy 15-20% of juice shelf space. The organic premium, typically 25-40% over conventional equivalents, is justified by supply-chain traceability, pesticide-free farming, and alignment with environmental values. However, organic juice faces structural constraints: certified organic citrus acreage in the U.S. remains below 5% of total citrus production, limiting domestic supply and necessitating imports from Mexico and Central America, which introduces currency and logistics risks. Conventional juices, holding 80.61% market share in 2025, benefit from scale economies and established supply chains, but the segment is under pressure to adopt "clean-label" attributes, non-GMO, no artificial ingredients, to compete with organic's halo.
The category split also reveals strategic divergence. Large incumbents such as Tropicana and Minute Maid are defending conventional share through reformulation and aggressive promotional spending, while organic specialists such as Lakewood Organic and Natalie's Orchid Island Juice are capturing margin-rich niches with artisanal positioning and direct-to-consumer (DTC) channels. DTC models, enabled by cold-chain logistics providers such as FedEx and UPS, allow organic brands to bypass retailer margin stacking and build direct relationships with consumers, though customer acquisition costs via digital advertising remain elevated. The organic segment's growth trajectory will depend on two factors: continued expansion of certified organic farmland, which requires 3-year transition periods and yield sacrifices, and consumer willingness to absorb price increases as input costs rise.
By Packaging Type:
Pouches Capture On-the-Go OccasionsSingle-serve pouches are expanding at a 3.78% CAGR through 2026-2031, driven by convenience, portability, and portion control attributes that align with busy lifestyles and parental demand for pre-portioned children's beverages. Capri Sun, a Kraft Heinz brand, dominates the pouch segment with over 60% market share, leveraging nostalgic brand equity and distribution scale across schools, daycare centers, and convenience stores. The format's appeal extends beyond children: adult-oriented pouches featuring cold-pressed juice or functional blends are appearing in gyms, airports, and corporate cafeterias, targeting consumers who prioritize grab-and-go formats over sit-down consumption. Pouches also offer sustainability advantages in transportation, lighter weight reduces fuel consumption, but face end-of-life challenges, as multi-layer laminates (aluminum foil, polyethylene, paper) are not recyclable in most municipal systems. Brands are piloting mono-material pouches using only polyethylene, which can enter existing recycling streams, though these alternatives cost 15-25% more and exhibit inferior oxygen barrier properties, potentially shortening shelf life.
PET and glass bottles, holding 56.83% market share in 2025, remain the dominant format due to consumer familiarity, resealability, and compatibility with refrigerated distribution. Glass bottles are preferred by premium brands such as Pressed Juicery and BluePrint, as the material is inert, preserving flavor integrity and conveying quality through weight and transparency. However, glass is 40% heavier than PET, increasing transportation costs and carbon emissions, a trade-off that premium brands justify by emphasizing recyclability and reusability. Tetra Pak cartons, a subset of "others" packaging, are gaining traction in ambient juice (shelf-stable, not refrigerated), with Tetra Pak reporting a 12% increase in North American aseptic carton shipments in 2024-2025. Aseptic cartons enable juice to be stored unrefrigerated for 6-12 months, reducing retailer cold-chain costs and expanding distribution into dollar stores and rural markets with limited refrigeration capacity. The packaging segmentation underscores a format-occasion matrix: pouches for portability, PET for everyday refrigerated consumption, glass for premium gifting, and cartons for pantry stocking.
By Distribution Channel:
E-Commerce Reshapes Off-Trade DynamicsOff-trade channels, encompassing supermarkets, hypermarkets, convenience stores, and online retail, commanded 86.07% market share in 2025, but the composition within off-trade is shifting as e-commerce captures 8-10% of juice sales, up from 3-4% pre-pandemic. Amazon Fresh, Instacart, and Walmart.com enable consumers to purchase cold-pressed and organic juices with same-day or next-day delivery, overcoming the historical barrier of refrigerated product availability in online grocery. This channel shift benefits premium brands that lack scale to negotiate favorable slotting fees in physical retail; DTC models via Shopify-powered websites allow brands such as Suja and Pressed Juicery to capture full retail margins while building first-party customer data for personalized marketing. However, e-commerce introduces last-mile cold-chain complexity: maintaining 34-38°F temperatures during delivery requires insulated packaging and gel packs, adding USD 3-5 per order in fulfillment costs that erode profitability unless order values exceed USD 40-50. Supermarkets and hypermarkets remain the largest off-trade sub-channel, accounting for the majority of juice volume, while retailers such as Kroger and Albertsons, as well as large retail chains such as Walmart, exert significant buyer power, enabling them to negotiate promotional support and private-label partnerships with manufacturers.
Meanwhile, On-trade channels, restaurants, cafes, hotels, are growing at 4.63% CAGR through 2026-2031, supported by the growing presence of juice bars and quick-service restaurants introducing fresh-pressed juices as premium beverage options. Companies like Starbucks have broadened the availability of their cold-pressed juice offerings, positioning them as healthier alternatives within their beverage portfolios. The growth of the on-trade segment reflects broader experiential consumption trends, where consumers are willing to pay premium prices for enhanced ambiance, perceived freshness, and customization opportunities. Add-ins such as functional ingredients and superfoods further reinforce the value proposition, contributing to the increasing appeal of freshly prepared and personalized juice beverages.
Geography Analysis
United States Fruits and Vegetables Juice Market
The United States held 67.52% of North American juice revenue in 2025, anchored by entrenched breakfast consumption rituals, extensive cold-chain infrastructure, and a mature retail landscape spanning 38,000 supermarkets and 150,000 convenience stores. However, the U.S. market is bifurcating: coastal metros (New York, Los Angeles, San Francisco) are driving cold-pressed and organic juice growth, with natural-channel retailers such as Whole Foods and Sprouts reporting 15-20% annual increases in premium juice sales, while Midwest and Southern regions remain dominated by conventional brands such as Tropicana and Minute Maid, where price sensitivity limits organic penetration. The FDA's evolving regulatory posture, particularly the December 2024 "healthy" claim update and January 2025 front-of-package labeling proposal, is accelerating reformulation cycles, with major brands investing USD 50-100 million annually in research and development to reduce sugar content and eliminate artificial ingredients. The U.S. also faces acute raw material challenges: Florida's orange production collapsed to 15.85 million boxes in 2024-2025, forcing processors to import 78% of orange juice from Brazil and Mexico, creating currency exposure and geopolitical risk, according to the USDA. This import dependence is unlikely to reverse, as citrus greening disease has no cure and continues to devastate Florida groves, effectively ending the state's century-long dominance in orange juice production.
Mexico Fruits and Vegetables Juice Market
Mexico is expanding at 4.87% CAGR through 2026-2031, the fastest growth rate in the region, propelled by rising disposable incomes, urbanization, and a young demographic skewed toward convenience-oriented consumption. The country's juice market is less mature than the U.S., with per capita consumption approximately 40% lower, indicating significant headroom for volume growth as middle-class households adopt Western breakfast habits. Mexican consumers favor nectar products, juice blends with added water and sweeteners, due to lower price points, but premium segments are emerging in Mexico City, Monterrey, and Guadalajara, where retailers such as Costco and Walmart are introducing organic and cold-pressed SKUs. Mexico also plays a critical role as a raw material supplier: the country exported 180,000 metric tons of orange juice to the U.S. in 2024, filling gaps left by Florida's production decline, according to the USDA. However, Mexican citrus growers face their own challenges, including water scarcity in key production regions such as Veracruz and labor shortages driven by migration to the U.S., factors that could constrain export volumes and push prices higher.
Canada and Caribbean Markets
Canada represents 12-15% of regional juice revenue, with growth concentrated in Ontario, Quebec, and British Columbia, where urban populations exhibit strong demand for organic and functional juice. The Canadian Food Inspection Agency (CFIA) enforces labeling standards similar to the FDA's, including mandatory bilingual (English/French) packaging and restrictions on health claims, which increases compliance costs for U.S. brands entering the market. Canadian consumers are particularly receptive to cold-pressed juice, with brands such as Greenhouse Juice Co. (Toronto) and The Juice Truck (Vancouver) achieving cult followings through DTC delivery models and partnerships with yoga studios and wellness centers. However, Canada's juice market faces structural headwinds: the country's 2024 Food Price Report forecast fruit prices to rise 1-3% and vegetable prices 3-5% in 2026, driven by climate-related crop disruptions and higher energy costs for greenhouse production, according to the Dalhousie University[5]Source: Dalhousie University, “Canada’s Food Price Report 2024,” DAL.CA. These input cost pressures are compounded by Canada's carbon tax, which adds approximately CAD 0.10 (USD 0.07) per liter to juice production costs through higher natural gas and transportation expenses. Rest of North America, encompassing smaller markets such as the Caribbean and Central America, remains underdeveloped, with limited cold-chain infrastructure and low per capita incomes constraining premium juice adoption.
Regulatory Landscape
In the United States, juice processors operate under FDA food safety and labeling requirements, including Juice HACCP under 21 CFR Part 120 and standards of identity for certain canned fruit juices under 21 CFR Part 146. Label compliance also hinges on percentage juice declaration rules under 21 CFR 101.30, while the December 2024 FDA update to the "healthy" claim has become a near-term catalyst for 100% juice positioning and recipe cleanup across legacy portfolios.
In Canada, the Canadian Food Inspection Agency (CFIA) enforces the Safe Food for Canadians Regulations (SFCR), which require licensing and written preventive control plans for food businesses, and aligns product rules for processed fruit and vegetable products with Health Canada frameworks under the Food and Drug Regulations. At the state level in the United States, packaging sustainability requirements are tightening, with California SB 54 (effective January 2025) shifting end-of-life packaging obligations onto producers and influencing packaging material choices in PET bottles and flexible pouches.
Competitive Landscape
The North American juice market exhibits high concentration, with the top 5 players, Kraft Heinz, PepsiCo, Coca-Cola, Campbell Soup, and Keurig Dr Pepper, leaving substantial room for regional and niche brands to compete on differentiation. Incumbents are pursuing a dual strategy: defending core conventional portfolios through promotional spending and retailer relationships, while acquiring or launching premium sub-brands to capture organic and cold-pressed growth. PepsiCo's 2024 acquisition of a minority stake in Suja Life exemplifies this approach, providing the cold-pressed brand with distribution muscle while allowing PepsiCo to learn from Suja's DTC and natural-channel expertise.
Coca-Cola's Simply brand is reformulating to reduce sugar content and eliminate preservatives, positioning the line as a "better-for-you" alternative to Minute Maid, which remains a volume-driven, price-competitive offering. White-space opportunities are emerging in functional vegetable juices, where no single brand dominates, and in refillable glass bottle systems, which could appeal to zero-waste consumers if reverse logistics can be economically scaled. Smaller disruptors such as Pressed Juicery and Natalie's Orchid Island Juice are leveraging vertical integration, owning orchards or co-packing facilities, to control quality and supply chains, a strategy that insulates them from commodity price volatility but requires significant capital investment.
Technology is becoming a competitive differentiator: brands deploying HPP or PEF processing can claim "never heated" or "raw" attributes, while those integrating QR codes and blockchain traceability can substantiate provenance claims that resonate with transparency-focused consumers. Patent activity in the sector is concentrated in packaging innovations, with Tetra Pak holding multiple patents for aseptic carton designs that extend shelf life without refrigeration, and flexible pouch manufacturers such as Scholle IPN filing patents for mono-material structures that improve recyclability. The competitive landscape is likely to consolidate further, as smaller brands lacking scale to absorb EPR compliance costs or negotiate favorable PCR resin contracts face margin compression, making them attractive acquisition targets for well-capitalized incumbents seeking to bolt on premium portfolios.
North America Fruits And Vegetables Juice Industry Leaders
The Kraft Heinz Company
PepsiCo, Inc.
The Coca-Cola Company
Campbell Soup Company
Keurig Dr Pepper
- *Disclaimer: Major Players sorted in no particular order
North America Fruits And Vegetables Juice Market Companies Covered in this Report
- PepsiCo, Inc.
- The Coca-Cola Company
- Keurig Dr Pepper
- Kraft Heinz Company
- Campbell Soup Company
- Ocean Spray Cranberries, Inc.
- Welch’s
- Florida’s Natural Growers
- Suja Life LLC
- Pressed Juicery, Inc.
- Lakewood Organic
- Natalie’s Orchid Island Juice Co.
- SunOpta Inc.
- BluePrint
- Evolution Fresh
- Old Orchard Brands LLC
- Dole Food Company
- Bolthouse Farms
- Uncle Matt’s Organic
- Reed’s Inc.
Read Analysis of North America Fruits And Vegetables Juice Companies

Market Opportunities and Future Outlook
Regulatory and labeling shifts are creating practical whitespace for reformulated, lower-sugar, and function-forward juice SKUs that can compete for premium shelf placement. The U.S. FDA "healthy" claim update (December 2024) provides 100% juice brands with a clearer on-pack lever, while Canada is moving toward mandatory front-of-package nutrition symbol requirements in 2026 for products high in sugars, sodium, or saturated fat, which is pushing companies to streamline recipes and adjust portfolio structures across the region.
Supply chain resilience and sustainability programs are also translating into concrete innovation and sourcing opportunities, especially where citrus volatility and packaging compliance overlap. Large CPG players cited in this market, including PepsiCo, Coca-Cola, and Campbell, are running regenerative agriculture and traceability programs that link ingredient sourcing to brand claims, and California SB 54 is accelerating interest in recyclable packaging structures and higher post-consumer recycled content. On the capacity side, investments that expand regional manufacturing and co-manufacturing options support faster iteration of cold-processed, organic, and functional formats, with 2026 beverage-manufacturing capability additions in Canada and ingredient production expansions in Mexico that serve North American customers.
Recent Industry Developments in North America Fruits And Vegetables Juice Market
- July 2026: Döhler inaugurated a new production plant in the State of Mexico with an investment exceeding MX$1.2 billion to supply natural food ingredients across North America. The capacity expansion strengthens regional sourcing capability and expands the company footprint in North American ingredients, supporting demand for natural and clean label products across beverage and food brands.
- September 2025: Campbell Soup Company described fiscal 2026 tariff expenses as largely driven by Section 232 duties affecting product costs. The tariff exposure affects packaged beverages and juice portfolios, prompting portfolio rationalization and price strategy adjustments across North American juice offerings.
- May 2025: The Kraft Heinz Company announced evaluation of potential strategic transactions to unlock shareholder value amid six quarters of sales decline. This strategic review could lead to divestitures or acquisitions that reweight juice SKUs and strengthen supply chain leverage in the North American market.


North America Fruits And Vegetables Juice Market Report Scope and Research Methodology
Market Definition and Coverage
For this study, the market covers packaged fruit juice, vegetable juice, and nectar sold across North America, measured on a value basis. The market is counted across common retail and foodservice routes where these products are purchased and consumed.
Scope exclusions: Excludes carbonated soft drinks, bottled water, dairy drinks, energy drinks, and other non-juice beverage categories.
Segments Covered in This Report
- By Product Type
- Fruit Juice
- Vegetable Juice
- Nectar
- By Category
- Conventional
- Organic
- By Packaging Type
- PET/Glass Bottles
- Tetra Pack
- Pouch
- Others
- Distribution Channel
- On-Trade
- Off-Trade
- Supermarkets/Hypermarkets
- Convenience Stores
- Online Retail Retails
- Others
- By Geography
- United States
- Canada
- Mexico
- Rest of North America
Data Sources, Market Sizing, and Validation
Desk Research
Desk research was used to set the starting point for market boundaries, pricing context, and demand patterns in the United States, Canada, and Mexico. We leaned on public sources such as USDA datasets, Statistics Canada tables, the U.S. Census Bureau's trade and manufacturing series, and UN Comtrade to understand production and cross-border movement for relevant juice categories.
To translate those signals into a market model that matches how the industry sells, we reviewed company annual reports and investor decks, trade association releases, and reputable retail and beverage press coverage. Where needed, we referenced paid subscriptions for company financials and intelligence, patent databases, and shipment-level import and export records to cross-check volumes and product mix shifts. The desk sources listed here are illustrative only, and additional public references were also used to collect data, validate assumptions, and clarify open questions.
Primary Interviews and Surveys
Primary work focused on validating category splits (fruit vs vegetable vs nectar), channel exposure (on-trade vs off-trade), and realistic pricing ranges by pack format. We spoke with industry participants across North America, including brand and category teams, packaging and ingredient stakeholders, and distribution-linked roles, so gaps from public data could be addressed and key assumptions were checked more than once.
Distribution of primary research fieldwork respondents
| Company type | Respondent position |
|---|---|
| Top tier: 34% | CXOs: 17% |
| Mid tier: 49% | Functional/Unit leaders: 33% |
| Smaller Players: 17% | Managers: 50% |
Market-Sizing & Forecasting
Sizing starts with a top-down build that reconstructs demand from category consumption signals and then ties them back to trade and production indicators across the United States, Canada, and Mexico. Once the demand pool is formed, we apply splits for fruit juice, vegetable juice, and nectar, then adjust for organic vs conventional, packaging formats, and the on-trade and off-trade route to market.
The model uses a small set of repeatable inputs that can be refreshed each year, such as apparent consumption (production plus imports minus exports), retail channel mix shifts, average price per liter by pack type (PET or glass bottles, carton packs, and others), and the share movement between 100% juice and nectar-style products. To keep totals realistic, results are corroborated with selective bottom-up approximations such as sampled price times volume checks from leading brands, plus channel-based rollups where public data is thin. Where a segment lacks direct visibility, we fill gaps through primary-derived ratios and then recheck the implied totals against the broader category trajectory.
For forecasting, scenario analysis is used to reflect how consumer health preferences, inflation-driven pricing, and channel resets can move value growth differently even when volumes are stable. Those scenarios are anchored to expert expectations gathered in interviews and then reconciled back to the historical pattern so the forward curve stays believable.
Data Validation & Update Cycle
Outputs are validated through triangulation across independent signals, including trade flows, category performance trends, and the implied pricing path by packaging format. If a segment shows a jump that does not match these signals, we revisit the assumptions and, when needed, run follow-up calls to confirm whether a real market shift occurred.
Before sign-off, the full model is reviewed in steps, starting with unit checks and split logic, followed by country-level reconciliation, and then a final consistency review across all segments. Reports are refreshed annually, with interim updates triggered by material events like large pricing moves, regulation-driven labeling shifts, or meaningful channel disruptions. Right before delivery, an analyst performs a final pass so clients receive the latest updated view.
Mordor Intelligence's North America Fruits and Vegetables Juice Market Size Compared With Other Published Estimates
Different published market numbers can vary because the included product set and what counts as juice are not always aligned, and because pricing and channel coverage are treated differently across sources. Even with the same geography, a single added or removed category can push the total up or down quickly.
Juice drinks and powdered juice products are sometimes grouped together with fruit juice in other estimates, but those items sit outside Mordor Intelligence's scope for this market, which is limited to fruit juice, vegetable juice, and nectar across North America. Another common mismatch is how average prices are progressed over time, since some sources assume aggressive premiumization across all packs, while others keep a flatter price curve and do not validate it against packaging shifts.
Benchmark comparison
| Source | Market Size | Gaps in Research Methodology |
|---|---|---|
| Mordor Intelligence | USD 37.33 B (2025) | |
| Trade Journal A | USD 39.60 B (2023) | Uses a broader product grouping that explicitly includes juice drinks, concentrates, and powdered juices, which expands the counted revenue pool beyond juice and nectar. Year basis is also different, so inflation and channel mix shifts are not directly comparable. |
| Industry Publisher B | USD 58.00 B (2024) | Appears to combine adjacent categories such as smoothies, cold-pressed, functional beverages, and concentrates under one headline total, which can overstate the packaged juice-only market. The size is presented without clear reconciliation to trade and consumption checks, making segment add-ups harder to trace. |
The table shows that the widest spreads come from category inclusion and from mixing different base years. When the scope is kept tight to juice and nectar, and when demand signals are checked against trade and implied pricing, the final number becomes easier to reproduce and update year to year.


Key Questions Answered in the Report
What is the current value of the North America fruits and vegetables juice market?
It was valued at USD 38.59 billion in 2026 and is projected to reach USD 45.62 billion by 2031.
How fast is the market expected to grow?
The market is forecast to post a 3.4% CAGR from 2026 to 2031.
Which product segment is growing the quickest?
Vegetable juice, fortified with functional ingredients, is expanding at a 4.21% CAGR through 2031.
Why are pouches becoming more popular?
Pouches satisfy portability and portion-control needs while using up to 70% less packaging material than rigid bottles.
Which country will see the fastest growth?
Mexico is projected to grow at 4.87% CAGR, fueled by rising middle-class purchasing power and supply-chain links to U.S. processors.
How are regulations influencing new product launches?
FDA revisions on “healthy” claims and looming front-of-package sugar warnings are driving reformulation toward lower-sugar, clean-label, and functional blends.
Page last updated on:


 Your data is secure and never sold or shared.


