Market Overview
| Study Period | 2021 - 2031 |
|---|---|
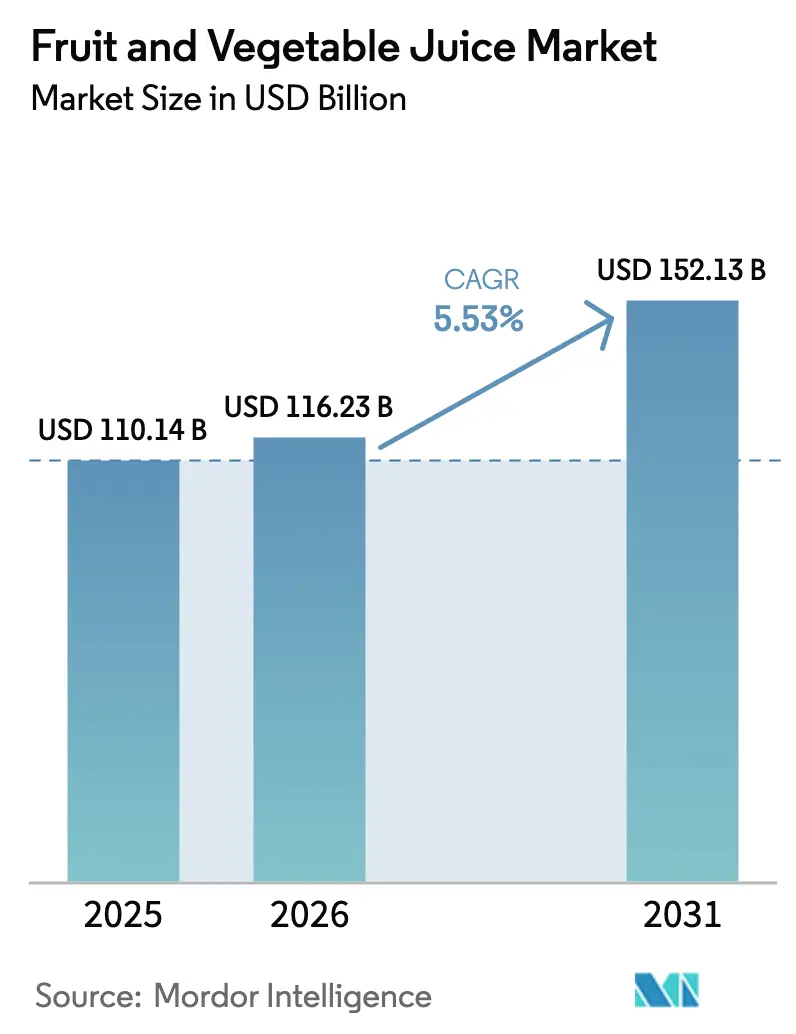
| Market Size (2026) | USD 116.23 Billion |
| Market Size (2031) | USD 152.13 Billion |
| Growth Rate (2026 - 2031) | 5.53% CAGR |
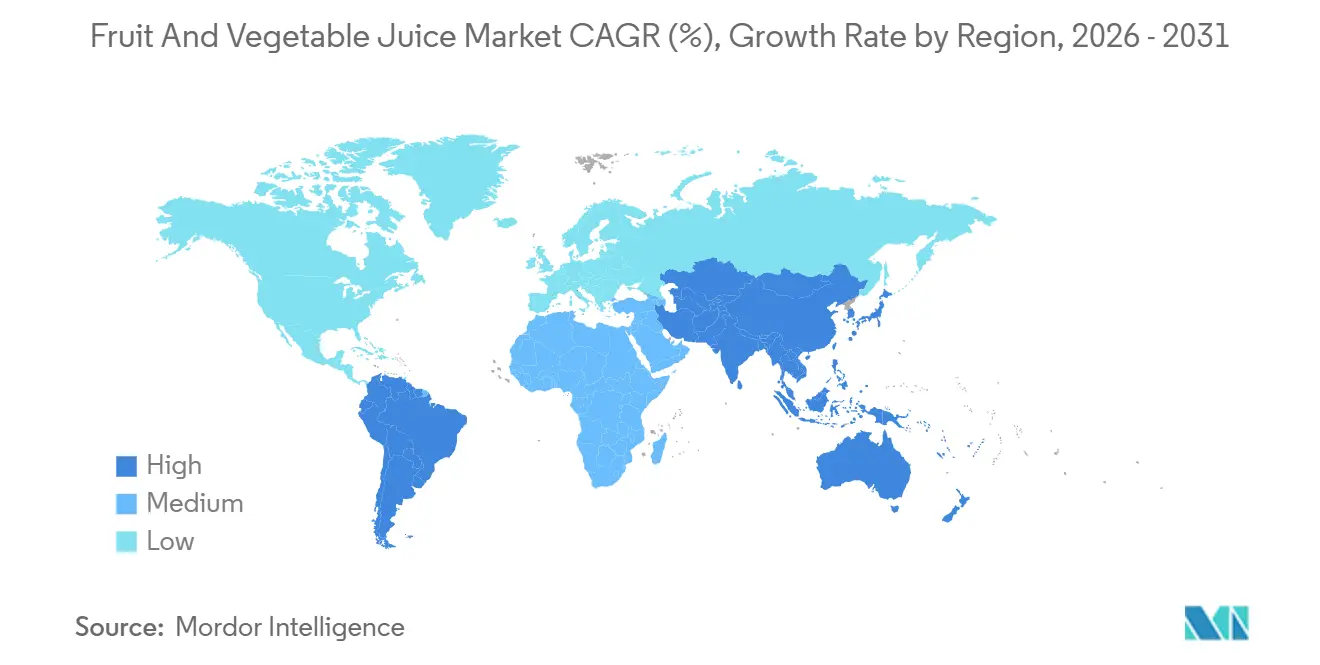
| Fastest Growing Market | South America |
| Largest Market | North America |
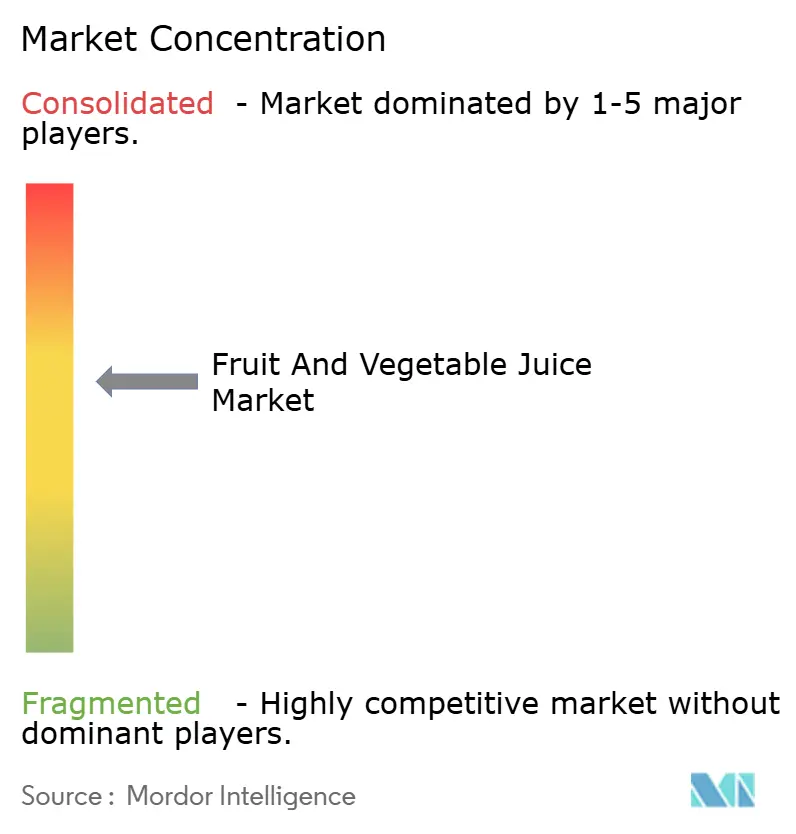
| Market Concentration | Medium |
Major Players
*Disclaimer: Major Players sorted in no particular order Image © Mordor Intelligence. Reuse requires attribution under CC BY 4.0. |
|
Fruit And Vegetable Juice Market Analysis by Mordor Intelligence
The fruit and vegetable juice market size was valued at USD 110.14 billion in 2025 and estimated to grow from USD 116.23 billion in 2026 to reach USD 152.13 billion by 2031, at a CAGR of 5.53% during the forecast period (2026-2031). The category’s momentum pivots on functional blends, vegetable-forward recipes, and cold-pressed formats that offset sliding demand for standalone orange juice. Price-premium line extensions, such as probiotics and vitamin-fortified SKUs, capture share even as sugar-reduction rules reshape formulations. Retailers push sustainable packaging and direct-to-consumer subscriptions to maximize margin, while high-pressure processing extends chilled shelf life, opening national distribution for premium brands. Growth prospects concentrate in South America and online retail, where fortification standards and upgraded cold-chain networks remove historic access barriers.
Key Report Takeaways
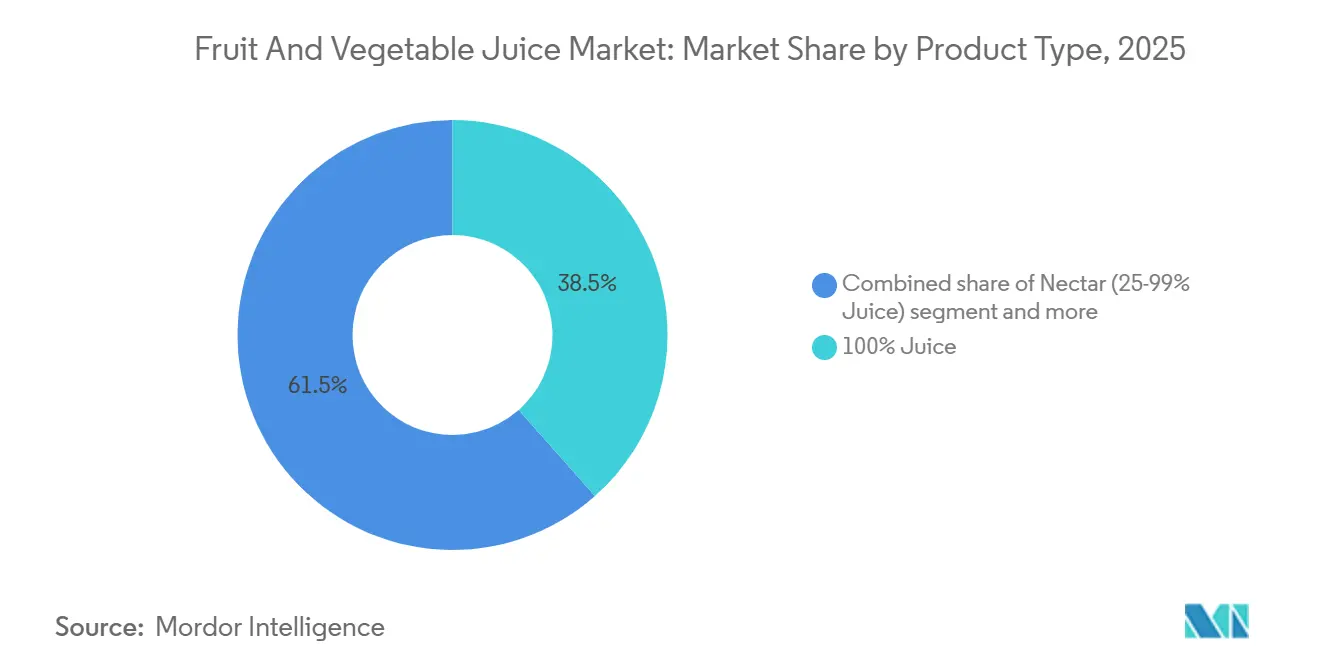
- By product type, 100% juice led with 38.47% revenue share in 2025, whereas nectar is forecast to expand at a 6.02% CAGR to 2031.
- By category, fruit juice held 93.75% revenue share in 2025, while vegetable juice is advancing at an 8.41% CAGR through 2031.
- By nature, conventional variants accounted for 76.63% of revenue in 2025, yet organic formats are growing at a 7.10% CAGR through 2031.
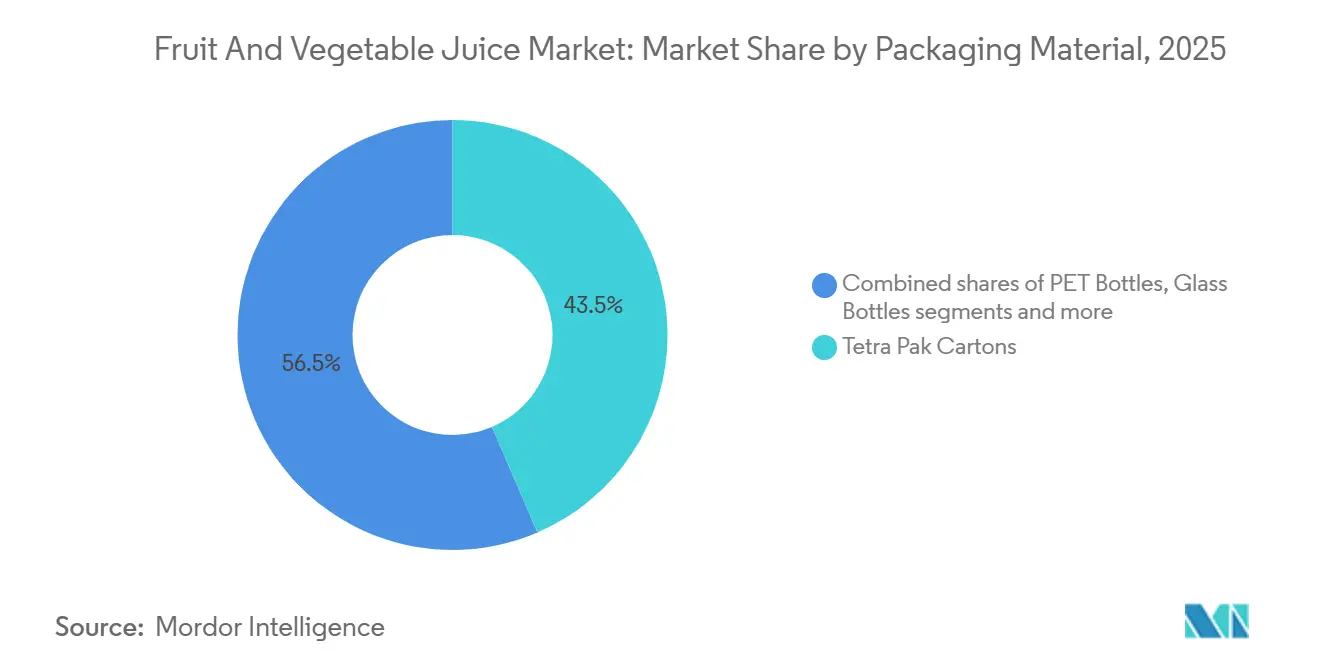
- By packaging material, Tetra Pak cartons controlled 43.54% revenue share in 2025, although PET bottles are recording the highest projected CAGR at 6.18% to 2031.
- By distribution channel, supermarkets and hypermarkets captured 51.78% revenue share in 2025, while online retail is set to grow fastest at a 7.32% CAGR through 2031.
- By geography, North America represented 31.16% revenue share in 2025; South America is predicted to register the strongest regional CAGR at 7.21% to 2031.
Note: Market size and forecast figures in this report are generated using Mordor Intelligence’s proprietary estimation framework, updated with the latest available data and insights as of January 2026.
Global Fruit And Vegetable Juice Market Trends and Insights
Drivers Impact Analysis*
| Driver | (~) % Impact on CAGR Forecast | Geographic Relevance | Impact Timeline |
|---|---|---|---|
| Product innovation and flavor diversification | +1.2% | Global, with premium uptake in North America and Europe | Medium term (2-4 years) |
| Increasing demand for fortified and functional juices | +0.9% | Global, led by North America, Asia-Pacific urban centers | Long term (≥ 4 years) |
| Rising consumer preference for natural juices and clean label offerings | +0.8% | North America, Europe, Australia | Medium term (2-4 years) |
| Demand for convenient, on-the-go juice options | +0.7% | Global, concentrated in urban Asia-Pacific, North America | Short term (≤ 2 years) |
| Growing health awareness among consumers | +0.6% | Global | Long term (≥ 4 years) |
| Expansion of retail and e-commerce channels | +0.5% | Global, fastest in Asia-Pacific, South America | Medium term (2-4 years) |
| Source: Mordor Intelligence | |||


Product innovation and flavor diversification serving as key growth drivers in the juice market
Innovation in product development and flavor diversification is driving growth in the global market, as companies introduce new recipes, formats, and flavor combinations to cater to both health-conscious and indulgence-seeking consumers. Manufacturers are enhancing offerings with features such as reduced sugar, added fiber, and plant-based hydration, transforming traditional juices into functional products that support premium pricing and encourage repeat purchases. Flavor profiles are evolving beyond conventional options like orange and apple to include dessert-inspired, botanical, and vegetable-forward varieties. Examples include Ocean Spray’s limited-edition Strawberry Shortcake juice and V8’s Beet Ginger Lemon, which address the demand for more complex taste experiences. These advancements align with cleaner labels and natural positioning, as seen in brands like Naked and Tropicana expanding health-focused lines, while cold-pressed companies such as Suja Juice and Raw Pressery offer preservative-free options that maintain fresh taste. Diversified flavor architectures also target specific usage occasions, from family-oriented products like Mott’s Sensibles with fruit–vegetable blends for children to adult-focused functional hydration concepts such as V8+Hydrate, which incorporates sweet potato juice. Global brands are localizing innovation pipelines with regionally relevant variants, such as Tropicana’s Special Start range featuring pressed blood orange and pink grapefruit in Europe, and Asia-Pacific blends tailored to local preferences, enhancing market penetration in high-growth regions. Cold-pressed and organic lines from brands like En Route and Evolution Fresh further highlight how innovative processing and unique combinations deliver freshness and wellness benefits, sustaining consumer interest and supporting premiumization in the global market.
Increasing demand for fortified and functional juices driving market expansion
The increasing consumer preference for fortified and functional beverages is driving growth in the global market. This trend reflects a shift towards products that provide targeted health benefits beyond basic hydration, aligning with wellness-focused lifestyles. Fortification with vitamins, minerals, probiotics, or antioxidants transforms traditional juices into functional offerings, catering to demands for immunity, energy, or digestive support while preserving natural flavor profiles. A 2023 survey by the Korea Rural Economic Institute revealed that 8.1% of adults preferred 100% fruit juice, while 5.4% opted for health functional drinks, underscoring the growing appeal of functional enhancements within broader health trends[1]Source: Korea Rural Economic Institute (KREI), "2023 Food Consumption Behavior Survey Basic Analysis Report," library.krei.re.kr . Companies are capitalizing on this demand through innovative product development. For instance, V8 enhances vegetable-based juices with added fiber and low-sugar formulations, positioning them as daily digestive aids that complement fruit-based nutrition. POM Wonderful integrates pomegranate antioxidants into its juices, emphasizing heart health benefits and premium positioning through clinical claims. Similarly, Lakewood Organic Juices enriches its organic product lines with additional vitamins derived from pure fruits and vegetables, avoiding synthetic additives to meet clean-label preferences. These strategies, centered on fortification, functionality, and brand-specific innovations, expand product accessibility, encourage trial among health-conscious consumers, and support sustained market growth globally.
Rising consumer preference for natural juices and clean label offerings
The increasing consumer focus on natural ingredients and clean label products is reshaping purchasing behaviors across the beverage industry. Shoppers are prioritizing products free from artificial additives, preservatives, and added sugars, reflecting a broader demand for transparency and minimally processed options. This shift underscores the importance of recognizable ingredients and honest labeling in building trust and loyalty. According to the National Science Foundation, in 2024, 83% of American consumers read food labels before making purchase decisions, with 64% paying more attention to labels compared to five years ago. Among these consumers, 79% prioritize the ingredients list, 78% focus on health claims, and 77% check allergen warnings, driving demand for clean-label beverages that meet these expectations[2]Source: National Science Foundation (NSF), "NSF Research Shows Americans Demand Greater Clarity and Standardization in Food Labeling," nsf.org. Brands like Innocent and Pressed Juices are capitalizing on this trend. Innocent offers smoothies and juices made entirely from whole fruits and vegetables, avoiding concentrates or additives, and transparently listing all ingredients to appeal to label-conscious consumers. Pressed Juices employs high-pressure processing to preserve natural nutrients without heat or chemicals, providing vegetable-heavy blends that emphasize simplicity and health benefits. Innocent further addresses allergen-conscious preferences by excluding common irritants, while Pressed highlights ingredient prioritization with bold, concise packaging. These strategies, combining natural purity, transparency, and consumer vigilance, align with NSF findings and drive consumer trials, premium pricing, and market growth, ultimately restoring trust in beverages globally.
Demand for convenient, on-the-go juice options driven by busy consumer lifestyles
Convenience and portability are key factors driving growth in the global beverage market, as consumers with busy lifestyles increasingly prioritize grab-and-go options that deliver nutrition without compromising on time or ease. Portable packaging formats such as single-serve bottles, pouches, and tetra packs are gaining traction, seamlessly fitting into daily routines like commutes, workouts, or office breaks. These innovations have elevated juices from home-prepared staples to essential, on-the-go products. Brands are responding to this demand with tailored solutions. For instance, Simply Juice offers slim, resealable bottles of blended fruit and vegetable mixes designed to fit into gym bags or lunch totes, catering to professionals seeking hydration during their busy schedules. Jamba Juice complements this trend with ready-to-drink smoothies in cups with attached lids, combining tropical fruit flavors with vegetable blends to provide sustained energy for active consumers. These products leverage aseptic filling techniques to ensure freshness and quality while meeting the demands of fast-paced lifestyles. Caprisun further enhances accessibility with juice pouches featuring easy-sip spouts, making fruit-heavy options suitable for both children and adults during school runs or travel. Functional features like no-drip designs and portion control encourage repeat purchases, addressing the needs of fragmented daily schedules. Collectively, these advancements are broadening consumption occasions, reinforcing juice as a lifestyle product, and driving global market expansion.
Restraints Impact Analysis*
| Restraint | (~) % Impact on CAGR Forecast | Geographic Relevance | Impact Timeline |
|---|---|---|---|
| High sugar content in juice products poses a challenge | -0.6% | Global, acute in Europe and North America | Short term (≤ 2 years) |
| Growing demand for low or no-sugar ready-to-drink beverages | -0.4% | North America, Europe, urban Asia-Pacific | Medium term (2-4 years) |
| Increasing concerns regarding preservatives and additives | -0.3% | North America, Europe | Short term (≤ 2 years) |
| Shift in consumer preference toward whole fruits and vegetables | -0.3% | Global, led by health-conscious segments | Long term (≥ 4 years) |
| Source: Mordor Intelligence | |||
High sugar content in juice products poses a challenge to market growth
The high sugar content in juice products poses a significant challenge for market growth as regulators and health-conscious consumers increasingly associate sugary beverages with obesity, diabetes, and poor dietary quality. This issue is particularly pronounced in ambient and chilled juice products, such as juice drinks and cocktails, which often contain added sugars or concentrates that elevate total sugar levels beyond the perceived “natural” fruit content, undermining their health appeal. The U.S. FDA’s updated Nutrition Facts label has intensified scrutiny by mandating a distinct “Added Sugars” line, directly highlighting sugars from concentrated fruit and vegetable juices as contributors to overconsumption[3]Source: Food and Drug Administration (FDA), "What’s on the Nutrition Facts Label," fda.gov . Excessive added sugars make it difficult for consumers to stay within calorie limits while meeting nutrient needs, prompting many to use labels to limit sugar intake. Consequently, high-sugar juices are increasingly relegated to occasional treats, particularly when compared to water, unsweetened teas, or low-sugar functional beverages. Brands like Minute Maid have responded by reformulating products and introducing no-added-sugar or reduced-sugar variants to address volume loss and reputational risks. Similarly, Capri-Sun has launched reduced-sugar and no-added-sugar options in several markets, clearly communicating sugar reductions on packaging to reassure label-conscious buyers. These developments reflect how regulatory pressures and evolving dietary guidelines are driving producers to balance consumer expectations for sweetness with the demand for lower-sugar alternatives, constraining demand for traditional high-sugar juices and challenging overall market growth.
Increasing concerns regarding the use of preservatives and additives in juices
Consumer concerns about the use of preservatives and additives in beverages are increasingly impacting the global fruit and vegetable juice market. Health-conscious buyers are questioning the safety, naturalness, and long-term effects of chemically stabilized products, leading to a preference for minimally processed alternatives with shorter ingredient lists and "kitchen-like" formulations. Shelf-stable juices containing artificial preservatives, colorants, and flavor enhancers are often viewed as less wholesome compared to fresh or not-from-concentrate options. The clean label trend amplifies this shift, with claims such as "no additives/preservatives" and "all natural" emerging as key purchase drivers. Conventional juice brands relying on additives for extended shelf life face challenges to their market position and are compelled to invest in reformulation, aseptic processing, or cold-chain logistics to remain competitive. For instance, Rugani Juice in South Africa produces 100% fruit-and-vegetable juices without additives or preservatives, employing rapid extraction and aseptic packaging to ensure both safety and clean labeling. Similarly, clean-label brands like Lakewood Organic Juice highlight attributes such as "no preservatives," alongside organic, vegan, allergen-free, and non-GMO certifications, addressing consumer concerns while supporting premium pricing. These examples underscore how brands that eliminate artificial additives and effectively communicate these efforts can gain market share from traditional products perceived as overly processed. The growing distrust of preservatives and additives is driving the industry toward cleaner processing technologies and transparent labeling to sustain growth.
*Our forecasts treat driver/restraint impacts as directional, not additive. The impact forecasts reflect baseline growth, mix effects, and variable interactions.
Segment Analysis
By Product Type: Nectar Gains Ground Through Affordability Positioning
100% juice is expected to retain a dominant 38.47% market share in 2025, supported by premiumization strategies that emphasize superior purity and targeted innovations. Cold-pressed 100% juice exemplifies this trend, utilizing high-pressure processing instead of thermal pasteurization to preserve enzymes. This process enables brands to command prices of USD 8-12 per liter, compared to USD 3-5 for conventional juice, appealing to health-conscious consumers who prioritize nutrient integrity over cost. Brands like BluePrint capitalize on this trend by offering cold-pressed green juice lines featuring ingredients such as kale, apple, and romaine, emphasizing freshness and justifying premium pricing for wellness-focused buyers. FDA labeling regulations further reinforce the positioning of 100% juice by requiring clear percentage declarations, which prevent misleading health claims and build consumer trust. This regulatory framework supports the premium segment even as Nectar continues to grow by addressing affordability gaps.
Nectar is strengthening its position in the global market by focusing on affordability, with products containing 25-99% juice content achieving the highest growth rate among product types, at a CAGR of 6.02% through 2031. This growth outpaces juice drinks with less than 25% juice content, which face challenges such as classification by the WHO as sugar-sweetened beverages and taxation in markets like Mexico, Chile, and South Africa. Cost efficiency is a significant factor in Nectar's appeal, as the use of water and sweeteners reduces raw fruit input by 30-50%, enabling retail prices that are 20-30% lower than 100% juice. Concentrate technology ensures flavor intensity is maintained, making these products accessible to a broader audience. Brands like Sunberry Farms are leveraging this cost structure by introducing tropical nectar blends, such as guava-mango, at competitive price points, effectively targeting price-sensitive emerging markets without compromising taste. Additionally, nectar benefits from a regulatory advantage, as reducing juice content to 50-75% allows brands to avoid "high sugar" labels under front-of-pack warning systems, maintaining consumer appeal despite increasing health scrutiny.


By Category: Vegetable Juice Surges on Functional Positioning
Vegetable juice is gaining traction in the beverage industry, driven by its functional positioning and alignment with health-conscious consumer preferences. With a projected CAGR of 8.41% through 2031, vegetable juice is emerging as a strong growth segment despite fruit juice's anticipated 93.75% market share in 2025. Lower sugar content in options like carrot, beet, and celery juices, offering 40-60% less sugar than orange juice, coupled with nitrates linked to cardiovascular benefits, positions vegetable juice as a healthier alternative. This trend reflects broader sugar-reduction initiatives, enabling vegetable juices to meet health guidelines without requiring added sweeteners or reformulation. For instance, Campbell Soup's V8 brand has introduced turmeric and ginger variants, appealing to consumers seeking anti-inflammatory benefits while avoiding regulatory scrutiny. Hybrid blends, such as apple-carrot or pineapple-beet, further ease the transition for consumers by combining vegetable nutrients with fruit sweetness.
Fruit juice continues to dominate the market due to its established flavor appeal and widespread availability, but the rapid growth of vegetable juice signals a shift toward functional benefits over traditional taste preferences. In regions with aggressive sugar-reduction policies, vegetable juices are gaining momentum, supported by brands like Biotta, which offer pure vegetable options such as celery-plus or beet blends that emphasize nitrate-rich functionality. Hybrid products also address sugar concerns by integrating vegetable nutrition into familiar fruit profiles. This dynamic highlights how vegetable juice is challenging fruit juice's entrenched position, fostering market evolution through nutrient-dense, low-sugar innovations that expand consumption occasions and cater to health-focused consumers.
By Nature: Organic Certification Unlocks Premium Channels
Conventional juice is expected to maintain a dominant 76.63% market share in 2025, and the USDA National Organic Program certifications and retailer private-label initiatives are drawing health-conscious consumers willing to pay 30-50% price premiums for verified purity. While organic certification is creating premium opportunities in the beverage industry, the organic segment of the global fruit and vegetable juice market is projected to grow at a compound annual growth rate (CAGR) of 7.10% through 2031. Organic acreage for juice-grade oranges, apples, and carrots increased by 12% in 2024, primarily in California and Florida. This expansion allows processors to secure long-term contracts with growers, ensuring a stable supply to meet rising demand from upscale retail and e-commerce channels. Brands such as Uncle Matt's Organic are leveraging USDA-certified Florida-sourced orange juices to deliver consistent quality, supporting their positioning in premium shelf space within natural food channels. However, growth in the organic segment remains constrained by limited certified land and higher production costs, even as it fosters a shift toward authenticity-driven consumer loyalty.
Conventional juice continues to benefit from economies of scale and established distribution networks, maintaining its leadership despite the faster growth of the organic segment. Clean-label demands are prompting conventional producers to reformulate without incurring the costs of full organic certification. For example, Tetra Pak's 2025 introduction of plant-based carton materials made from sugarcane polymers enables conventional brands to claim carbon-neutral packaging, enhancing sustainability credentials cost-effectively. Additionally, brands like Nature's Nectar are adopting high-pressure processing (HPP) and removing artificial preservatives to mimic the freshness and purity cues associated with organic products. This strategic approach, combining the scale advantages of conventional production with clean-label adaptations, helps sustain conventional juice's market dominance while broadening access to ethical attributes across price tiers.
By Packaging Material: PET Bottles Gain on Sustainability Narratives
PET bottles are increasingly favored by brands due to their alignment with sustainability goals and portability advantages, growing at a CAGR of 6.18% through 2031. Despite Tetra Pak cartons projected to hold a 43.54% market share in 2025, PET bottles are gaining adoption as recycling infrastructure improves and retailer mandates for post-consumer content become more stringent. Companies such as POM Wonderful and Naked Juice have transitioned to 100% recycled PET, securing shelf space in major retailers. This strategic material choice supports eco-conscious procurement practices while maintaining the lightweight convenience of PET bottles. Additionally, the resealability of PET bottles addresses consumer demand for on-the-go functionality, offering a practical alternative to aseptic cartons that lack this feature. This combination of sustainability and convenience positions PET bottles as a competitive option for both environmentally conscious consumers and those seeking practical packaging solutions.
Tetra Pak continues to lead in shelf-stable formats, which are critical for e-commerce and export markets. Its aseptic processing technology enables ambient distribution, reducing logistics costs by 25-30% compared to cold-pressed alternatives requiring refrigeration. Pouches complement Tetra Pak's offerings by gaining traction in single-serve children's segments, with spill-proof designs like Capri Sun's school-targeted lines expanding family consumption occasions. While glass bottles and cans remain limited to niche premium segments due to weight and breakage concerns, Tetra Pak's scale advantages, including stability, sustainability innovations, and format versatility, continue to drive growth across the category.
By Distribution Channel: Online Retail Disrupts Traditional Grocery
Online retail is transforming traditional grocery distribution channels, driven by a projected 7.32% compound annual growth rate (CAGR) through 2031. Supermarkets and hypermarkets are expected to retain a dominant 51.78% market share in 2025, supported by direct-to-consumer subscription models and advancements in cold-chain logistics. These developments enable nationwide delivery of perishable products, overcoming regional limitations tied to short shelf lives of 7-14 days. For example, Amazon's 2024 partnership with refrigerated logistics providers facilitates the distribution of cold-pressed juices beyond local markets, expanding access to premium offerings. Despite the opportunities, online penetration faces challenges due to cold-chain logistics costs, which increase fulfillment expenses by 25-30% compared to ambient goods. Subscription models help offset these costs by ensuring repeat purchases, with brands like Suja leveraging these advancements to deliver fresh juices nationwide, positioning e-commerce as a growth driver for high-margin, short-shelf-life products.
Supermarkets are responding to the rise of online retail by adopting omnichannel strategies, such as click-and-collect services, which reduce last-mile delivery costs while preserving in-store impulse purchases. Convenience and grocery stores continue to capture spontaneous buys, even as consumer preferences shift. The online pivot particularly benefits premium brands, as cold-pressed juices priced at USD 8-12 per liter can better absorb delivery surcharges compared to conventional juices priced at USD 3-5 per liter. Brands like Daily Harvest integrate subscription models with grocery partnerships, offering hybrid access that fosters customer loyalty while mitigating the impact of declining traditional retail sales. This combination of traditional scale and digital adaptation supports supermarket dominance and drives channel evolution by prioritizing convenience across both physical and online platforms.
Geography Analysis
North America maintained a leading position with a 31.16% share in 2025, driven by stringent FDA Juice HACCP regulations. These regulations, requiring a 5-log pathogen reduction for unpasteurized products, have significantly enhanced the quality standards for cold-pressed juices. This has bolstered consumer confidence in premium, minimally processed offerings. The safety protocols enable brands to market high-pressure processed juices as both safe and nutrient-rich, aligning with the growing demand for health-focused products. Companies like Suja Juice have leveraged these regulations to produce enzyme-retaining green blends, distributed nationwide, turning compliance into a competitive advantage for refrigerated distribution. The region's robust infrastructure and focus on innovation have positioned it as a benchmark for quality-driven growth, influencing global standards.
South America is projected to achieve the highest regional CAGR of 7.21% through 2031, supported by urbanization in cities such as São Paulo and Buenos Aires. The expansion of cold-chain infrastructure in these areas has facilitated the distribution of cold-pressed juices, unlocking the potential of the premium segment. Argentina's agricultural output of apples and grapes has established it as a key nectar export hub, with processors like Citrosuco offering cost-efficient blends that balance affordability and fruit content for mass-market appeal. Chile and Peru contribute through counter-seasonal citrus production, supplying North American markets during winter. Meanwhile, Colombia's rising middle class is driving demand for premium juices, though regulatory fragmentation across the region complicates unified product launches and limits scalability.
Europe's market growth has slowed due to EFSA sugar-labeling mandates, which challenge fruit-heavy product profiles. Germany and the United Kingdom lead in organic juice penetration through private-label programs emphasizing clean-label attributes to meet transparency demands. In the United Kingdom, Britvic's Robinsons brand exemplifies dominance with squash concentrates that align with portion-control trends by reducing sugar per serving. France and Spain maintain high orange juice consumption but face competition from sparkling water brands positioned as lower-calorie alternatives. Meanwhile, Asia-Pacific sees growth driven by India's labeling regulations and China's e-commerce expansion, while the Middle East and Africa markets remain nascent with infrastructure challenges.

Competitive Landscape
The global fruit and vegetable juice market exhibits moderate consolidation, with major players such as PepsiCo, Coca-Cola, and Keurig Dr Pepper managing extensive multi-brand portfolios. These portfolios encompass 100% juice, nectar, and functional product lines, enabling efficient distribution and innovation across various price segments. Leveraging their scale, these companies introduce hybrid vegetable-fruit blends and probiotic-fortified SKUs to address functional health gaps while ensuring accessibility through established retail networks. For example, Tropicana Pure Premium has expanded into low-acid blends with vegetable infusions, securing premium shelf space and reinforcing its leadership in the fruit juice category.
Regional cooperatives such as Ocean Spray and Florida's Natural maintain their competitive edge through vertical integration into cranberry and citrus farming. This approach allows them to capture supply-chain margins that multinational brands often relinquish to independent growers. By ensuring fresher sourcing and authentic flavor profiles, these cooperatives stabilize costs amidst volatile raw material prices. This enables them to compete on quality rather than volume in both mainstream and premium segments. Ocean Spray's cranberry blends, featuring apple or pomegranate, exemplify this strategy by leveraging farm-to-bottle traceability to appeal to consumers seeking clean-label products.
Smaller companies are disrupting the market by adopting direct-to-consumer (DTC) models, bypassing traditional retailer margins. These businesses focus on niche innovations, such as vegetable-fruit hybrids and probiotic fortifications, to attract loyal customer bases. By targeting underserved functional niches, they offer competitive pricing and high customization through e-commerce subscriptions. Brands like Pressed illustrate this approach with daily green juice deliveries featuring ginger-turmeric boosts, turning DTC agility into a scalable challenge to the dominance of larger, established players.
Fruit And Vegetable Juice Industry Leaders
-
The Coca-Cola Company
-
PepsiCo, Inc.
-
Tropicana Brands Group
-
Keurig Dr Pepper Inc.
-
Eckes-Granini Group
- *Disclaimer: Major Players sorted in no particular order

Recent Industry Developments
- November 2025: Radnor Hills introduced Radnor Hydrate, a 250ml beverage consisting of 60% tropical juice and 40% natural spring water. It was marketed as a straightforward and clean choice for healthy hydration. The product range included three flavors: Summer Berries, Apple & Raspberry, and Tropical. It was made available in packs of 24, with a recommended selling price (RSP) of 75p per drink for the foodservice segment.
- August 2025: Tropicana launched Tropicana Essentials in the United States, an orange juice blend developed to address the nutritional needs of families during the back-to-school season while remaining cost-effective. Tropicana Essentials combined the familiar taste of fresh orange juice with apple and pear juices, offering a flavorful option without added sugars. It was available in three variants: Orange Blend (no pulp), Orange Blend (some pulp), and Orange Mango Blend (no pulp).
- August 2024: US-based beverage producer Welch Foods launched a zero-sugar juice line this fall, targeting health-conscious consumers while retaining flavor. The range included two refrigerated flavors, Passion Fruit and Grape, in 59oz cartons, and three shelf-stable options: Tropical Punch, Strawberry, and Concord Grape, available in 64oz multi-serve and 10oz single-serve sizes.
- March 2024: Tropicana launched two new products in the ambient category. The offerings, Tropicana Rise & Shine and Tropicana Fruit Sensation, became available in Tesco stores across the UK. Tropicana Rise & Shine was introduced in Smooth Orange and Pressed Apple variants. The Tropicana Fruit Sensation range featured flavors such as Apple, Cucumber & Lemon with a hint of elderflower; Orange & Mango with notes of yuzu; and Peach & Raspberry with a hint of vanilla.


Research Methodology Framework and Report Scope
Market Definitions and Key Coverage
Our study defines the fruit and vegetable juice market as the retail-packaged liquids obtained by pressing, squeezing, or blending edible fruits and vegetables, sold either as 100 % juice, nectar (25 - 99 % juice), or juice drinks (<25 % juice) in ambient, chilled, or frozen form for direct human consumption.
Scope exclusions include products positioned chiefly as concentrates for industrial use, powdered mixes, and fermented or carbonated juice beverages that sit outside our remit.
Segmentation Overview
-
By Product Type
- 100% Juice
- Nectar (25-99% Juice)
- Juice Drinks (Below 25% Juice)
-
By Category
- Fruit Juice
- Vegetable Juice
-
By Nature
- Conventional
- Organic
-
By Packaging Material
- Tetra Pak Cartons
- PET Bottles
- Glass Bottles
- Cans
- Pouches and Others
-
By Distribution Channel
- Supermarkets/Hypermarkets
- Convenience/Grocery Stores
- Online Retail Stores
- Others
-
By Geography
-
North America
- United States
- Canada
- Mexico
- Rest of North America
-
Europe
- Germany
- United Kingdom
- Italy
- France
- Spain
- Netherlands
- Poland
- Belgium
- Sweden
- Rest of Europe
-
Asia-Pacific
- China
- India
- Japan
- Australia
- Indonesia
- South Korea
- Thailand
- Singapore
- Rest of Asia-Pacific
-
South America
- Brazil
- Argentina
- Colombia
- Chile
- Peru
- Rest of South America
-
Middle East and Africa
- South Africa
- Saudi Arabia
- United Arab Emirates
- Nigeria
- Egypt
- Morocco
- Turkey
- Rest of Middle East and Africa
-
North America
Detailed Research Methodology and Data Validation
Primary Research
Mordor analysts interviewed juice extractors, cold-pressed bottlers, tetra-pak converters, and nationwide grocery buyers across North America, Europe, Asia-Pacific, and Latin America. These discussions tested preliminary demand pools, verified average selling prices, and clarified trade-channel mix assumptions that secondary data alone could not resolve.
Desk Research
We started with publicly available datasets such as FAO crop balances, UN Comtrade customs codes for HS-2009, USDA ERS retail scanner data, and Eurostat household expenditure panels, which anchor harvested volumes, trade flows, and price corridors. Trade association briefs (IFU, AIJN, Juice Products Association) and peer-reviewed nutrition journals help us frame consumption drivers like sugar-tax impacts or wellness trends. Company 10-Ks, investor decks, and reputable news aggregators through Dow Jones Factiva complement the evidence base with brand launches and channel shifts. The sources listed illustrate our approach; additional materials were tapped to complete data gathering and validation.
Market-Sizing & Forecasting
The core model begins with a top-down reconstruction of retail demand by aligning per-capita juice intake with population and disposable-income tiers, which are then cross-checked against production plus net imports. Supplier roll-ups and sampled ASP × liter calculations provide a selective bottom-up lens to fine-tune totals. Key variables include tropical fruit output swings, cold-pressed penetration rates, sugar-tax coverage, e-commerce share in beverage sales, and average PET-to-carton cost differentials. We project forward using multivariate regression that relates these drivers to historical consumption, supported by expert consensus on likely trajectories. Any bottom-up gaps are bridged through proportional allocation based on channel or region where evidence is strongest.
Data Validation & Update Cycle
Outputs pass three layers of analyst review, variance checks against external demand indicators, and client-side sense testing. Models refresh every twelve months, with ad-hoc revisions when harvest shocks, regulatory moves, or large acquisitions materially shift market dynamics. A fresh checkpoint is completed just before report release to ensure clients receive the latest view.
Why Mordor's Fruit And Vegetable Juice Baseline Earns Trust
Published figures often diverge because each firm chooses its own product mix, packaging formats, and pricing yardsticks before applying distinct refresh cadences.
Key gap drivers include some studies folding concentrates and food-service barrels into retail value, others inflating totals by benchmarking against wholesale prices, or applying uniform growth add-ons without factoring in sugar-tax dampening in mature economies. Mordor Intelligence limits scope to packaged retail units, updates models annually, and maps ASP movements country by country, which keeps our baseline grounded and reproducible.
Benchmark comparison
| Market Size | Anonymized source | Primary gap driver |
|---|---|---|
| USD 111.07 B (2025) | Mordor Intelligence | - |
| USD 295.49 B (2024) | Global Consultancy A | Includes concentrates and food-service drums; uses wholesale pricing |
| USD 313.10 B (2025) | Regional Consultancy B | Combines fruit juices with functional shots and smoothies; limited primary checks |
| USD 129.01 B (2024) | Trade Journal C | Excludes vegetable juices; assumes flat ASP across regions |
In sum, while other publishers swing high or low depending on scope choices and unchecked assumptions, our disciplined variable selection, yearly refresh, and dual validation loops deliver a balanced, transparent baseline that decision-makers can rely on with confidence.


Key Questions Answered in the Report
How large is the global fruit and vegetable juice market in 2026?
The fruit and vegetable juice market size is USD 116.23 billion in 2026 with a forecast CAGR of 5.53%.
Which product category is growing fastest?
Vegetable juice leads growth, advancing at an 8.41% CAGR through 2031 due to lower sugar and functional positioning.
What packaging trend is reshaping supply chains?
PET bottles made from 100% recycled resin are expanding at a 6.18% CAGR, supported by retailer sustainability targets.
Which region will post the highest growth?
South America is projected to register the strongest regional CAGR at 7.21% through 2031, driven by fortification standards and cold-chain upgrades.
Page last updated on:


