Market Overview
| Study Period | 2021 - 2031 |
|---|---|
| Forecast Data Period | 2026 - 2031 |
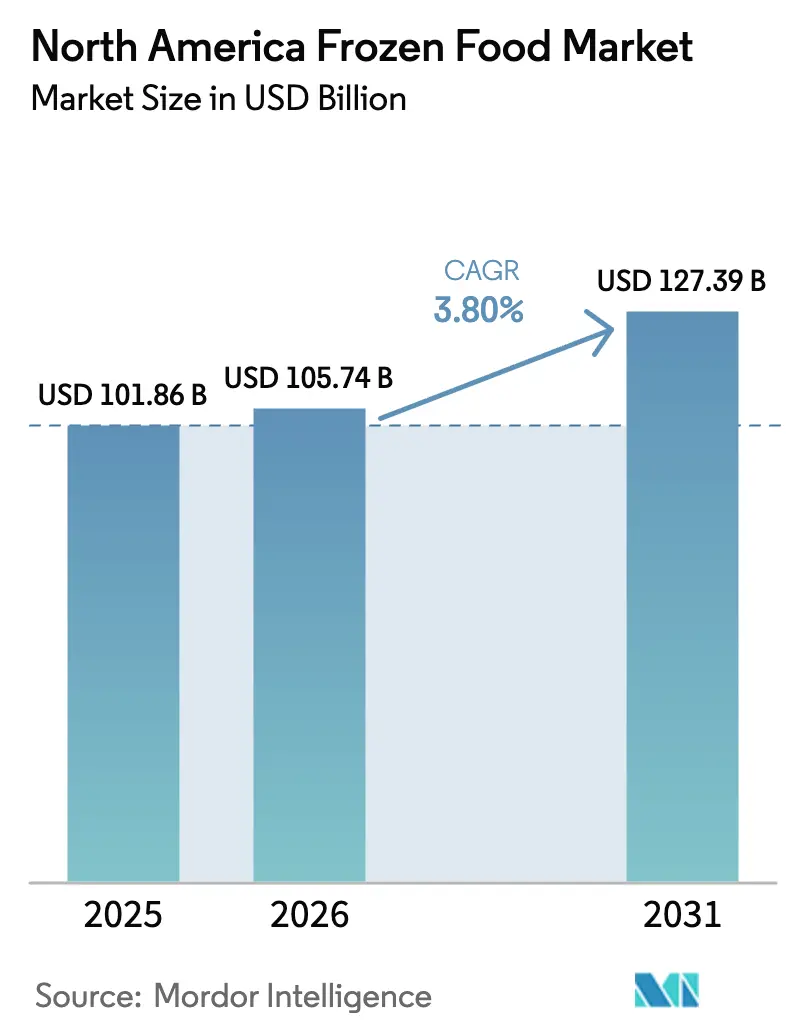
| Base Year Market Size (2025) | USD 101.86 Billion |
| Market Size (2026) | USD 105.74 Billion |
| Market Size (2031) | USD 127.39 Billion |
| Growth Rate (2026 - 2031) | 3.80% CAGR |
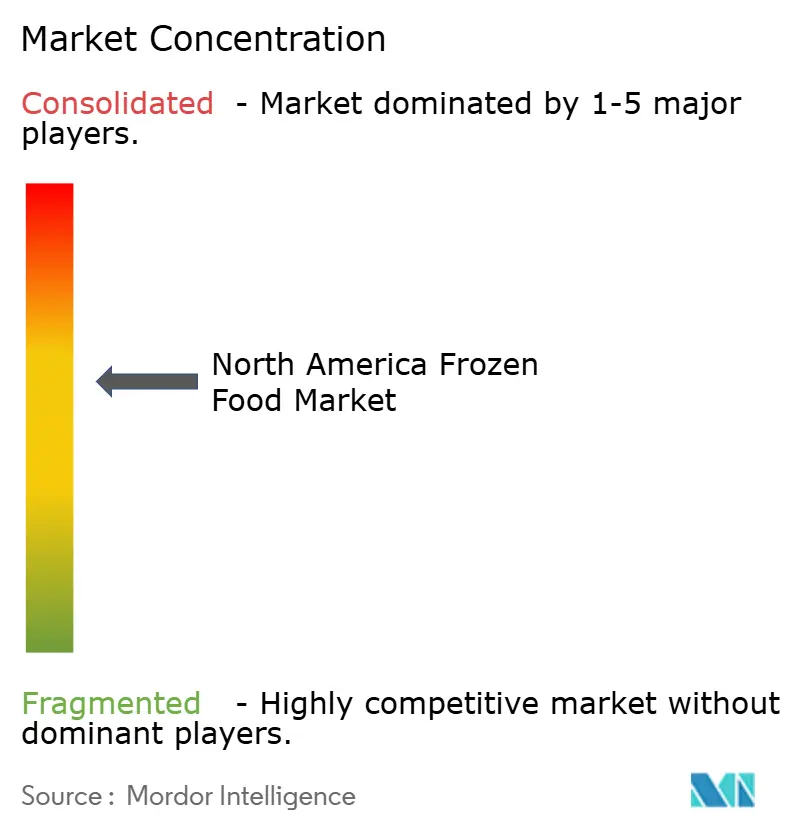
| Market Concentration | Medium |
Major Players
*Disclaimer: Major Players sorted in no particular order Image © Mordor Intelligence. Reuse requires attribution under CC BY 4.0. |
|
North America Frozen Food Market Analysis by Mordor Intelligence
The North America frozen food market was valued at USD 101.86 billion in 2025 and is expected to reach USD 105.74 billion in 2026 and USD 127.39 billion by 2031, growing at a CAGR of 3.80%. North America's appetite for frozen food is surging, propelled by a confluence of regional factors. One of the primary factors is the region's fast-paced lifestyle, coupled with an uptick in women's workforce participation, amplifying the demand for convenient meal solutions. As a result, consumers are gravitating towards ready-to-eat and ready-to-cook frozen meals that seamlessly fit into their hectic routines. Bolstering this trend is the region's robust cold chain infrastructure and the omnipresence of modern retail outlets, like supermarkets and hypermarkets, ensuring a broad spectrum of frozen products is readily available. Heightened health awareness among North Americans is steering them towards the rising trend of clean-label and organic frozen foods, further shaping market dynamics. On another front, technological strides in food preservation and packaging are not only enhancing the quality and shelf life of frozen items but also amplifying their allure.
Key Report Takeaways
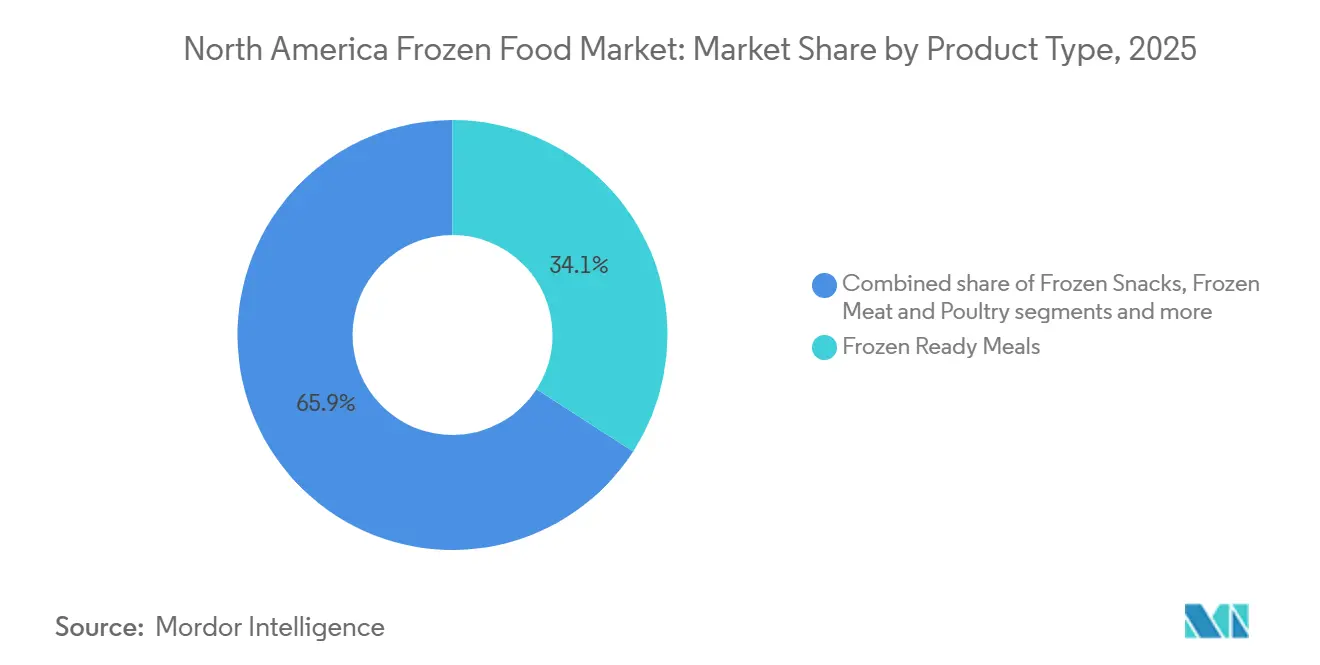
- By product type, frozen ready meals led with 34.12% of the North America frozen food market share in 2025; frozen snacks are projected to grow the fastest at a 6.21% CAGR through 2031.
- By category, the ready-to-eat segment captured 58.43% share of the North America frozen food market size in 2025, while ready-to-cook products are on track for a 6.52% CAGR between 2026-2031.
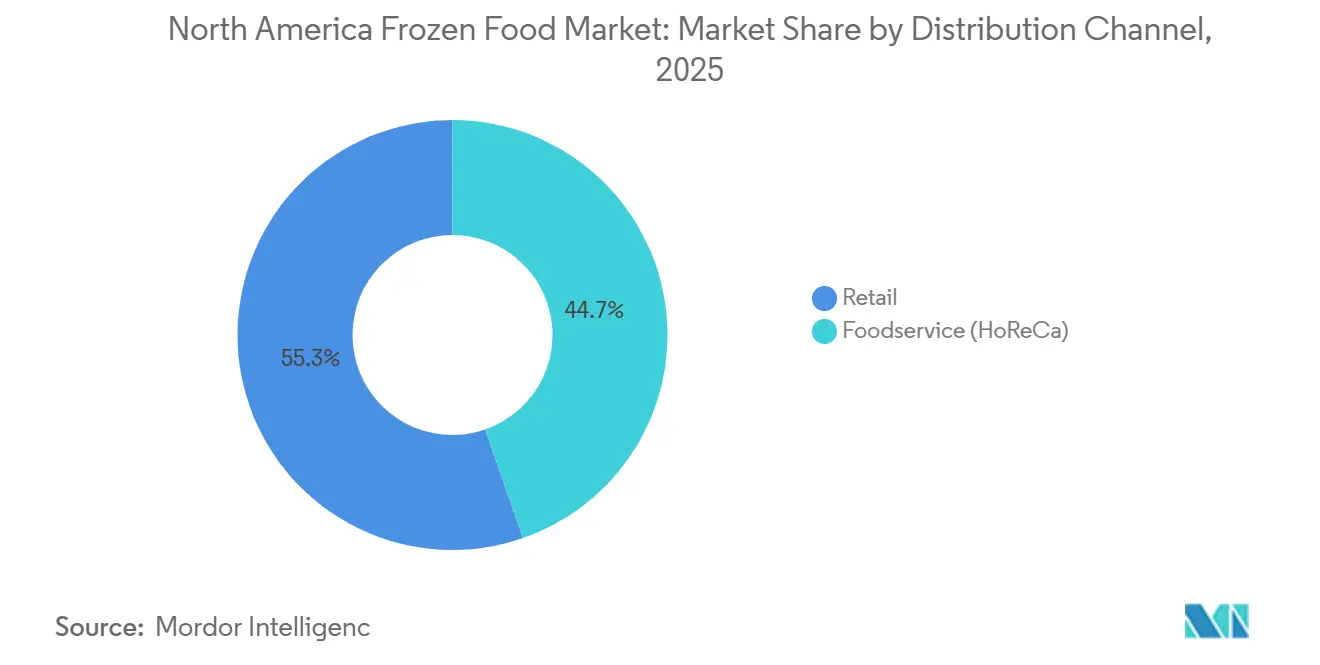
- By distribution channel, retail held 55.32% of the North America frozen food market share in 2025; foodservice (HoReCa) will register the highest growth at an 8.73% CAGR from 2026-2031.
- By geography, the United States dominated with 84.46% revenue share in 2025, whereas Mexico is set to expand the fastest at a 4.86% CAGR from 2026-2031.
Note: Market size and forecast figures in this report are generated using Mordor Intelligence’s proprietary estimation framework, updated with the latest available data and insights as of January 2026.
North America Frozen Food Market Trends and Insights
Drivers Impact Analysis*
| Driver | (~) % Impact on CAGR Forecast | Geographic Relevance | Impact Timeline |
|---|---|---|---|
| Rising demand for convenience meal solutions among U.S. Millennials and Gen Z | +1.2% | United States, Canada | Medium term (2-4 years) |
| Innovation in plant-based frozen entrées boosting health-positioned offerings | +0.8% | United States, Canada, Mexico | Long term (≥ 4 years) |
| Targeted marketing and advertisements elevating frozen food sales | +0.6% | North America | Short term (≤ 2 years) |
| Technological advancements in freezing and packaging | +0.5% | North America | Medium term (2-4 years) |
| Growing ethnic and global cuisine options | +0.4% | United States, Canada, Mexico | Medium term (2-4 years) |
| Increasing frozen aisles in retail channels | +0.3% | North America | Short term (≤ 2 years) |
| Source: Mordor Intelligence | |||
Rising demand for convenience meal solutions among U.S. Millennials and Gen Z
Millennials and Generation Z are significantly influencing the U.S. frozen food market due to their preference for convenient, time-saving meal options that align with their fast-paced and flexible lifestyles. As these generations transition through key life stages, such as living independently and forming households, frozen foods are increasingly perceived as practical everyday solutions rather than occasional purchases. According to the United States Census Bureau, millennials, the largest generational group in the United States as of 2024, account for approximately 74.19 million people, highlighting the substantial demand from this demographic[1]Source: United States Census Bureau, "National Population by Characteristics: 2020-2024", census.gov. Shifting eating habits, characterized by irregular schedules and a preference for smaller, customizable meals, have driven the growing popularity of frozen entrées and snack-style formats that serve as complete meals. In response, food manufacturers are diversifying their offerings by introducing premium, chef-inspired recipes, globally influenced flavors, and higher-quality ingredients. Product innovation now focuses on portion flexibility, enhanced nutritional profiles, and packaging designed for convenience and sustainability.
Innovation in plant-based frozen entrées boosting health-positioned offerings
The United States frozen food market is experiencing significant growth in plant-based frozen entrées, particularly those emphasizing health and wellness. Consumers are increasingly prioritizing frozen meal solutions that strike a balance between convenience and nutritional value, catering to diverse dietary preferences. To meet this demand, manufacturers are adopting advanced culinary techniques and utilizing high-quality ingredients to create flavorful, nutrient-rich plant-based meals. Reflecting this trend, in July 2024, Korean plant-based brand Unlimeat expanded its footprint in the U.S. by launching five products across 149 Giant and Martin’s stores. This included Korean-inspired plant-based meat alternatives and ready-to-eat options like frozen kimbap, enhancing consumer access to globally influenced, sustainable frozen food options. Increasing awareness of the environmental impact of food choices continues to drive demand for plant-based frozen products, highlighting a broader shift toward sustainable and health-focused offerings within the category. Additionally, the rising influence of GLP-1–based weight management has boosted interest in portion-controlled and calorie-conscious frozen meals. In response to this trend, Conagra introduced GLP-1–friendly labeling on its Healthy Choice frozen meals in January 2025. These initiatives have helped reposition frozen foods as a practical option for health-conscious consumers, improving the category's perception and encouraging wider adoption among wellness-focused segments.
Targeted marketing and advertisements elevating frozen food sales
Brand-led communication strategies are transforming perceptions of frozen foods, particularly among Millennials and Gen Z, by emphasizing digital-first engagement. Leading companies are allocating significant budgets to modern marketing channels; for example, Conagra Brands invested USD 289.6 million in advertising and promotional activities in 2024. Social media has emerged as a key platform for these efforts, allowing brands to connect with younger audiences through influencers, short-form video content, and lifestyle-oriented messaging. According to the International Food Information Council’s 2024 Food and Health Survey, 54% of consumers encounter food-related content on social media, underscoring its growing impact on purchasing decisions. Marketing narratives are increasingly tailored to address consumer priorities, including health, convenience, and efficiency. Campaigns often highlight innovations like Individual Quick Freezing (IQF), which preserves taste, texture, and nutritional value, positioning frozen foods as a practical alternative to fresh options. Industry-led educational initiatives, such as the “Frozen Food Revolution” cited by Procurement Resource, aim to address lingering concerns about quality and freshness at the retail level. By combining these efforts with data-driven targeting and personalized messaging, brands are successfully re-engaging health-conscious consumers who had previously moved away from frozen food categories.
Technological advancements in freezing and packaging
Advanced freezing and packaging technologies are significantly enhancing the quality, efficiency, and sustainability of frozen foods. For example, Individual Quick Freezing (IQF) rapidly freezes products individually, preserving natural cell integrity and resulting in better flavor, texture, and appearance after reheating. Modified Atmosphere Packaging (MAP) extends shelf life by regulating internal gas levels, reducing moisture loss and freezer burn, while also enabling manufacturers to decrease plastic usage, aligning with sustainability goals. Cryogenic freezing, which utilizes liquid nitrogen or carbon dioxide, supports high-throughput production in limited facility spaces, improves energy efficiency, and maintains product quality by minimizing ice crystal formation across various food categories, including proteins, produce, bakery items, and ready meals. Additionally, digital and smart manufacturing solutions are increasingly integrated into frozen food operations. For instance, platforms like JBT’s OmniBlu leverage real-time data monitoring and analytics to optimize process control, minimize equipment downtime, and enable more informed decision-making. As environmental responsibility becomes a priority in the food industry, adopting these advanced technologies is essential. Frozen food producers are utilizing innovation to meet growing consumer demands for quality, transparency, and sustainability while enhancing production efficiency and reducing environmental impact.
Restraints Impact Analysis*
| Restraint | (~) % Impact on CAGR Forecast | Geographic Relevance | Impact Timeline |
|---|---|---|---|
| Perceived nutritional inferiority vs fresh produce among affluent consumers | -0.6% | United States, Canada | Medium term (2-4 years) |
| Rising competition from fresh meal kits and delivery services | -0.4% | Urban centers across North America | Medium term (2-4 years) |
| Negative perceptions around ultra-processed frozen products | -0.5% | United States, Canada | Long term (≥ 4 years) |
| Energy costs for freezing and storage | -0.2% | North America | Short term (≤ 2 years) |
| Source: Mordor Intelligence | |||
Perceived nutritional inferiority vs fresh produce among affluent consumers
Frozen fruits and vegetables provide convenience and an extended shelf life but are often viewed by affluent consumers as less nutritious compared to fresh produce. This perception is driven by concerns about nutrient loss during processing and storage, the use of additives, and the belief that these products undergo extensive processing. Millennials, in particular, are highly attentive to food quality and sourcing, showing a preference for products they perceive as more "natural" or minimally processed. Their purchasing decisions are heavily influenced by these factors, reflecting broader consumer trends. According to the International Food Information Council Food and Health Survey 2024, 62% of consumers prioritize health benefits over price when selecting food [2]Source: International Food Information Council, "2024 IFIC Food & Health SURVEY", ific.org. This statistic underscores the significant role that perceived health and quality play in shaping consumer behavior within the frozen food market. Addressing these concerns is crucial for increasing adoption and acceptance, particularly among health-conscious consumers who demand transparency and assurance regarding the nutritional value and processing methods of frozen products.
Rising competition from fresh meal kits and delivery services
The increasing adoption of meal-kit subscriptions and food delivery applications poses a significant challenge to the North American frozen food market, particularly among high-income consumers. These services provide pre-portioned, restaurant-quality meals that are easy to prepare and often feature sustainable, visually appealing packaging. This positions them as premium alternatives to traditional frozen foods. Their customizable options, diverse flavor profiles, and perceived freshness further diminish the appeal of frozen products. Moreover, the ongoing growth of these services pressures frozen food manufacturers to enhance product quality while maintaining cost efficiency. The rising costs of essential raw materials, such as proteins and vegetables, add to the difficulty of offering competitively priced products. Consequently, the frozen food market faces heightened competition from solutions that combine convenience, perceived freshness, and a premium experience, threatening its position within the ready-to-eat and ready-to-cook meal segment.
*Our forecasts treat driver/restraint impacts as directional, not additive. The impact forecasts reflect baseline growth, mix effects, and variable interactions.
Segment Analysis
By Product Type: Premium Ready Meals Redefine Value
In 2025, frozen ready meals accounted for 34.12% of the North American frozen food market, driven by their convenience and appeal to busy lifestyles. The segment continues to grow through product improvements, including enhanced pasta textures, richer sauces, and compatibility with modern cooking appliances such as air fryers. Frozen snacks, including products like dumplings and pizza bites, are expected to witness the fastest growth, with a projected CAGR of 6.21% from 2026 to 2031. This growth is attributed to the increasing trend of snacks being used as meal replacements. While the meat and poultry category remains a significant contributor to overall sales, seafood is emerging as a faster-growing segment due to rising consumer demand for convenient, lean protein options.
The frozen fruit and vegetable category maintains a stable position in the market, despite ongoing concerns about quality perceptions. Brands are addressing these challenges through innovations such as farm-to-package traceability using QR codes and flash-steaming techniques that help retain nutrients. Health-focused product development continues to influence market trends. For example, in May 2024, Nestlé launched Vital Pursuit, a frozen food line in the U.S. tailored for users of GLP-1 weight management therapies and other weight-conscious consumers. These products emphasize high protein content, ample fiber, essential micronutrients, and portion sizes designed to support appetite control and dietary goals.


By Category: Ready-to-Cook Gains Momentum
In 2025, ready-to-eat (RTE) meals accounted for 58.43% of the frozen food market, highlighting their strong appeal among time-constrained consumers. These products incorporate innovations such as microwave-ready trays, self-venting films, and pre-portioned seasoning packets to enhance convenience and meal quality. The inclusion of air-fryer cooking instructions addresses the growing adoption of this appliance, particularly among Gen Z. RTE meals remain a preferred choice for busy professionals and families seeking quick, hassle-free meal solutions. Additionally, improvements in nutritional profiles and ingredient transparency align these products with evolving consumer expectations, making them a versatile option for various consumer groups.
The ready-to-cook (RTC) segment is projected to grow at a 6.52% CAGR, driven by consumers who prefer a hands-on approach to meal preparation. These products provide greater flexibility in ingredients and portion sizes, enabling meal customization. Innovations such as improved batter adhesion, steam-bag vegetables, and grill-from-frozen capabilities ensure quality comparable to fresh produce. Health-conscious consumers are increasingly attracted to this segment, as active involvement in cooking allows better control over sodium, fat, and nutrient intake. RTC products have also benefited from advancements in packaging, portion control, and globally inspired flavor options, enhancing both convenience and culinary variety. This segment caters to consumers seeking a balance between convenience and the satisfaction of preparing meals tailored to their preferences.
By Distribution Channel: Retail Dominates However Foodservice Sees Rapid Growth
In 2025, retail channels represented 55.32% of the North American frozen food market, with supermarkets and hypermarkets maintaining a dominant position. These outlets benefit from broad product assortments, immediate availability, and cross-category promotional strategies. Their large store formats feature dedicated frozen sections, organized into specific aisles for ready meals, vegetables, meats, and desserts. While these formats remain prominent, consumer shopping behaviors are increasingly diversifying across multiple retail outlets. Convenience stores are gaining importance by catering to quick, on-the-go purchases, such as single-serve burritos and breakfast items, targeting urban professionals and students who prioritize speed and accessibility.
The foodservice (HoReCa) segment is expanding at a CAGR of 8.73%, driven by rising labor costs, operational challenges, and the demand for efficiency in busy kitchens. Frozen products are increasingly utilized in this sector to reduce preparation time, minimize food waste, and ensure consistent food safety standards. Beyond operational efficiency, frozen foods support menu diversification and help stabilize supply chains, making them particularly valuable for quick-service restaurants, catering services, and institutional dining. The growing consumer preference for convenient, affordable, and reliable meal options continues to fuel growth in this segment.
Geography Analysis
In 2025, the United States accounted for 84.46% of the North American frozen food market. This dominance is attributed to widespread household freezer ownership, extensive retail networks, and consistent consumer demand for high-quality frozen products. Within the U.S., the Midwest and Northeast regions report the highest per capita consumption, reflecting regional preferences and access to frozen food options. Changing consumer preferences toward nutritious frozen vegetables and portion-controlled meals are influencing product development, as manufacturers aim to cater to health-conscious consumers. Market growth is further supported by advancements in freezing technologies, improved cold chain logistics, and efforts to reduce food waste through frozen storage solutions, which are increasingly recognized as sustainable practices.
Mexico is projected to grow at a 4.86% CAGR through 2031, driven by the expansion of supermarket chains, rising e-commerce penetration, and the increasing prevalence of urban dual-income households adopting frozen ready meals and plant-based snacks. According to the USDA, Mexico’s food processing industry contributed 4% of the national GDP in 2024, highlighting strong domestic frozen food manufacturing capabilities [3]Source: United States Department of Agriculture, "Food Processing Ingredients Annual", usdamexico.org. The growth of the frozen food market in Mexico is further bolstered by investments in cold storage facilities, modernized retail infrastructure, and the adoption of Western eating habits among urban consumers. These factors are enabling greater accessibility and convenience for consumers, particularly in urban areas where time-saving meal options are in high demand.
Canada holds a significant share of the regional market, with consumer demand centered on organic, clean-label products and sustainability initiatives, such as recyclable packaging and locally sourced ingredients. The market benefits from stringent food safety regulations, advanced cold chain systems, and a growing preference for premium frozen options, which cater to consumers seeking high-quality and environmentally friendly products. Other North American regions contribute to the market through niche and ethnic product offerings, catering to diverse populations and local culinary preferences. These regions play a vital role in addressing the unique demands of multicultural communities, further enriching the overall market landscape.
Competitive Landscape
The North American frozen food market exhibits moderate concentration, with major players such as Conagra, Tyson, Nestlé, and McCain commanding a significant share of revenue. However, these incumbents face ongoing challenges from the growth of plant-based competitors and the expansion of private-label offerings. Competitive strategies in the market diverge between innovation and efficiency. Multinational companies focus on research and development initiatives, such as isochoric freezing and clean-label reformulations, as well as mergers and acquisitions to address portfolio gaps. In contrast, regional processors prioritize cost competitiveness through vertical integration and proximity to agricultural inputs.
Growth opportunities are concentrated in three key areas: ultra-premium frozen meals targeting affluent consumers willing to spend USD 12-15 per entrée for chef-designed recipes; ethnic cuisines co-branded with culinary experts from diaspora communities; and hybrid ready-to-cook kits that combine the convenience of frozen foods with the customization of meal kits. Technological advancements are centered on improving freezing precision and packaging innovation. Brands that minimize drip loss and extend shelf life gain favor with retailers by reducing shrinkage and increasing product turnover.
Compliance with FDA food safety standards and CFIA bilingual labeling requirements remains essential. However, the lack of harmonized definitions for ultra-processed foods creates strategic uncertainty. Some brands adopt "clean label" positioning, while others avoid engaging in this debate. The next area of competitive differentiation lies in vertical integration within cold-chain logistics. Companies that manage warehousing and last-mile delivery can provide retailers with guaranteed fill rates and shorter lead times, a critical advantage during periods of seasonal demand spikes and supply chain disruptions.
North America Frozen Food Industry Leaders
-
Conagra Brands Inc.
-
Nestlé S.A
-
McCain Foods Limited
-
Kraft Heinz Company
-
Tyson Foods, Inc.
- *Disclaimer: Major Players sorted in no particular order

Recent Industry Developments
- February 2025: Baja Foods, a family-owned company specializing in authentic Mexican frozen foods, has introduced a new premium retail brand, Chef Gustavo. The brand's initial offering, Chicken & Cheese Enchiladas with Salsa Verde, is now available in the frozen food aisles of select Costco stores in the U.S. Midwest. These enchiladas feature antibiotic-free shredded white meat chicken wrapped in corn tortillas with vegetables, fiesta rice, salsa verde, and melted cheese, providing a convenient, chef-inspired frozen meal option for Costco members.
- November 2024: Wardwizard Foods and Beverages Limited has expanded its global footprint by exporting a range of frozen food products under its QuikShef brand to Canada, the United States, and the United Arab Emirates. Shipments to the U.S. and UAE include ready-to-eat Indian meals such as Palak Paneer, Dal Makhni, and Kadhi Pakoda, along with customized items like Gujarati Dal and Amritsari Chole. For the Canadian market, the consignment features Indian-inspired frozen items such as Jain Pizza, Veggie Delight Pizza, Tandoori Paneer Pizza, and snacks like burger patties and cheese corn samosas, catering to diverse international palates.
- October 2024: Delimex expanded its product line beyond taquitos by introducing Crispy Quesadillas. The Crispy Quesadillas are available in frozen Char-Grilled Chicken and Chipotle Chicken varieties. The products utilize Kraft Heinz's 360CRISP technology to produce microwave-ready quesadillas with a pan-fried texture.
- September 2024: Amy's Kitchen expanded its frozen food product line by entering the breakfast category with burritos, wraps, and entrees. The company, which specializes in organic and natural frozen foods, developed these breakfast options to provide convenient organic meals.


Research Methodology Framework and Report Scope
Market Definitions and Key Coverage
Our study defines the North America frozen food market as all industrially processed foods that are blast, belt, or individually quick frozen and kept at or below -18 C right through retail or food-service distribution across the United States, Canada, and Mexico. This includes ready meals, meat, seafood, bakery items, fruits, vegetables, snacks, and desserts once they enter the commercial cold chain.
Scope Exclusions: chilled prepared foods, home-frozen leftovers, and novelties sold from vending cabinets fall outside the study.
Segmentation Overview
-
By Product Type
- Frozen Fruits and Vegetables
- Frozen Meat and Poultry
- Frozen Seafood
- Frozen Ready Meals
- Frozen Bakery and Desserts
- Frozen Snacks
- Others
-
By Category
- Ready-To-Eat
- Ready-To-Cook
-
By Distribution Channel
- Foodservice (HoReCa)
-
Retail
- Supermarkets and Hypermarkets
- Convenience Stores
- Online Stores
- Other Retail Formats
-
By Geography
- United States
- Canada
- Mexico
- Rest of North America
Detailed Research Methodology and Data Validation
Primary Research
Our analysts interviewed frozen-food plant managers, third-party cold-chain operators, grocery category buyers, and QSR menu developers across all three countries. Insights on average selling prices, pack-size shifts, and SKU rationalization helped us calibrate model sensitivities and close information gaps revealed during desk work.
Desk Research
We began with public datasets such as USDA Quick Stats on frozen vegetable output, American Frozen Food Institute quarterly shipment dashboards, Statistics Canada retail scanner panels, INEGI trade records, and UN Comtrade codes HS-03 and 2106 to rebuild cross-border flows. According to Mordor Intelligence practice, this baseline is enriched with macro backfills from sources such as the World Bank and OECD.
Company 10-Ks, investor presentations, and food-retailer transcripts add pricing color, while D&B Hoovers supplies revenue splits and Dow Jones Factiva flags facility expansions that adjust capacity assumptions. The sources named are illustrative; many other open and subscription datasets were reviewed for collection, validation, and clarification.
Market-Sizing & Forecasting
A top-down model reconstructs demand from retail scanner sales and food-service shipment pools, then adjusts for import-export balances and wastage. Select bottom-up checks, supplier roll-ups and sampled ASP x volume calculations, ground the totals. Variables such as cold-chain cubic-foot capacity, disposable income, home-freezer penetration, CPI-tracked frozen-meal inflation, and QSR outlet growth feed a multivariate regression that projects value through 2030. Scenario analysis layers macro or regulatory shocks before results are finalized.
Data Validation & Update Cycle
Analysts run anomaly and variance tests against indicators like AFFI store audits and customs manifests; material gaps trigger fresh calls with sources. A two-step peer review precedes sign-off, and Mordor Intelligence refreshes every dataset annually, issuing interim tweaks whenever mergers, policy shifts, or currency swings materially alter the outlook.
Why Mordor's North America Frozen Food Baseline Earns Trust
Published estimates often diverge because firms pick different product baskets, channel splits, and currency years. We outline below how these choices widen gaps.
Many providers fold chilled meals into frozen totals or apply aggressive online penetration rates, whereas Mordor's scope stays strictly at <= -18 C and reports current-year constant-currency dollars. Others rely on multi-year averaging or slower refresh cycles that miss rapid inflation in ingredient costs.
Benchmark comparison
| Market Size | Anonymized source | Primary gap driver |
|---|---|---|
| USD 105.74 B (2025) | Mordor Intelligence | - |
| USD 119.95 B (2024) | Regional Consultancy A | Includes chilled entrées, uses list prices rather than net ASPs |
| USD 179.97 B (2023) | Global Consultancy B | Bundles ice cream and pet frozen treats, applies 2021 exchange rates |
The comparison shows how widened scopes and outdated inputs inflate figures. By anchoring every step to traceable variables and an annual refresh, Mordor Intelligence offers decision-makers a balanced, dependable baseline.


Key Questions Answered in the Report
What is the current value of the North America frozen food market?
The North America frozen food market size equals USD 105.74 billion in 2026 and is projected to reach USD 127.39 billion by 2031.
Which product segment is growing fastest?
Frozen Snacks are set to advance at a 6.21% CAGR through 2031 as portion-controlled, on-the-go formats resonate with Gen Z and GLP-1 users.
Why is foodservice demand for frozen foods accelerating?
Labor shortages and 15-20% wage inflation make pre-portioned frozen inputs economically attractive, pushing foodservice growth to an 8.73% CAGR.
Which geography shows the fastest growth outlook?
Mexico is forecast to post a 4.86% CAGR through 2031, spurred by urbanization and supermarket freezer-aisle expansion.
Page last updated on:


