Market Overview
| Study Period | 2018 - 2031 |
|---|---|
| Forecast Data Period | 2026 - 2031 |
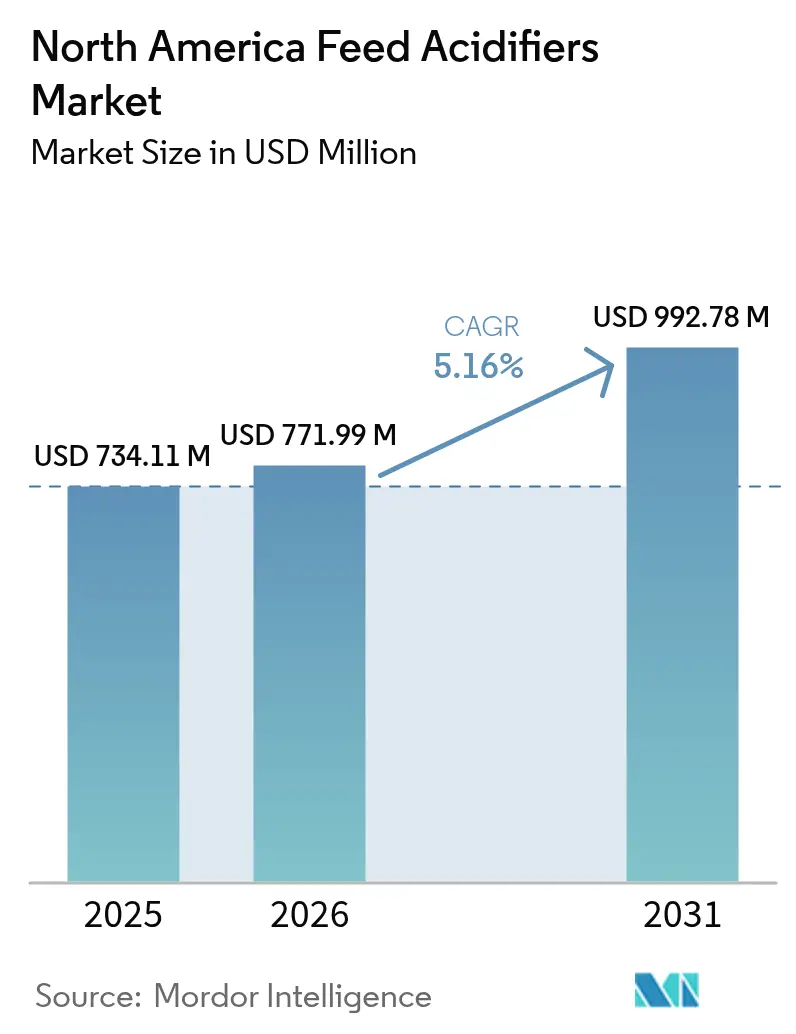
| Base Year Market Size (2025) | USD 734.11 Million |
| Market Size (2026) | USD 771.99 Million |
| Market Size (2031) | USD 992.78 Million |
| Growth Rate (2026 - 2031) | 5.16% CAGR |
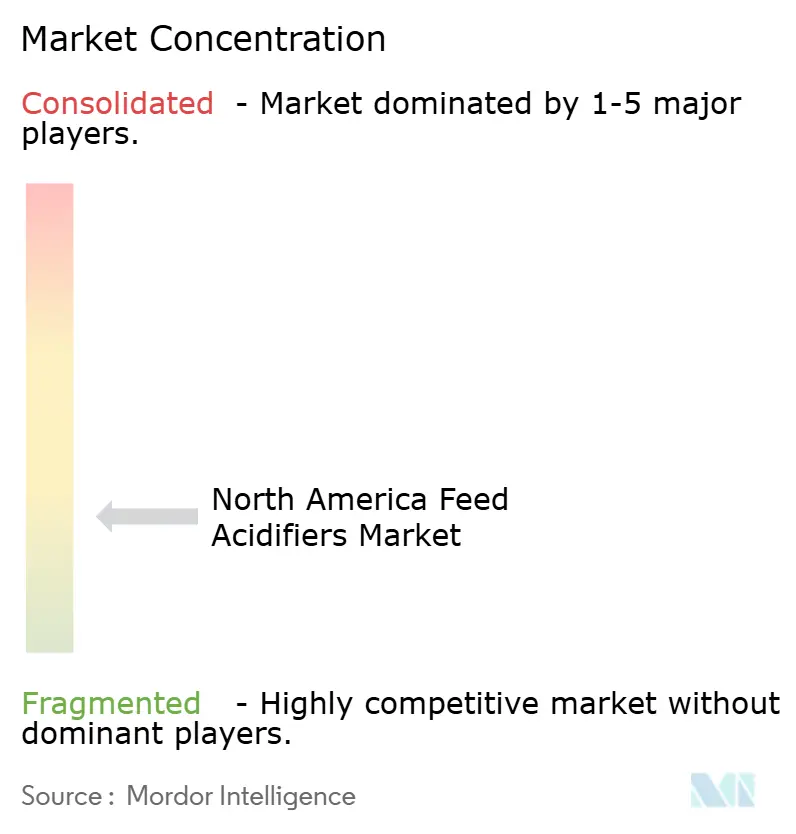
| Market Concentration | Low |
Major Players *Disclaimer: Major Players sorted in no particular order Image © Mordor Intelligence. Reuse requires attribution under CC BY 4.0. | |
North America Feed Acidifiers Market Analysis by Mordor Intelligence
The North America feed acidifiers market size is expected to grow from USD 734.11 million in 2025 to USD 771.99 million in 2026 and is forecast to reach USD 992.78 million by 2031 at 5.16% CAGR over 2026-2031. Market expansion is rooted in the pivot away from antibiotic growth promoters toward organic acids, tighter Food and Drug Administration and Association of American Feed Control Officials (FDA and AAFCO) compliance deadlines, and the steady modernization of integrated feed mills. Carbon-footprint labeling, rising poultry and swine throughput, and AI-enabled micro-dosing systems are strengthening competitive advantages for producers that deploy precision acidifier programs. Organic-acid blends also deliver proven feed-conversion gains in broilers, nursery pigs, and high-producing dairy herds, enhancing returns in a region where feed routinely represents up to 70% of production costs. Simultaneously, volatile raw-material prices and competition from post-biotics and phytogenics temper adoption rates, underscoring the need for cost-effective sourcing and robust technical support strategies.
Key Report Takeaways
- By sub-additive, propionic acid captured 36.78% of the North America feed acidifiers market share in 2025, while fumaric acid is forecast to grow at a 5.31% CAGR through 2031.
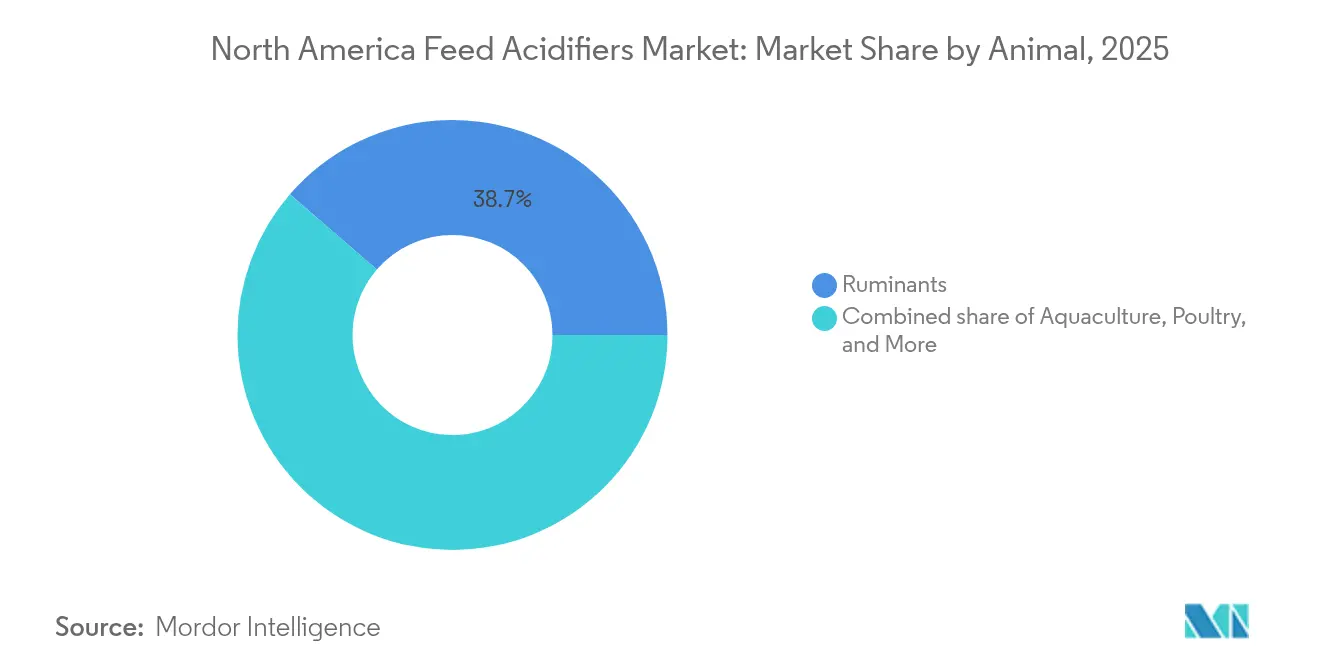
- By animal, ruminants accounted for 38.65% of the North America feed acidifiers market size in 2025 and are advancing at a 5.48% CAGR through 2031.
- By geography, the United States led with 69.92% revenue share of the market in 2025; Mexico is projected to record the highest CAGR at 5.55% to 2031.
Note: Market size and forecast figures in this report are generated using Mordor Intelligence’s proprietary estimation framework, updated with the latest available data and insights as of 2026.
North America Feed Acidifiers Market Trends and Insights
Drivers Impact Analysis*
| Driver | (~) % Impact on CAGR Forecast | Geographic Relevance | Impact Timeline |
|---|---|---|---|
| Post-antibiotic growth-promoter regulations | +1.2% | United States and Canada | Medium term (2-4 years) |
| Rising regional meat and dairy consumption | +0.8% | United States and Mexico | Long term (≥ 4 years) |
| Expansion of integrated feed mills and premix plants | +0.7% | United States and Canada | Medium term (2-4 years) |
| Proven feed-conversion gains from propionic-formic blends | +0.6% | Region-wide | Short term (≤ 2 years) |
| AI-enabled micro-dosing systems in feed mills | +0.4% | United States and Canada | Long term (≥ 4 years) |
| Carbon-footprint labeling pushing gut-efficiency additives | +0.3% | United States and Canada | Long term (≥ 4 years) |
| Source: Mordor Intelligence | |||
Post-antibiotic growth-promoter regulations
The close of FDA enforcement discretion in 2024 forced feed manufacturers to replace non-compliant ingredients with organic acids, cementing long-term demand momentum[1]Source: U.S. Food and Drug Administration, “Animal Food Ingredient Review Program,” FDA.gov. Across poultry and swine value chains, producers report 3% to 5% historical performance gains from antibiotics; multi-acid blends now match those benchmarks in peer-reviewed trials. Canada’s Feeds Regulations 2024 introduced facility licensing and preventive control plans, increasing compliance costs yet streamlining product approvals. Smaller mills increasingly depend on premix suppliers for regulatory guidance, which elevates barriers to entry and solidifies share for established brands. Reversal back to antibiotics is unlikely because consumer expectations and export-market requirements favor drug-free protein production.
Rising regional meat and dairy consumption
The United States Department of Agriculture (USDA) projects 46.8 billion lb of U.S. poultry output in 2025, sustaining incremental growth despite feed-cost headwinds[2]Source: United States Department of Agriculture Economic Research Service, “Poultry and Eggs Outlook,” ers.usda.gov. Mexico is on a similar path as peso devaluation supports export competitiveness, lifting cattle and swine herds. Expanding herd and flock sizes magnify the economic benefit of 2%–6% feed-conversion improvements delivered by acidifiers. Dairy Farmers of America demonstrated carbon-reduction credits of 0.5 metric tons CO₂e per cow through additive use, turning environmental compliance into a revenue stream. Consolidation in meat-processing further compels consistent product quality, reinforcing acidifier adoption for shelf-life and pathogen control.
Expansion of integrated feed mills and premix plants
Cargill’s USD 25 million acquisition of mills in Denver and Kansas City exemplifies capacity upgrades favoring automated additive dosing. Investments like Wayne-Sanderson Farms’ USD 25 million renovation in North Carolina modernize bulk-handling systems that seamlessly incorporate liquid acidifiers. Consolidated operations negotiate volume discounts, driving down per-ton treatment costs and securing multi-year supply contracts for acidifier vendors. Premix plant proliferation directly raises demand because such facilities specialize in precise additive blending that maximizes organic-acid efficacy.
Proven feed-conversion gains from propionic-formic blends
Academic research cites 6%–10% feed-conversion ratio improvements and 2%–6% higher average daily gains in broilers when organic-acid blends replace antibiotics. Nursery pigs supplemented with 0.60% benzoic acid recorded 9.5% daily-gain uplifts. Mechanistic studies reveal lower ileal pH, taller villi, and enhanced tight-junction expression, validating performance benefits. Economic modeling confirms that every 1% efficiency gain reduces feed cost per head by up to USD 1.10 in broilers and USD 2.45 in finishing pigs, an attractive return in high-volume systems.
Restraints Impact Analysis*
| Restraint | (~) % Impact on CAGR Forecast | Geographic Relevance | Impact Timeline |
|---|---|---|---|
| Volatile organic-acid input prices | -0.9% | Region-wide | Short term (≤ 2 years) |
| Palatability and equipment-corrosion concerns | -0.6% | United States, Canada | Medium term (2-4 years) |
| FDA-AAFCO process uncertainty for novel formulations | -0.4% | United States | Short term (≤ 2 years) |
| Competitive pull from post-biotics and phytogenics | -0.5% | Region-wide | Long term (≥ 4 years) |
| Source: Mordor Intelligence | |||
Volatile organic-acid input prices
Propionic acid relies on petroleum derivatives whose pricing spiked amid energy-market swings, raising procurement risk and compressing manufacturer margins. European phosphoric acid reached EUR 1,500 per metric ton (USD 1,635 per metric ton) in 2024, signaling similar volatility for North American buyers. While U.S. corn prices have fallen to USD 4.40 per bu, offsetting some feed-formulation pressure, smaller mills lack hedging capacity and may limit additive usage when acid costs spike.
Palatability and equipment-corrosion concerns
High inclusion rates of formic or lactic acid lower feed pH but can provoke feed refusal in sensitive swine phases and corrode mild-steel augers. Coated or buffered formulations alleviate but do not eliminate these issues, adding cost. Long-term equipment retrofits toward stainless steel or polymer-lined bins are underway, yet require capital outlays that some operators defer, prolonging hesitation among early-stage adopters.
*Our forecasts treat driver/restraint impacts as directional, not additive. The impact forecasts reflect baseline growth, mix effects, and variable interactions.
Segment Analysis
By Sub-Additive: Propionic Acid Maintains Lead as Fumaric Gains Ground
Propionic acid controlled 36.78% of 2025 revenue, underscoring its entrenched efficacy and regulatory familiarity within the North America feed acidifiers market. Fumaric acid, though smaller in absolute terms, is poised for a 5.31% CAGR through 2031, aided by its mild taste profile and lower corrosivity, key advantages as integrators upgrade dosing equipment. Multi-acid blends featuring propionic-formic or fumaric-lactic combinations are increasingly favored, reflecting a shift away from single-acid solutions toward synergistic microflora management. BASF’s Amasil portfolio capitalizes on this trend by offering coated forms that release acids gradually, protecting upper-gut integrity and reducing feed-mill vapor concerns.
Second-generation delivery technologies, such as lipid encapsulation, enhance stability under pelleting temperatures while improving palatability, broadening use across nursery pigs and starter-phase broilers. Regulatory pathways remain favorable because each constituent organic acid possesses established safety dossiers, streamlining registration of composite products. Nonetheless, ongoing raw-material price swings may influence sub-additive mix shifts as formulators balance efficacy against cost.


By Animal: Ruminant Uptake Outpaces Other Species
Ruminants accounted for 38.65% of the 2025 demand within the North America feed acidifiers market size and are projected to expand at a 5.48% CAGR through 2031. Widespread adoption in large-herd dairies aligns with sustainability audits that reward lower methane emissions linked to improved feed efficiency. Propionic-formic blends stabilize silage, mitigating spoilage and suppressing molds, a pressing concern in humid Midwest climates. Beef feedlots likewise adopt acidifiers for pathogen control during high-energy finishing diets, safeguarding carcass hygiene scores.
Poultry remains the second-largest user, leveraging rapid pH reduction to curb Salmonella and Campylobacter in high-density broiler houses. Swine integrators prioritize benzoic and fumaric acids in nursery diets to combat post-weaning diarrhea, a costly performance drag. Aquaculture, while currently niche, signals future upside as regulatory clarity in shrimp and trout diets improves, and early trials confirm gut-integrity benefits similar to terrestrial livestock.
Geography Analysis
The United States generated 69.92% of the total 2025 revenue, reflecting its dense cluster of vertically integrated poultry and swine complexes and the clearest regulatory roadmap for organic-acid approvals. Domestic suppliers leverage proximity to petroleum-based feedstocks, tempering cost spikes versus imports. Canada ranks second, its dairy-centric structure embracing acidifiers for both feed preservation and carbon-credit validation. The Feeds Regulations 2024 mandate preventive controls, elevating technical-service demand that global players can satisfy.
Mexico is on pace for the highest CAGR at 5.55% as expanding pork exports and competitive feed grain pricing underpin feed mill modernization. Growth prospects hinge on increased cold-chain penetration and producer willingness to invest in pathogen-control inputs amid rising consumer safety expectations. Smaller Central American economies remain embryonic but present long-term strategic options for early-stage market development programs.
Canada follows as the second-largest market. Its new Feeds Regulations 2024 bring preventive control plans into force, pushing mills toward higher traceability and additive precision. Large-scale dairy operations in Alberta and Ontario are especially receptive because propionic-formic blends preserve high-moisture corn and total mixed rations, reinforcing milk-fat yields. Sustainability incentives for methane reduction further encourage adoption.
Competitive Landscape
The North America feed acidifiers market is fragmented. BASF SE, Adisseo, Brenntag SE, Cargill Inc., and SHV (Nutreco NV) collectively held a good revenue in 2024, leaving ample space for mid-tier innovators. Consolidation is accelerating: Phibro’s USD 350 million purchase of Zoetis’ medicated feed additives in 2024 instantly broadened its sales footprint across 80 countries. Cargill’s recent mill acquisitions embed captive demand for its in-house organic-acid blends, demonstrating vertical integration.
Technology is an emerging battlefield. Vendors offering AI-linked dosage pumps capture data streams that feed into advisory platforms, locking in customer stickiness while driving incremental service revenue. Product differentiation hinges on coated or buffered formulations that marry efficacy with equipment safety. New entrants such as Resilient Biotics pursue microbiome-driven solutions that may partially cannibalize acidifier volumes over the long term, but registration hurdles extend incumbent advantage.
Market participants also pursue sustainability branding. Dairy Farmers of America’s carbon-credit pilot relies on verified acidifier use, opening collaborative opportunities between additive suppliers and producer-owned cooperatives. Meanwhile, Asia-based players like EASY BIO leverage North American acquisitions to fast-track regulatory approvals and market penetration, intensifying competitive dynamics.
North America Feed Acidifiers Industry Leaders
Adisseo
BASF SE
Brenntag SE
Cargill Inc.
SHV (Nutreco NV)
- *Disclaimer: Major Players sorted in no particular order

Recent Industry Developments
- January 2025: Novus International partnered with Resilient Biotics to develop microbiome-based swine health solutions targeting respiratory disease reduction.
- November 2024: Granite Creek Capital Partners invested in Global Animal Products management buyout to scale feed additive manufacturing.
- October 2024: Phibro Animal Health completed a USD 350 million acquisition of Zoetis’ medicated feed additive portfolio.


North America Feed Acidifiers Market Report Scope
Fumaric Acid, Lactic Acid, Propionic Acid are covered as segments by Sub Additive. Aquaculture, Poultry, Ruminants, Swine are covered as segments by Animal. Canada, Mexico, United States are covered as segments by Country.Sub Additive
| Fumaric Acid |
| Lactic Acid |
| Propionic Acid |
| Other Acidifiers |
Animal
| Aquaculture | Fish |
| Shrimp | |
| Other Aquaculture Species | |
| Poultry | Broiler |
| Layer | |
| Other Poultry Birds | |
| Ruminants | Beef Cattle |
| Dairy Cattle | |
| Other Ruminants | |
| Swine | |
| Other Animals |
Geography
| United States |
| Canada |
| Mexico |
| Rest of North America |
| Sub Additive | Fumaric Acid | |
| Lactic Acid | ||
| Propionic Acid | ||
| Other Acidifiers | ||
| Animal | Aquaculture | Fish |
| Shrimp | ||
| Other Aquaculture Species | ||
| Poultry | Broiler | |
| Layer | ||
| Other Poultry Birds | ||
| Ruminants | Beef Cattle | |
| Dairy Cattle | ||
| Other Ruminants | ||
| Swine | ||
| Other Animals | ||
| Geography | United States | |
| Canada | ||
| Mexico | ||
| Rest of North America | ||


Market Definition
- FUNCTIONS - For the study, feed additives are considered to be commercially manufactured products that are used to enhance characteristics such as weight gain, feed conversion ratio, and feed intake when fed in appropriate proportions.
- RESELLERS - Companies engaged in reselling feed additives without value addition have been excluded from the market scope, to avoid double counting.
- END CONSUMERS - Compound feed manufacturers are considered to be end-consumers in the market studied. The scope excludes farmers buying feed additives to be used directly as supplements or premixes.
- INTERNAL COMPANY CONSUMPTION - Companies engaged in the production of compound feed as well as the manufacturing of feed additives are part of the study. However, while estimating the market sizes, the internal consumption of feed additives by such companies has been excluded.
| Keyword | Definition |
|---|---|
| Feed additives | Feed additives are products used in animal nutrition for purposes of improving the quality of feed and the quality of food from animal origin, or to improve the animals’ performance and health. |
| Probiotics | Probiotics are microorganisms introduced into the body for their beneficial qualities. (It maintains or restores beneficial bacteria to the gut). |
| Antibiotics | Antibiotic is a drug that is specifically used to inhibit the growth of bacteria. |
| Prebiotics | A non-digestible food ingredient that promotes the growth of beneficial microorganisms in the intestines. |
| Antioxidants | Antioxidants are compounds that inhibit oxidation, a chemical reaction that produces free radicals. |
| Phytogenics | Phytogenics are a group of natural and non-antibiotic growth promoters derived from herbs, spices, essential oils, and oleoresins. |
| Vitamins | Vitamins are organic compounds, which are required for normal growth and maintenance of the body. |
| Metabolism | A chemical process that occurs within a living organism in order to maintain life. |
| Amino acids | Amino acids are the building blocks of proteins and play an important role in metabolic pathways. |
| Enzymes | Enzyme is a substance that acts as a catalyst to bring about a specific biochemical reaction. |
| Anti-microbial resistance | The ability of a microorganism to resist the effects of an antimicrobial agent. |
| Anti-microbial | Destroying or inhibiting the growth of microorganisms. |
| Osmotic balance | It is a process of maintaining salt and water balance across membranes within the body's fluids. |
| Bacteriocin | Bacteriocins are the toxins produced by bacteria to inhibit the growth of similar or closely related bacterial strains. |
| Biohydrogenation | It is a process that occurs in the rumen of an animal in which bacteria convert unsaturated fatty acids (USFA) to saturated fatty acids (SFA). |
| Oxidative rancidity | It is a reaction of fatty acids with oxygen, which generally causes unpleasant odors in animals. To prevent these, antioxidants were added. |
| Mycotoxicosis | Any condition or disease caused by fungal toxins, mainly due to contamination of animal feed with mycotoxins. |
| Mycotoxins | Mycotoxins are toxin compounds that are naturally produced by certain types of molds (fungi). |
| Feed Probiotics | Microbial feed supplements positively affect gastrointestinal microbial balance. |
| Probiotic yeast | Feed yeast (single-cell fungi) and other fungi used as probiotics. |
| Feed enzymes | They are used to supplement digestive enzymes in an animal’s stomach to break down food. Enzymes also ensure that meat and egg production is improved. |
| Mycotoxin detoxifiers | They are used to prevent fungal growth and to stop any harmful mold from being absorbed in the gut and blood. |
| Feed antibiotics | They are used both for the prevention and treatment of diseases but also for rapid growth and development. |
| Feed antioxidants | They are used to protect the deterioration of other feed nutrients in the feed such as fats, vitamins, pigments, and flavoring agents, thus providing nutrient security to the animals. |
| Feed phytogenics | Phytogenics are natural substances, added to livestock feed to promote growth, aid in digestion, and act as anti-microbial agents. |
| Feed vitamins | They are used to maintain the normal physiological function and normal growth and development of animals. |
| Feed flavors and sweetners | These flavors and sweeteners help to mask tastes and odors during changes in additives or medications and make them ideal for animal diets undergoing transition. |
| Feed acidifiers | Animal feed acidifiers are organic acids incorporated into the feed for nutritional or preservative purposes. Acidifiers enhance congestion and microbiological balance in the alimentary and digestive tracts of livestock. |
| Feed minerals | Feed minerals play an important role in the regular dietary requirements of animal feed. |
| Feed binders | Feed binders are the binding agents used in the manufacture of safe animal feed products. It enhances the taste of food and prolongs the storage period of the feed. |
| Key Terms | Abbreviation |
| LSDV | Lumpy Skin Disease Virus |
| ASF | African Swine Fever |
| GPA | Growth Promoter Antibiotics |
| NSP | Non-Starch Polysaccharides |
| PUFA | Polyunsaturated Fatty Acid |
| Afs | Aflatoxins |
| AGP | Antibiotic Growth Promoters |
| FAO | The Food And Agriculture Organization of the United Nations |
| USDA | The United States Department of Agriculture |


Research Methodology
Mordor Intelligence follows a four-step methodology in all our reports.
- Step-1: IDENTIFY KEY VARIABLES: In order to build a robust forecasting methodology, the variables and factors identified in Step-1 are tested against available historical market numbers. Through an iterative process, the variables required for market forecast are set and the model is built on the basis of these variables.
- Step-2: Build a Market Model: Market-size estimations for the forecast years are in nominal terms. Inflation is not a part of the pricing, and the average selling price (ASP) is kept constant throughout the forecast period.
- Step-3: Validate and Finalize: In this important step, all market numbers, variables and analyst calls are validated through an extensive network of primary research experts from the market studied. The respondents are selected across levels and functions to generate a holistic picture of the market studied.
- Step-4: Research Outputs: Syndicated Reports, Custom Consulting Assignments, Databases & Subscription Platforms


