Market Overview
| Study Period | 2018 - 2031 |
|---|---|
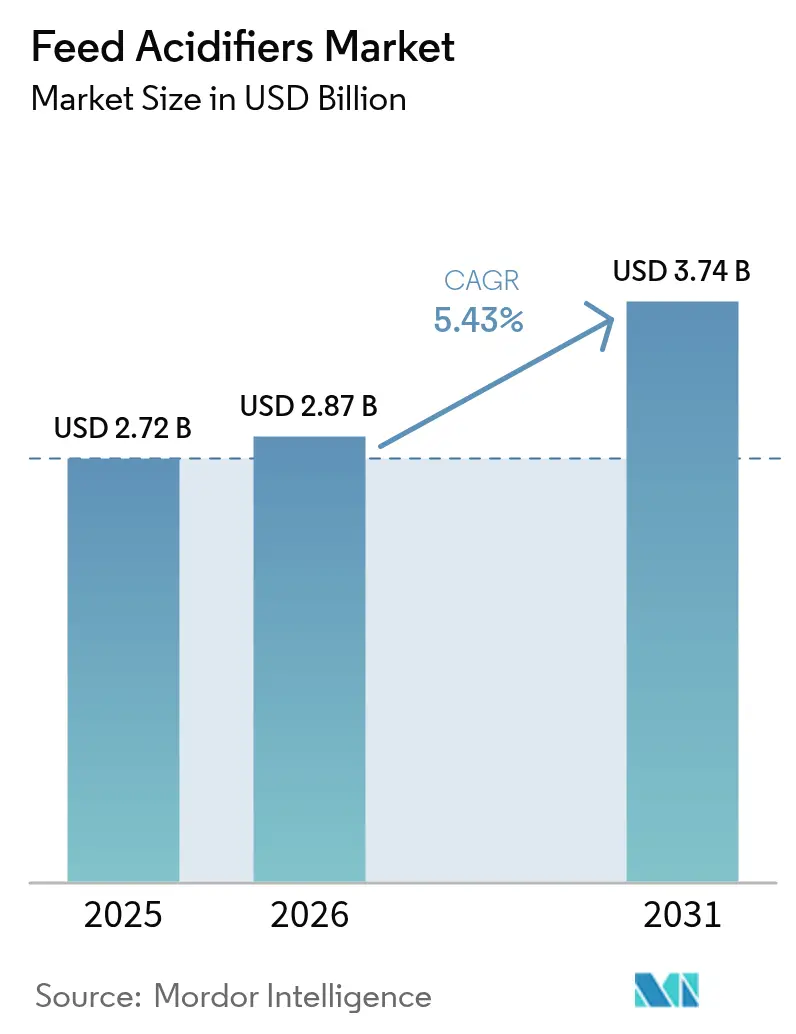
| Market Size (2026) | USD 2.87 Billion |
| Market Size (2031) | USD 3.74 Billion |
| Growth Rate (2026 - 2031) | 5.43% CAGR |
| Fastest Growing Market | North America |
| Largest Market | Asia-Pacific |
| Market Concentration | Medium |
Major Players *Disclaimer: Major Players sorted in no particular order Image © Mordor Intelligence. Reuse requires attribution under CC BY 4.0. | |
Feed Acidifiers Market Analysis by Mordor Intelligence
The feed acidifiers market size is expected to grow from USD 2.72 billion in 2025 to USD 2.87 billion in 2026 and is forecast to reach USD 3.74 billion by 2031 at 5.43% CAGR over 2026-2031. This expansion is tied to regulatory curbs on antibiotic growth promoters, rising protein demand across Asia, pressure to curb livestock greenhouse-gas intensity, and sustained venture funding for next-generation gut-health technologies. Producers are responding with coated organic-acid blends that safeguard intestinal release, while grain handlers deploy propionic acid to counter climate-driven mycotoxin spikes. Competitive dynamics favor suppliers that combine technical support with precision dosing systems, especially in export-oriented value chains where carbon-footprint audits reward feed-efficiency gains. Robust capital inflows into postbiotic platforms further signal a multi-year innovation cycle that will reinforce the feed acidifiers market trajectory.
Key Report Takeaways
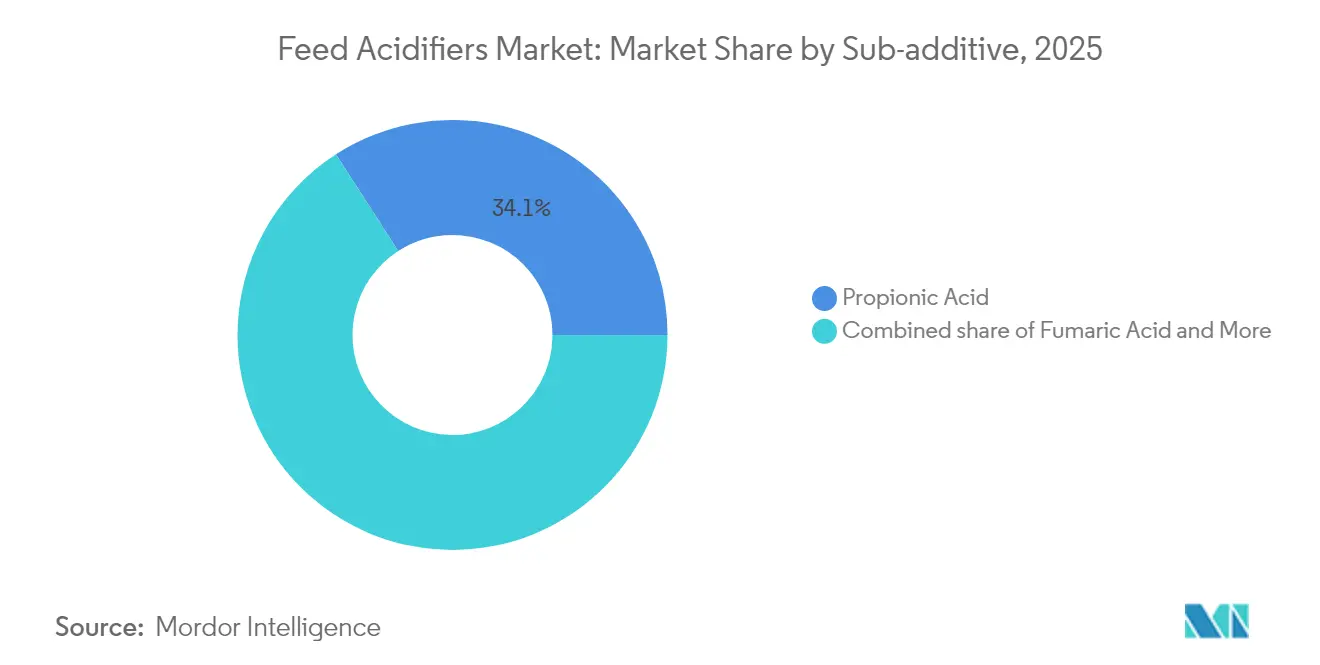
- By sub-additive, propionic acid held 34.12% of the feed acidifiers market share in 2025, and is projected to grow at a 5.61% CAGR through 2031.
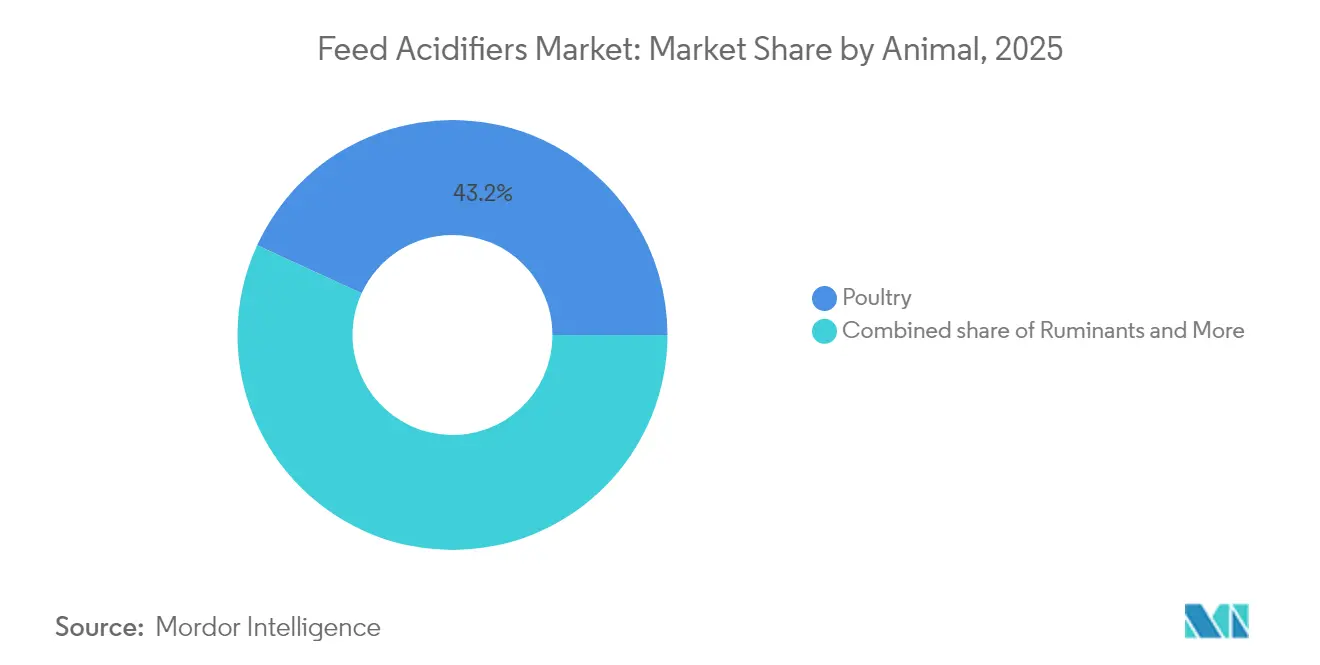
- By animal, poultry led with 43.15% share of the feed acidifiers market in 2025; ruminants are advancing at a 5.63% CAGR through 2031.
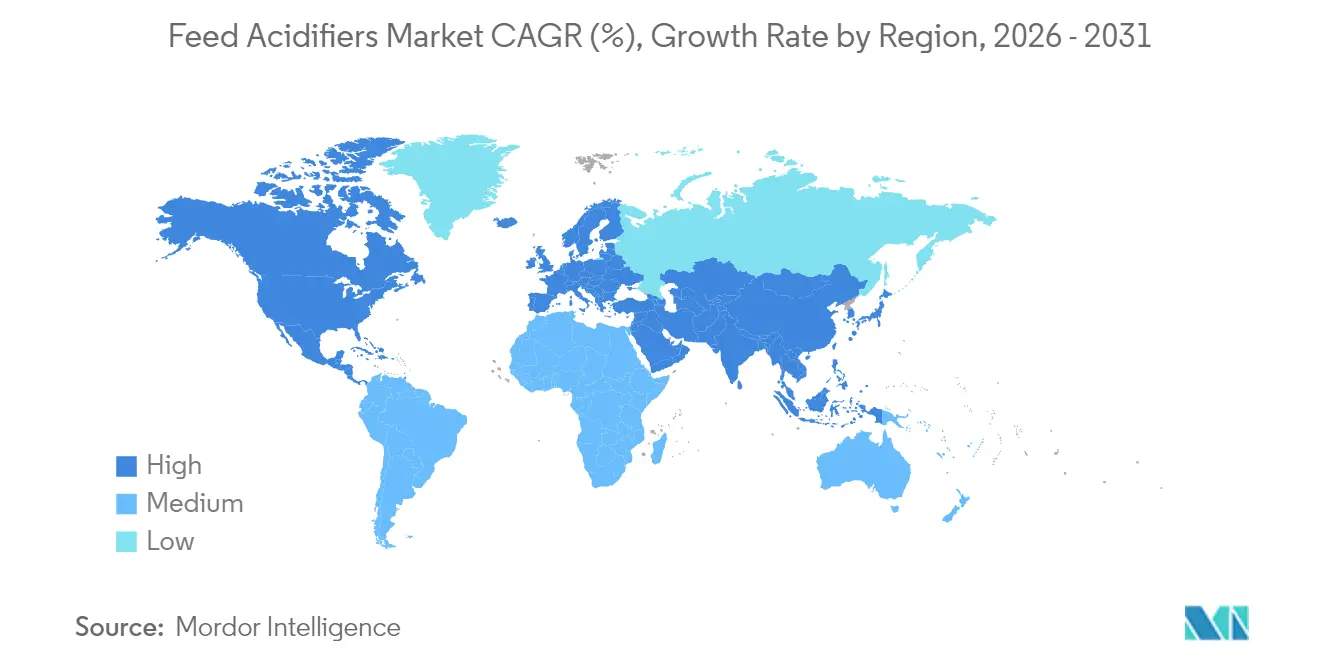
- By geography, Asia-Pacific dominated revenue with a 30.94% share in 2025, and North America is forecast to post the fastest 5.29% CAGR over the outlook period.
Note: Market size and forecast figures in this report are generated using Mordor Intelligence’s proprietary estimation framework, updated with the latest available data and insights as of 2026.
Global Feed Acidifiers Market Trends and Insights
Drivers Impact Analysis*
| Driver | (~) % Impact on CAGR Forecast | Geographic Relevance | Impact Timeline |
|---|---|---|---|
| Antibiotic bans in major livestock-producing countries | +1.2% | Global, with strongest impact in North America, European Union, and China | Medium term (2-4 years) |
| Rapid intensification of Asian poultry and aquaculture sectors | +1.0% | Asia-Pacific core, spill-over to Middle East and Africa | Long term (≥ 4 years) |
| Rising demand for mycotoxin-free compound feed | +0.8% | Global, with elevated impact in South America and Asia-Pacific | Short term (≤ 2 years) |
| Expansion of coated/encapsulated acid delivery technologies | +0.6% | North America and Europe leading, Asia-Pacific adoption accelerating | Medium term (2-4 years) |
| Carbon-footprint labeling pressure on animal-protein exporters | +0.5% | Europe and North America primary, extending to export-oriented South America | Long term (≥ 4 years) |
| Surging venture funding for post-biotics and acidifier blends | +0.4% | North America and Europe concentrated, with Asia-Pacific emerging | Medium term (2-4 years) |
| Source: Mordor Intelligence | |||
Antibiotic Bans In Major Livestock-Producing Countries
Regulatory restrictions on antibiotic growth promoters have fundamentally altered livestock production economics, creating sustained demand for organic acid alternatives that maintain performance without regulatory compliance risks. The FDA's Veterinary Feed Directive implementation and China's comprehensive antibiotic restrictions have eliminated approximately 70% of traditional growth promotion pathways, forcing producers to adopt acidifier-based gut. European markets demonstrate the most mature acidifier adoption patterns, with propionic and formic acid inclusion rates increasing 40% since antibiotic restrictions took effect. The regulatory momentum extends beyond established markets, with Thailand implementing similar restrictions in 2024 and Brazil advancing antibiotic reduction frameworks, suggesting sustained global expansion of acidifier-dependent production systems through the forecast period.
Rapid intensification of Asian poultry and aquaculture sectors
Vertical integration trends across Asian protein value chains are driving systematic adoption of acidifier technologies as producers seek to optimize feed conversion ratios and reduce pathogen pressure in high-density operations. China's poultry sector expansion, supported by government policies promoting domestic protein self-sufficiency, has increased acidifier consumption by an estimated 25% annually since 2024. Thailand's poultry industry, despite facing avian influenza challenges, continues investing in gut health solutions that include organic acid supplementation to maintain export competitiveness. The aquaculture segment shows particularly strong acidifier adoption, with intensive fish farming operations in Vietnam and Indonesia implementing formic acid-based pathogen control systems that improve survival rates while meeting export market food safety standards.
Rising demand for mycotoxin-free compound feed
Extreme weather patterns linked to climate change are intensifying mycotoxin contamination risks in stored grain, creating urgent demand for propionic acid-based preservation systems that maintain feed quality throughout extended storage periods. The 2024 growing season witnessed elevated aflatoxin levels across key grain-producing regions, with corn mycotoxin contamination exceeding regulatory thresholds in 15% of tested samples compared to historical averages of 8%. Feed mills are responding by increasing propionic acid inclusion rates and implementing dual-application strategies that combine storage preservation with in-feed acidification. This trend particularly benefits specialized acidifier suppliers who can provide technical support for optimized application rates that balance preservation efficacy with palatability constraints, as mycotoxin management becomes a competitive differentiator in feed quality assurance programs. [1]Source: USDA, “Mycotoxin Profiles in U.S. Corn 2024,” usda.gov
Expansion of coated/encapsulated acid delivery technologies
Advanced coating and encapsulation systems are revolutionizing acidifier efficacy by enabling precise release profiles that maximize intestinal activity while minimizing gastric degradation and equipment corrosion concerns. Kemin's FORMYL Na represents this technological evolution, utilizing proprietary encapsulation to deliver formic acid directly to target intestinal sites where pathogen control is most critical. The technology addresses a fundamental limitation of traditional acidifier applications, where significant acid activity is lost in the upper gastrointestinal tract before reaching sites of maximum benefit. Patent activity in this space has accelerated, with coating technologies achieving acid protection at temperatures exceeding 80°C during pelleting processes, enabling acidifier inclusion in high-temperature feed processing systems previously incompatible with organic acid supplementation.[2]Source: Kemin Industries, “FORMYL Na Heat Stable Formic Acid,” kemin.com
Restraints Impact Analysis*
| Restraint | (~) % Impact on CAGR Forecast | Geographic Relevance | Impact Timeline |
|---|---|---|---|
| Volatility in organic-acid input prices (methanol, CO) | -0.8% | Global, with strongest impact in regions with limited petrochemical integration | Short term (≤ 2 years) |
| Palatability issues at higher inclusion rates | -0.6% | Global, with particular challenges in premium feed segments | Medium term (2-4 years) |
| Corrosion concerns in legacy feed-mill equipment | -0.5% | Concentrated in regions with older feed mill infrastructure | Medium term (2-4 years) |
| Regulatory uncertainty on maximum inclusion limits | -0.4% | Export-oriented markets with multiple regulatory jurisdictions | Long term (≥ 4 years) |
| Source: Mordor Intelligence | |||
Volatility in organic-acid input prices (methanol, CO)
Methanol and carbon monoxide feedstock price fluctuations directly impact propionic and formic acid production costs, creating margin pressure that limits acidifier adoption in price-sensitive feed segments. Methanol prices reached USD 400 per metric ton in early 2024 before declining to USD 320 per metric ton by year-end, representing volatility that translates to 15-20% swings in finished acidifier costs. This volatility particularly affects smaller feed mills with limited hedging capabilities and constrains acidifier inclusion in commodity feed applications where cost sensitivity is highest. Producers are responding by developing longer-term supply contracts and exploring alternative feedstock sources, but input cost volatility remains a structural challenge that limits market penetration in cost-conscious segments.
Palatability issues at higher inclusion rates
Organic acids' inherent bitter taste and astringent properties create palatability challenges that restrict inclusion rates, particularly in finisher feeds where animals approach market weight and feed intake optimization is critical for economic returns. Research indicates that formic acid inclusion above 0.8% significantly reduces voluntary feed intake in growing pigs, while propionic acid applications exceeding 1.2% create similar palatability issues in poultry feeds. Feed formulators are addressing these constraints through flavor masking technologies and encapsulation systems that reduce immediate taste impact, but palatability remains a fundamental limitation that prevents acidifiers from achieving optimal inclusion rates for maximum pathogen control and performance benefits.
*Our forecasts treat driver/restraint impacts as directional, not additive. The impact forecasts reflect baseline growth, mix effects, and variable interactions.
Segment Analysis
By Sub Additive: Propionic Acid Holds Leadership and Accelerates
In 2025, propionic acid commanded a 34.12% share of the feed acidifiers market and emerged as the fastest-growing segment, boasting a CAGR of 5.61%. This growth underscores its dual utility as both a preservative and a promoter of gut health. Major players like BASF and Perstorp, with their expansive capacities, ensure a consistent supply—an assurance that's especially valued during mycotoxin crises. Meanwhile, lactic acid is gaining traction in aquaculture diets, where its buffering properties enhance enzyme activity. Other acids, including citric and benzoic, are being utilized in premium feed lines, specifically targeting certain pathogen profiles.
Ongoing patent filings in coating science, coupled with the trend of bundling propionic acid with mold inhibitors, highlight suppliers' efforts to cement propionic's market dominance. However, formic acid is gaining attention due to its broader antimicrobial spectrum and reduced dosage requirements. These attributes resonate with sustainability goals, leading to investments in pilot plants that harness captured carbon dioxide as a feedstock. In both segments, the ability to customize dosage based on regional grain types will be pivotal in determining market share dynamics.


By Animal: Poultry Leads but Ruminants Sets the Pace
Poultry commanded 43.15% of global demand in 2025, underscoring acidifier efficacy in high-density broiler and layer houses where Salmonella and Campylobacter control is critical. Feed conversion gains of 2-3 points translate into rapid payback, ensuring sustained inclusion. Ruminant, with a forecast of 5.63% CAGR usage centers on calf starters and transition-cow diets where rumen buffering confines acid efficacy to specific windows. Aquaculture, sits at the intersection of rising fish protein demand and stringent antibiotic curbs in export markets. Formic and lactic acids delivered via coated particles improve water stability and suppress Vibrio outbreaks in shrimp ponds.
Swine producers maintain steady uptake as acidifier programs trim post-weaning diarrhea, yet inclusion ceilings linked to palatability moderate volume growth. Companion animal formulations emerge as a boutique segment leveraging clean-label preservation claims to command premium margins.
Geography Analysis
Asia-Pacific held the largest regional share in 2025 with 30.94%, powered by China’s pursuit of protein self-sufficiency, Thailand’s export-oriented broiler sector, and Indonesia’s expanding shrimp and tilapia ponds. Regional regulators mirrored the European antibiotic bans, prompting integrators to embed acidifiers into standard feed protocols. Japan and South Korea, though mature, buy specialized encapsulated blends that align with animal welfare and sustainability branding.
North America is projected to deliver the quickest 5.29% CAGR. The North America feed acidifiers market demonstrates strong market fundamentals, encompassing the United States, Canada, and Mexico. The region's market is characterized by advanced feed technology adoption and a strong emphasis on animal nutrition. The United States emerges as both the largest and fastest-growing market in the region, driven by its extensive livestock industry, advanced feed production capabilities, and increasing focus on feed efficiency and animal health.
In South America, Brazilian poultry and swine farms incorporate acidifiers to protect performance amid hotter climates and frequent mycotoxin challenges. Argentina’s feedlots adopt propionic acid to extend grain storage during volatile harvest cycles, while Chile’s salmon cages deploy water-stable acids to counter SRS pathogen loads. Regional governments also lean on acidifiers to meet European residue thresholds, reinforcing adoption momentum.
Europe remains a steady-growth market where acidifiers have been routine since the 2006 antibiotic ban. Current demand upside stems from the Carbon Border Adjustment Mechanism, which monetizes feed-efficiency gains. Germany, France, and the Netherlands are upgrading to precision dosing and post-pelleting application that maximize acid impact. The Middle East and Africa, though smaller, register rising demand in large broiler complexes across Saudi Arabia and Egypt, while South Africa’s integrated feed mills test coated acids in dairy formulations.

Competitive Landscape
Top suppliers BASF, Cargill, and DSM-Firmenich collectively held about 30% of 2024 sales, signifying a moderately concentrated arena. Scale advantages include captive organic-acid capacity, global regulatory dossiers, and embedded technical-service teams that help integrators optimize inclusion. Cargill strengthened U.S. mill capacity through two site acquisitions in 2024, expanding reach into ranching and pet channels.[3]Source: Cargill, “Acquisition of Compana Feed Mills,” cargill.com
Mid-tier innovators emphasize encapsulation and hybrid postbiotic blends to carve niches. Kemin’s patented heat-stable formic acid drives poultry wins, and Perstorp pilots circular-carbon propionic acid. Venture-backed entrants such as BiomEdit harness synthetic biology to deliver in-situ organic-acid production, which could disrupt traditional supply chains if cost parity is achieved. Meanwhile, equipment builders partner with acid suppliers to offer turnkey liquid-dosing retrofits, tightening vendor lock-in.
Regulatory stewardship is a decisive differentiator. Firms with real-time residue analytics help exporters navigate divergent inclusion limits across the EU, the United States, and Asia. Patent litigation in coating chemistry signals escalating barriers to entry, yet regional specialists exploiting local grain profiles continue to secure share via customized blends. Overall, the feed acidifiers industry balances global giants with agile innovators, sustaining competitive dynamism.
Feed Acidifiers Industry Leaders
Adisseo
BASF SE
Cargill Inc.
DSM Nutritional Products AG
SHV (Nutreco NV)
- *Disclaimer: Major Players sorted in no particular order


Recent Industry Developments
- January 2025: Novus International and Resilient Biotics launched a three-year co-development pact to create swine respiratory and immune health solutions that blend microbiome analytics with targeted nutrition platforms, aiming to curb costly respiratory disease losses
- September 2024: Cargill acquired two feed mills in Denver, Colorado and Kansas City, Kansas to expand production and modernize a flagship site that will serve livestock and pet customers with advanced nutrition lines.
- August 2024: Fonterra and Superbrewed Food entered a multi-year partnership to explore postbiotic protein ingredients sourced from bacterial biomass using lactose permeate, targeting high-protein additive applications with robust pH stability


Global Feed Acidifiers Market Report Scope
Sub Additive
| Lactic Acid |
| Propionic Acid |
| Fumaric Acid |
| Other Acidifiers |
Animal
| Aquaculture | By Sub Animal | Fish |
| Shrimp | ||
| Other Aquaculture Species | ||
| Poultry | By Sub Animal | Broiler |
| Layer | ||
| Other Poultry Birds | ||
| Ruminants | By Sub Animal | Beef Cattle |
| Dairy Cattle | ||
| Other Ruminants | ||
| Swine | ||
| Other Animals |
Region
| Africa | By Country | Egypt |
| Kenya | ||
| South Africa | ||
| Rest of Africa | ||
| Asia-Pacific | By Country | Australia |
| China | ||
| India | ||
| Indonesia | ||
| Japan | ||
| Philippines | ||
| South Korea | ||
| Thailand | ||
| Vietnam | ||
| Rest of Asia-Pacific | ||
| Europe | By Country | France |
| Germany | ||
| Italy | ||
| Netherlands | ||
| Russia | ||
| Spain | ||
| Turkey | ||
| United Kingdom | ||
| Rest of Europe | ||
| Middle East | By Country | Iran |
| Saudi Arabia | ||
| Rest of Middle East | ||
| North America | By Country | Canada |
| Mexico | ||
| United States | ||
| Rest of North America | ||
| South America | By Country | Argentina |
| Brazil | ||
| Chile | ||
| Rest of South America |
| Sub Additive | Lactic Acid | ||
| Propionic Acid | |||
| Fumaric Acid | |||
| Other Acidifiers | |||
| Animal | Aquaculture | By Sub Animal | Fish |
| Shrimp | |||
| Other Aquaculture Species | |||
| Poultry | By Sub Animal | Broiler | |
| Layer | |||
| Other Poultry Birds | |||
| Ruminants | By Sub Animal | Beef Cattle | |
| Dairy Cattle | |||
| Other Ruminants | |||
| Swine | |||
| Other Animals | |||
| Region | Africa | By Country | Egypt |
| Kenya | |||
| South Africa | |||
| Rest of Africa | |||
| Asia-Pacific | By Country | Australia | |
| China | |||
| India | |||
| Indonesia | |||
| Japan | |||
| Philippines | |||
| South Korea | |||
| Thailand | |||
| Vietnam | |||
| Rest of Asia-Pacific | |||
| Europe | By Country | France | |
| Germany | |||
| Italy | |||
| Netherlands | |||
| Russia | |||
| Spain | |||
| Turkey | |||
| United Kingdom | |||
| Rest of Europe | |||
| Middle East | By Country | Iran | |
| Saudi Arabia | |||
| Rest of Middle East | |||
| North America | By Country | Canada | |
| Mexico | |||
| United States | |||
| Rest of North America | |||
| South America | By Country | Argentina | |
| Brazil | |||
| Chile | |||
| Rest of South America | |||


Market Definition
- FUNCTIONS - For the study, feed additives are considered to be commercially manufactured products that are used to enhance characteristics such as weight gain, feed conversion ratio, and feed intake when fed in appropriate proportions.
- RESELLERS - Companies engaged in reselling feed additives without value addition have been excluded from the market scope, to avoid double counting.
- END CONSUMERS - Compound feed manufacturers are considered to be end-consumers in the market studied. The scope excludes farmers buying feed additives to be used directly as supplements or premixes.
- INTERNAL COMPANY CONSUMPTION - Companies engaged in the production of compound feed as well as the manufacturing of feed additives are part of the study. However, while estimating the market sizes, the internal consumption of feed additives by such companies has been excluded.
| Keyword | Definition |
|---|---|
| Feed additives | Feed additives are products used in animal nutrition for purposes of improving the quality of feed and the quality of food from animal origin, or to improve the animals’ performance and health. |
| Probiotics | Probiotics are microorganisms introduced into the body for their beneficial qualities. (It maintains or restores beneficial bacteria to the gut). |
| Antibiotics | Antibiotic is a drug that is specifically used to inhibit the growth of bacteria. |
| Prebiotics | A non-digestible food ingredient that promotes the growth of beneficial microorganisms in the intestines. |
| Antioxidants | Antioxidants are compounds that inhibit oxidation, a chemical reaction that produces free radicals. |
| Phytogenics | Phytogenics are a group of natural and non-antibiotic growth promoters derived from herbs, spices, essential oils, and oleoresins. |
| Vitamins | Vitamins are organic compounds, which are required for normal growth and maintenance of the body. |
| Metabolism | A chemical process that occurs within a living organism in order to maintain life. |
| Amino acids | Amino acids are the building blocks of proteins and play an important role in metabolic pathways. |
| Enzymes | Enzyme is a substance that acts as a catalyst to bring about a specific biochemical reaction. |
| Anti-microbial resistance | The ability of a microorganism to resist the effects of an antimicrobial agent. |
| Anti-microbial | Destroying or inhibiting the growth of microorganisms. |
| Osmotic balance | It is a process of maintaining salt and water balance across membranes within the body's fluids. |
| Bacteriocin | Bacteriocins are the toxins produced by bacteria to inhibit the growth of similar or closely related bacterial strains. |
| Biohydrogenation | It is a process that occurs in the rumen of an animal in which bacteria convert unsaturated fatty acids (USFA) to saturated fatty acids (SFA). |
| Oxidative rancidity | It is a reaction of fatty acids with oxygen, which generally causes unpleasant odors in animals. To prevent these, antioxidants were added. |
| Mycotoxicosis | Any condition or disease caused by fungal toxins, mainly due to contamination of animal feed with mycotoxins. |
| Mycotoxins | Mycotoxins are toxin compounds that are naturally produced by certain types of molds (fungi). |
| Feed Probiotics | Microbial feed supplements positively affect gastrointestinal microbial balance. |
| Probiotic yeast | Feed yeast (single-cell fungi) and other fungi used as probiotics. |
| Feed enzymes | They are used to supplement digestive enzymes in an animal’s stomach to break down food. Enzymes also ensure that meat and egg production is improved. |
| Mycotoxin detoxifiers | They are used to prevent fungal growth and to stop any harmful mold from being absorbed in the gut and blood. |
| Feed antibiotics | They are used both for the prevention and treatment of diseases but also for rapid growth and development. |
| Feed antioxidants | They are used to protect the deterioration of other feed nutrients in the feed such as fats, vitamins, pigments, and flavoring agents, thus providing nutrient security to the animals. |
| Feed phytogenics | Phytogenics are natural substances, added to livestock feed to promote growth, aid in digestion, and act as anti-microbial agents. |
| Feed vitamins | They are used to maintain the normal physiological function and normal growth and development of animals. |
| Feed flavors and sweetners | These flavors and sweeteners help to mask tastes and odors during changes in additives or medications and make them ideal for animal diets undergoing transition. |
| Feed acidifiers | Animal feed acidifiers are organic acids incorporated into the feed for nutritional or preservative purposes. Acidifiers enhance congestion and microbiological balance in the alimentary and digestive tracts of livestock. |
| Feed minerals | Feed minerals play an important role in the regular dietary requirements of animal feed. |
| Feed binders | Feed binders are the binding agents used in the manufacture of safe animal feed products. It enhances the taste of food and prolongs the storage period of the feed. |
| Key Terms | Abbreviation |
| LSDV | Lumpy Skin Disease Virus |
| ASF | African Swine Fever |
| GPA | Growth Promoter Antibiotics |
| NSP | Non-Starch Polysaccharides |
| PUFA | Polyunsaturated Fatty Acid |
| Afs | Aflatoxins |
| AGP | Antibiotic Growth Promoters |
| FAO | The Food And Agriculture Organization of the United Nations |
| USDA | The United States Department of Agriculture |


Research Methodology
Mordor Intelligence follows a four-step methodology in all our reports.
- Step-1: IDENTIFY KEY VARIABLES: In order to build a robust forecasting methodology, the variables and factors identified in Step-1 are tested against available historical market numbers. Through an iterative process, the variables required for market forecast are set and the model is built on the basis of these variables.
- Step-2: Build a Market Model: Market-size estimations for the forecast years are in nominal terms. Inflation is not a part of the pricing, and the average selling price (ASP) is kept constant throughout the forecast period.
- Step-3: Validate and Finalize: In this important step, all market numbers, variables and analyst calls are validated through an extensive network of primary research experts from the market studied. The respondents are selected across levels and functions to generate a holistic picture of the market studied.
- Step-4: Research Outputs: Syndicated Reports, Custom Consulting Assignments, Databases & Subscription Platforms


