Market Overview
| Study Period | 2021 - 2031 |
|---|---|
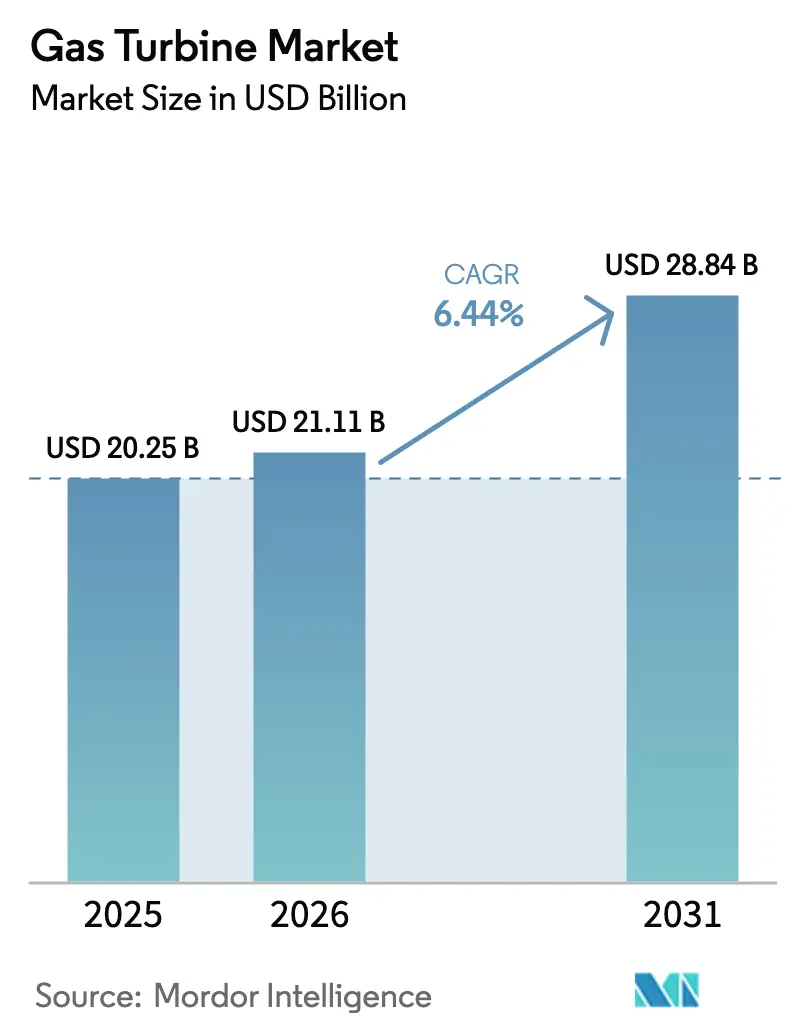
| Market Size (2026) | USD 21.11 Billion |
| Market Size (2031) | USD 28.84 Billion |
| Growth Rate (2026 - 2031) | 6.44% CAGR |
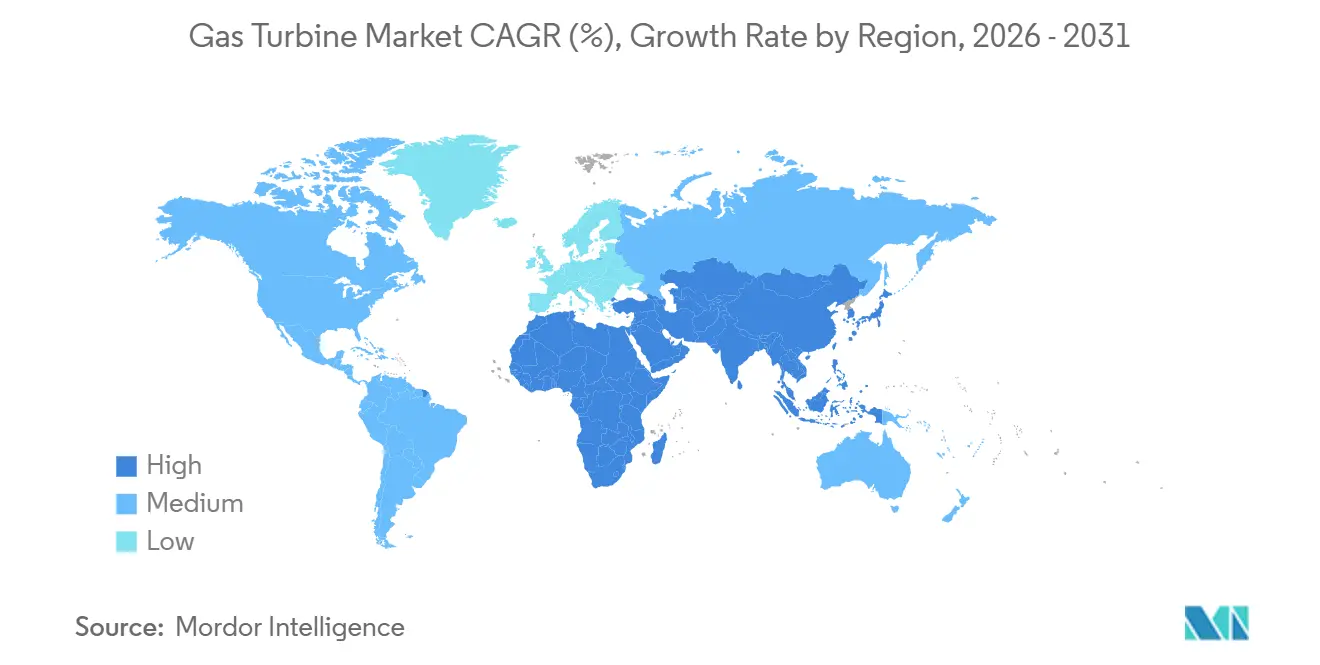
| Fastest Growing Market | Asia-Pacific |
| Largest Market | Asia-Pacific |
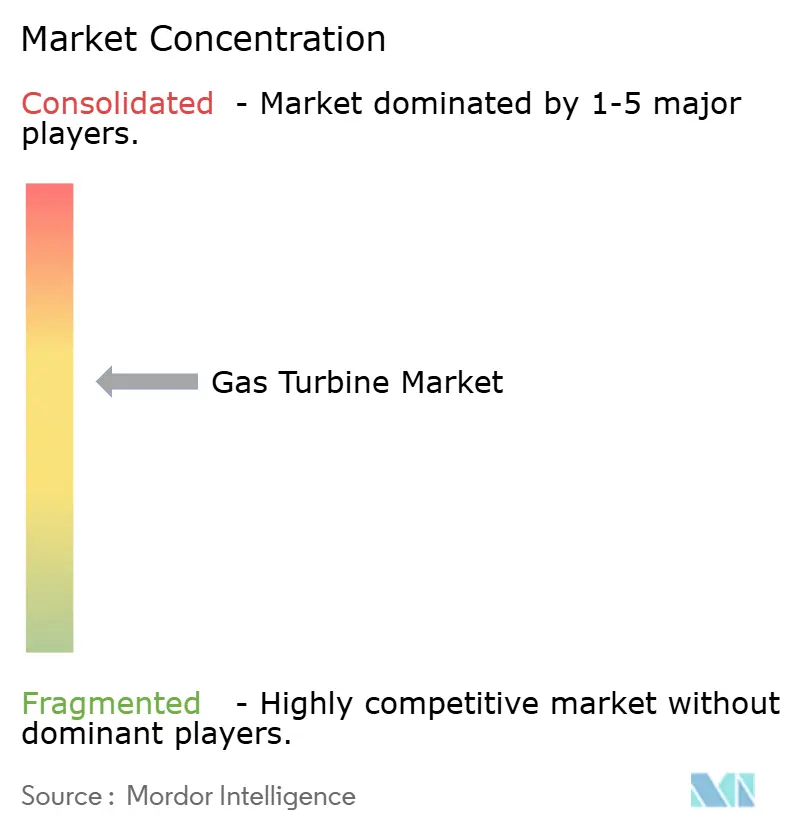
| Market Concentration | Medium |
Major Players *Disclaimer: Major Players sorted in no particular order Image © Mordor Intelligence. Reuse requires attribution under CC BY 4.0. | |
Gas Turbine Market Analysis by Mordor Intelligence
The Gas Turbine Market size is projected to expand from USD 20.25 billion in 2025 and USD 21.11 billion in 2026 to USD 28.84 billion by 2031, registering a CAGR of 6.44% between 2026 to 2031.
Structural shifts are accelerating demand as Asia-Pacific utilities pivot from coal to gas, petrochemical complexes embed cogeneration at the design stage, and island grids adopt mobile aeroderivative sets that avoid lengthy permitting. Hydrogen-readiness mandates are also steering procurement toward turbines capable of burning alternative fuels, while OEMs are increasing digital-twin deployments that boost efficiency by 2% to 3%. Competitive strategies now revolve around certifying 100% hydrogen combustion, shortening lead times for hot-gas-path components, and expanding long-term service agreements that lock in recurring revenue. These trends collectively support sustained capacity additions even as battery storage challenges peaking assets in deregulated markets.
Key Report Takeaways
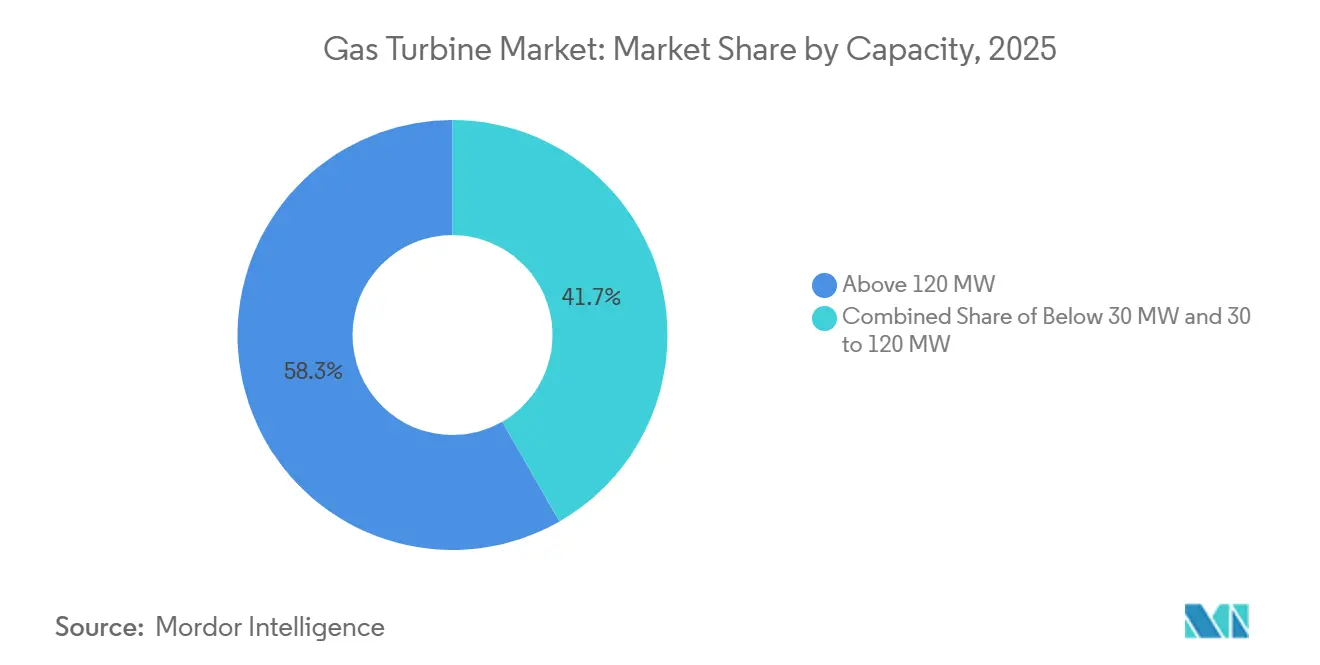
- By capacity, the above 120 MW segment led with 58.3% of gas turbine market share in 2025, while the 30-120 MW band is projected to expand at a 6.8% CAGR to 2031.
- By operating cycle, combined-cycle plants accounted for 74.9% of installations in 2025 and are forecast to post a 7% CAGR through 2031.
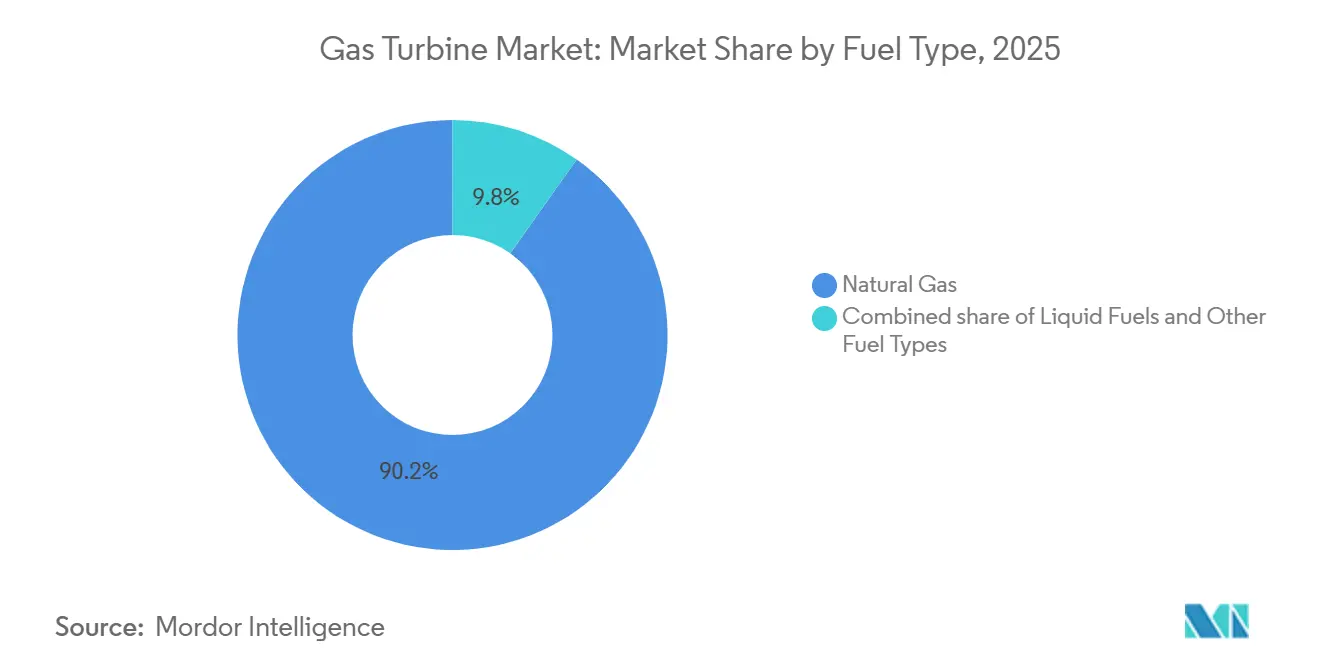
- By fuel type, natural gas captured 90.2% share of the 2025 gas turbine market size; hydrogen and other alternative fuels are set to rise 16.1% annually from 2026 to 2031.
- By end-user, power generation held 69.8% of the 2025 total, with the sector expanding 6.9% yearly.
- By geography, Asia-Pacific commanded 59.5% of 2025 revenues and is advancing at a 7.3% CAGR, the fastest worldwide.
Note: Market size and forecast figures in this report are generated using Mordor Intelligence’s proprietary estimation framework, updated with the latest available data and insights as of January 2026.
Global Gas Turbine Market Trends and Insights
Drivers Impact Analysis*
| Driver | (~) % Impact on CAGR Forecast | Geographic Relevance | Impact Timeline |
|---|---|---|---|
| Asia-Pacific Coal-to-Gas Transition Accelerating Utility Orders | +1.8% | APAC core (China, India, ASEAN), spill-over to South Asia | Medium term (2-4 years) |
| LNG-linked Island Grids in SEA Driving Mobile Aeroderivative Demand | +1.2% | Southeast Asia, Caribbean, Pacific Islands | Short term (≤ 2 years) |
| Petrochemical Cogeneration Build-out in Middle East | +1.5% | Middle East (Saudi Arabia, UAE, Qatar), North Africa | Medium term (2-4 years) |
| Disaster-Relief Leasing Surge for Aeroderivative Sets in Caribbean | +0.7% | Caribbean, Central America, disaster-prone coastal regions | Short term (≤ 2 years) |
| Source: Mordor Intelligence | |||


Asia-Pacific Coal-to-Gas Transition Accelerating Utility Orders
Large-scale conversions from coal to gas are driving record turbine procurement. Malaysia awarded a 1,400 MW combined-cycle contract in 2024, and Vietnam commissioned more than 2,700 MW of LNG-to-power capacity in 2025. China cleared 12 GW of new gas capacity in 2025 to complement intermittent renewables, with domestic OEMs winning the bulk of orders. Thailand signed a 5,300 MW framework that specifies hydrogen-ready units capable of 30% blends. Singapore brought a 670 MW hydrogen-capable plant online in 2025, strengthening the city-state’s decarbonization pathway.[1]Editorial Board, “Hydrogen-Ready Turbines Gain Traction,” ft.com
LNG-Linked Island Grids in SEA Driving Mobile Aeroderivative Demand
Island grids are fast-tracking mobile aeroderivative sets to avoid expensive fixed infrastructure. The Bahamas restored post-hurricane supply with four TM2500 units in 2024, leased under 72-hour redeployment clauses. Indonesia’s PLN ordered 20 similar units in 2025 for scattered mining and agro-processing hubs. Puerto Rico and several Caribbean nations adopted multi-year leasing pools that integrate rental, fuel logistics, and O&M in single contracts, compressing timelines from three years to under one.
Petrochemical Cogeneration Build-out in Middle East
Greenfield petrochemical complexes are embedding cogeneration from day one. Saudi Aramco added 475 MW of capacity at SATORP in 2024, achieving 85% CHP efficiency. ADNOC ordered 1,200 MW of turbines in 2025 to supply steam and power under a 25-year tolling structure. Qatar Energy’s North Field expansion adopted a multi-OEM sourcing model that spreads technology risk and accelerates delivery.
Disaster-Relief Leasing Surge for Aeroderivative Sets in Caribbean
Climate-driven outages have made sub-24-hour mobilization a procurement prerequisite. Puerto Rico leased 360 MW of aeroderivative turbines in 2024 under contracts allowing redeployment to neighboring islands within two days. The Bahamas and the Dominican Republic structured regional “turbine-sharing pools,” while Haiti restored 80 MW of capacity with World Bank-backed leases in 2025.
Restraints Impact Analysis*
| Restraint | (~) % Impact on CAGR Forecast | Geographic Relevance | Impact Timeline |
|---|---|---|---|
| Gas-price Volatility Post-Ukraine War Curtailing EU Projects | -0.9% | Europe (Germany, UK, Italy, Spain), Eastern Europe | Medium term (2-4 years) |
| Utility-scale Battery Storage Displacing Peaking Turbines (US/Australia) | -1.1% | North America (US, Canada), Australia, select EU markets | Short term (≤ 2 years) |
| ESG-driven Financing Restrictions under EU Taxonomy | -0.6% | European Union, UK, select institutional investors globally | Long term (≥ 4 years) |
| Super-alloy Supply-Chain Shortages for Large-Frame Hot-gas-path Parts | -0.8% | Global, acute in North America and Europe | Medium term (2-4 years) |
| Source: Mordor Intelligence | |||
Gas-Price Volatility Post-Ukraine War Curtailing EU Projects
Persistent gas-price swings are eroding project economics. Germany’s RWE delayed 1,800 MW of projects in 2024, and Italy’s Enel withdrew a 1,200 MW plant in 2025 after failing to secure PPAs above EUR 80 per MWh. Spain redirected capital to batteries, while the UK capacity market cleared at lower prices as imports rose.
ESG-Driven Financing Restrictions under EU Taxonomy
The European Investment Bank rejected EUR 2.3 billion of gas projects in 2024 for failing to meet emissions limits, and Germany’s KfW withdrew from a 900 MW loan in 2025 without a carbon-capture commitment.[2]European Investment Bank, “2024 Annual Report,” eib.org Sixty percent of institutional investors now exclude unabated gas, cutting the available capital pool by GBP 15 billion.
*Our forecasts treat driver/restraint impacts as directional, not additive. The impact forecasts reflect baseline growth, mix effects, and variable interactions.
Segment Analysis
By Capacity: Mid-Range Units Capture Modular Demand
Mid-range turbines between 30 and 120 MW recorded the fastest growth at a 6.8% CAGR through 2031, reflecting demand for modular projects that avoid multi-year permitting. Above 120 MW machines still represented 58.3% of 2025 installations, but grid-connection bottlenecks and environmental reviews are tempering new orders. The gas turbine market size for the 30 to 120 MW bracket is expected to surpass USD 18 billion by 2031, underpinned by fast-track approvals in Southeast Asia. Regulatory fast-track schemes, such as the Philippines’ nine-month permitting window for sub-100 MW plants, underline this momentum.
Project sponsors prefer mid-range sets for incremental expansion. GE’s LM6000 secured 18 orders in 2024, citing 12-month delivery schedules.[3]GE Vernova, “Investor Presentation 2024,” ge.com Siemens Energy’s SGT-400 continues to dominate emergency back-up throughout the Caribbean disaster-relief segment. Large-frame developments still proceed in Asia-Pacific, but developers increasingly split capacity into multiple 120 MW blocks to mitigate construction risk and align with financing milestones.


By Operating Cycle: Combined Cycle Dominates Efficiency Race
Combined-cycle plants controlled 74.9% of the gas turbine market share in 2025 and are forecast to grow at a 7% CAGR to 2031. The gas turbine market size accruing to combined-cycle configurations is projected to add USD 21 billion between 2026 and 2031 as operators pursue 63% net electrical efficiency benchmarks.[4]Siemens Energy, “Technical Whitepaper 2024,” siemens-energy.com Simple-cycle machines retain value in peaking and ancillary-service markets, but their share is declining as batteries claim frequency-regulation revenues.
Coupling turbines with desalination is reinforcing combined-cycle economics in the Middle East. UAE’s 2,400 MW Hassyan plant pairs power generation with 120 million gallons per day of water production, halving water costs versus standalone reverse-osmosis. Concessional financiers like the Asian Development Bank now use ISO 50001 certification as a gatekeeper for gas-power loans above USD 200 million, further standardizing high-efficiency designs.
By Fuel Type: Hydrogen Blending Reshapes Market Dynamics
Natural gas retained a 90.2% share in 2025, yet hydrogen, biogas, and RNG are expanding at a 16.1% CAGR, the fastest of any fuel category. The gas turbine market size for hydrogen-capable equipment is forecast to reach USD 14 billion by 2031 as OEMs race for full-hydrogen certification. GE Vernova’s 7HA.03 achieved 100% hydrogen firing in Ohio in 2024, and Siemens Energy booked eight hydrogen-ready units across Germany and the Netherlands in 2025.
Liquid fuels remain essential in remote and offshore contexts where pipeline gas is impractical. Baker Hughes’ dual-fuel NovaLT12 enables rapid fuel switching, ensuring resilience for drilling and mining operations. The EU Renewable Energy Directive III requires 5% renewable content in turbine fuels by 2030, likely pushing biogas adoption across agricultural regions.
By End-User Industry: Oil & Gas Monetizes Stranded Gas
Power generation absorbed 69.8% of 2025 demand, yet the oil-and-gas sector is the swing buyer, directing cogeneration units to monetize associated gas and cut diesel consumption. Baker Hughes turbines at Saudi Arabia’s Jafurah field saved USD 85 million annually by replacing diesel in 2024. ExxonMobil’s Guyana offshore project deployed LM2500 units to capture flare gas, while Shell’s Prelude FLNG in Australia reduced emissions 40% after installing SGT-400 turbines.
Industrial users such as data centers and chemicals are adopting on-site generation for energy security. Microsoft and Google each ordered distributed turbines in 2024 configured for renewable natural gas blends, underscoring demand diversification.
Geography Analysis
Asia-Pacific generated 59.5% of global revenue in 2025 and is set to expand at a 7.3% CAGR through 2031, cementing its lead in the gas turbine market. China approved 12 GW of new gas capacity in 2025, with local OEMs securing 70% of orders. India projects 25 GW of additions by 2030, incentivizing joint ventures that localize high-value components. LNG-to-power pipelines totaling 14 GW across Southeast Asia will enter construction before 2028 with multilateral financing support.
North America market growth focused on data-center backup power, LNG export cogeneration, and hydrogen pilots. The United States added 4.8 GW in 2024, and Mexico awarded 2.4 GW of combined-cycle contracts in 2025. Canada’s LNG Canada project relies on 1.2 GW of GE turbines for liquefaction, highlighting the role of gas generation in energy exports. Stricter EPA emissions thresholds from 2025 raise capital costs by 8% due to required selective catalytic reduction systems. Europe is facing headwinds from volatile gas prices and ESG financing limits. Germany and Spain deferred combined-cycle projects in 2024, while the UK opted for hydrogen-ready units to meet decarbonization goals. Southern Europe accelerated battery storage approvals, reducing gas peaker prospects.
The Middle East and Africa market is propelled by petrochemical cogeneration and water-plus-power projects. Saudi Arabia commissioned 3.8 GW in 2024, and Egypt placed Africa’s largest single turbine order in 2024 for 4.8 GW. South Africa pilots aeroderivative peakers to stabilize coal-heavy grids with African Development Bank support. South America captured 5% of revenue in 2025, leveraging turbines to offset hydropower variability. Brazil and Chile see peaker installations aligned with renewable integration roadmaps.

Competitive Landscape
Five global OEMs controlled 68% of 2025 revenue, yet regional manufacturers are gaining ground by meeting local-content rules in the Asia-Pacific. Hydrogen readiness now defines competitive parity. GE’s HA series won 100% hydrogen certification in 2024, Siemens Energy achieved 75% blending thresholds, and Mitsubishi Power targets full hydrogen firing by 2027. Digital-twin applications reduce forced outages by 30%, creating defensible service revenue as equipment margins compress.
White-space innovation focuses on microgrids, offshore platforms switching from diesel, and disaster-relief leasing pools. Niche players like Solar Turbines and Capstone Green Energy exploit sub-10 MW opportunities with fast-start microturbines. Patent filings underscore strategic direction, with 14 GE patents on hydrogen combustion, nine Siemens filings on additive manufacturing, and six Mitsubishi patents on ammonia co-firing during 2024.
Gas Turbine Industry Leaders
Mitsubishi Heavy Industries Ltd
General Electric Company
Siemens Energy AG
Rolls-Royce Holdings plc (Aeroderivative)
Ansaldo Energia SpA
- *Disclaimer: Major Players sorted in no particular order

Recent Industry Developments
- November 2025: Aster Power is set to invest USD 150 million in developing a hydrogen-ready gas turbine. This turbine will feature heat integration with the chemical facilities at Aster's energy and petrochemical hub.
- July 2025: In a landmark agreement, Crusoe, recognized as the industry's pioneering vertically integrated AI infrastructure provider, has secured 29 units of GE Vernova's cutting-edge LM2500XPRESS aeroderivative gas turbine packages for its data centers.
- April 2025: GE Vernova unveiled the AGP XPAND, an advanced gas path upgrade. This upgrade, an evolution of the established Advanced Gas Path (AGP) technology, is tailored for the 9E.03 gas turbines.
- February 2025: Morocco's ONEE has awarded a significant contract to Mitsubishi Power, entrusting them with two M701JAC gas turbines for the Al Wahda plant. Set to bolster the national grid by 990 MW and complement its renewable efforts, the turbines are slated to commence operations in 2027.


Research Methodology Framework and Report Scope
Market Definitions and Key Coverage
Our study defines the gas turbine market as revenue generated from the sale of newly manufactured industrial gas turbines across all capacity brackets and the recurring maintenance, repair, and overhaul (MRO) services tied to the global installed fleet.
Reciprocating gas engines, microturbines below 1 MW, and steam or wind turbines lie outside this scope.
Segmentation Overview
- By Capacity
- Below 30 MW
- 30 to 120 MW
- Above 120 MW
- By Type
- Combined Cycle
- Simple/Open Cycle
- Cogeneration/CHP
- By Fuel Type
- Natural Gas
- Liquid Fuels (Diesel/Kerosene/LPG)
- Other Fuel Types (Hydrogen, Biogas)
- By End-User Industry
- Power
- Oil and Gas
- Other End-user Industries (Industrial, Marine)
- By Geography
- North America
- United States
- Canada
- Mexico
- Europe
- United Kingdom
- Germany
- France
- Italy
- Spain
- Russia
- Rest of Europe
- Asia-Pacific
- China
- India
- Japan
- South Korea
- ASEAN Countries
- Rest of Asia-Pacific
- South America
- Brazil
- Argentina
- Chile
- Rest of South America
- Middle East and Africa
- Saudi Arabia
- United Arab Emirates
- South Africa
- Egypt
- Rest of Middle East and Africa
- North America
Detailed Research Methodology and Data Validation
Primary Research
Mordor analysts interview turbine OEM sales engineers, independent service providers, and power-utility planners in Asia-Pacific, Europe, the Americas, and the Middle East. These discussions validate shipment tallies, typical selling prices, service contract penetration, hydrogen-readiness premiums, and regional policy triggers, filling critical gaps left by desk work.
Desk Research
We start with public datasets such as the IEA's Electricity Information, the U.S. EIA International Energy Outlook, UN Comtrade trade codes for HS 8406, and regional grid operator statistics, which anchor volumes and fuel mixes. Company 10-Ks, investor decks, and technical papers from bodies such as the Global Gas Turbine Association enrich efficiency curves and cost benchmarks. Paid assets in D&B Hoovers and Questel add OEM financial splits and patent pipelines that hint at forthcoming capacity classes. This list is illustrative; many other sources assisted our analysts.
Market-Sizing & Forecasting
A top-down construct converts national gas-fired generation (TWh) into implied new-build and replacement demand using fleet age profiles, capacity factors, and retirement rules. Results are then cross-checked with sampled OEM ASP × volume roll-ups for key classes. Variables driving the model include gas share in generation, average combined-cycle efficiency, announced capacity additions, steel and nickel price indices, and MRO spend per MW. For forecasting, we deploy an ARIMA framework with scenario overlays that integrate expert consensus on gas prices and policy shifts. Where bottom-up evidence lags, interpolation factors based on historical installation rhythms are applied and later trimmed through peer review.
Data Validation & Update Cycle
Outputs pass a two-stage analyst audit, variance checks against independent grid and trade signals, and reruns if deviations exceed preset bands. Reports refresh yearly; material events trigger interim revisions, and a last-mile validation occurs just before delivery so clients always receive our latest view.
Why Mordor's Gas Turbine Baseline Deserves Confidence
Published estimates often diverge because firms slice the market differently, select unlike price anchors, or refresh at uneven intervals.
By combining equipment and MRO revenues, applying live currency conversions, and updating every twelve months, Mordor Intelligence presents a baseline decision-makers can trace back to transparent drivers.
Benchmark comparison
| Market Size | Anonymized source | Primary gap driver |
|---|---|---|
| USD 62.54 B (2025) | Mordor Intelligence | - |
| USD 25.26 B (2025) | Global Consultancy A | Equipment only, excludes services, >50 MW turbines counted |
| USD 18.90 B (2021) | Trade Journal B | Older base year, equipment revenue only, infrequent updates |
The comparison shows how narrower scopes, dated baselines, and limited refresh cycles compress figures elsewhere, whereas our disciplined, openly documented approach supplies a balanced and reproducible market view.


Key Questions Answered in the Report
What is the current value of the global gas turbine market?
It stands at USD 21.11 billion in 2026 and is projected to grow at a 6.44% CAGR to 2031.
Which region leads demand for gas turbines through 2031?
Asia-Pacific dominates with 59.5% of 2025 revenue and a 7.3% forecast CAGR.
How fast is the hydrogen-capable turbine segment growing?
Alternative fuels, including hydrogen, are expanding at a 16.1% CAGR between 2026 and 2031.
Why are combined-cycle configurations favored?
They deliver up to 63% net efficiency, lowering fuel costs and emissions, which drives a 7% CAGR through 2031.
Which capacity bracket is expanding the quickest?
Turbines rated 31 to 120 MW show the fastest growth at a 6.8% CAGR due to modular deployment advantages.
Page last updated on:


