North America E-commerce Fulfillment Services Market Size and Share
Market Overview
| Study Period | 2020 - 2031 |
|---|---|
| Forecast Data Period | 2026 - 2031 |
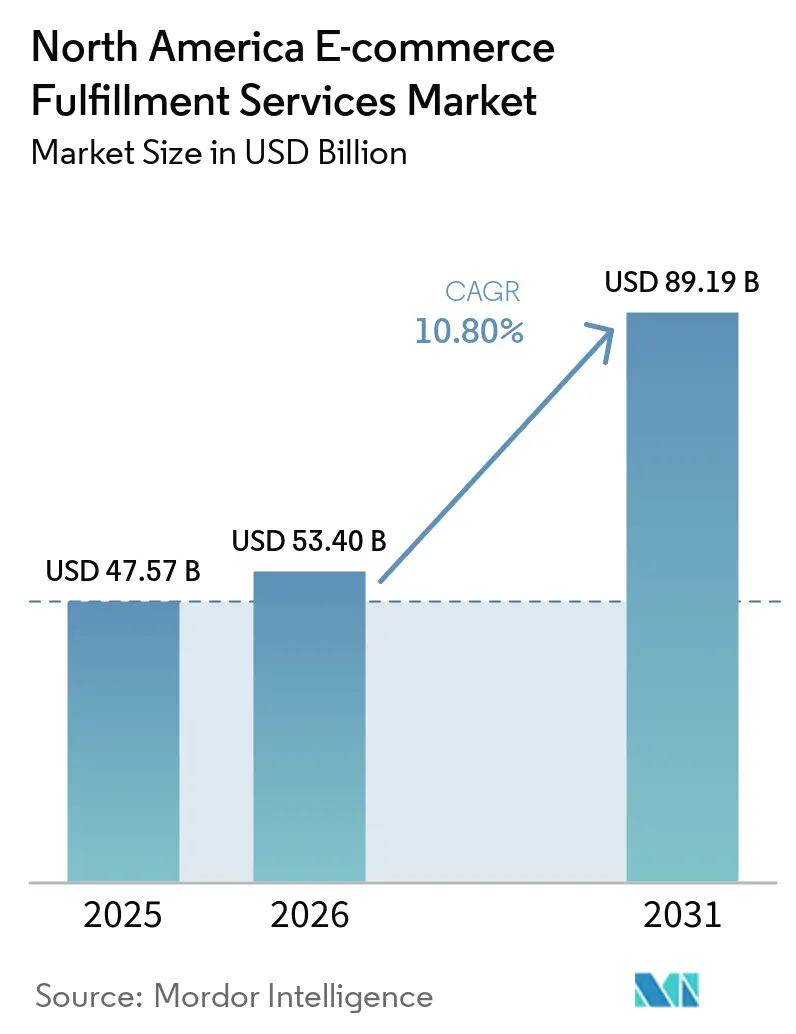
| Base Year Market Size (2025) | USD 47.57 Billion |
| Market Size (2026) | USD 53.40 Billion |
| Market Size (2031) | USD 89.19 Billion |
| Growth Rate (2026 - 2031) | 10.80% CAGR |
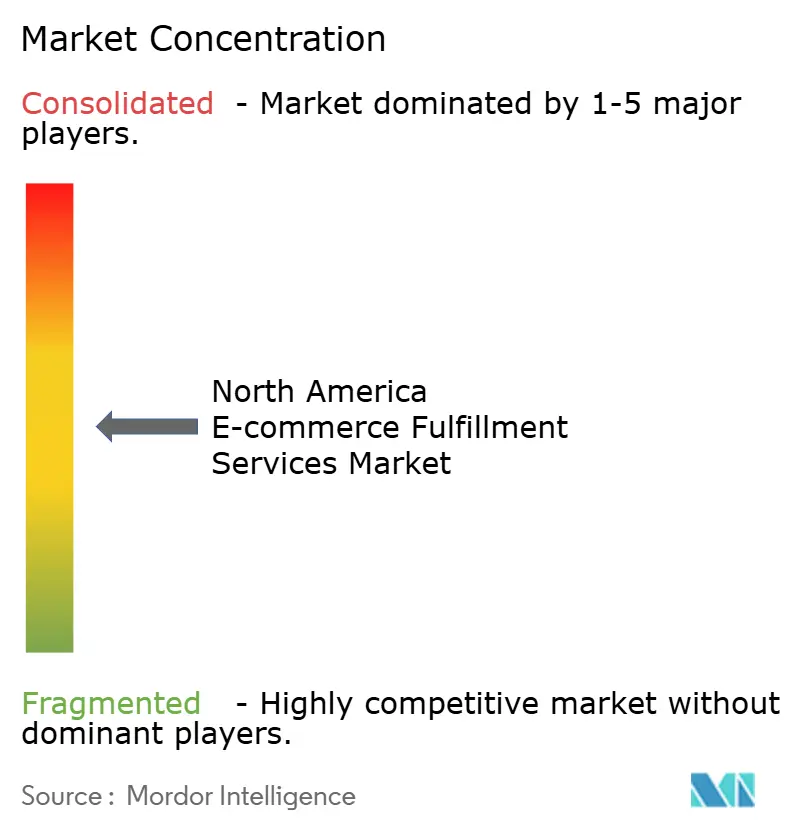
| Market Concentration | Medium |
Major Players *Disclaimer: Major Players sorted in no particular order Image © Mordor Intelligence. Reuse requires attribution under CC BY 4.0. | |
North America E-commerce Fulfillment Services Market Analysis by Mordor Intelligence
The North America e-commerce fulfillment services market size is projected to grow from USD 47.57 billion in 2025 to USD 53.4 billion in 2026, and then to USD 89.19 billion by 2031, registering a 10.8% CAGR between 2026 and 2031.
Robust demand stems from social-commerce monetization, subscription-box standardization, and omni-channel orchestration that together redefine how brands position inventory and serve shoppers. Recurring volumes generated by subscription boxes enable fulfillment centers to fine-tune labor scheduling and lower carrier costs. At the same time, micro-batch drops on TikTok Shop and Instagram Checkout push providers to achieve sub-24-hour pick-to-ship cycles. Autonomous mobile robots (AMRs) that completed more than 4 billion picks in 2024 continue to raise unit-per-hour productivity and delay large capital spending on green-field facilities. Returns analytics platforms now recoup USD 15-25 per item through refurbishment, resale, and data monetization, turning reverse logistics into a profit lever rather than a cost center.
Key Report Takeaways
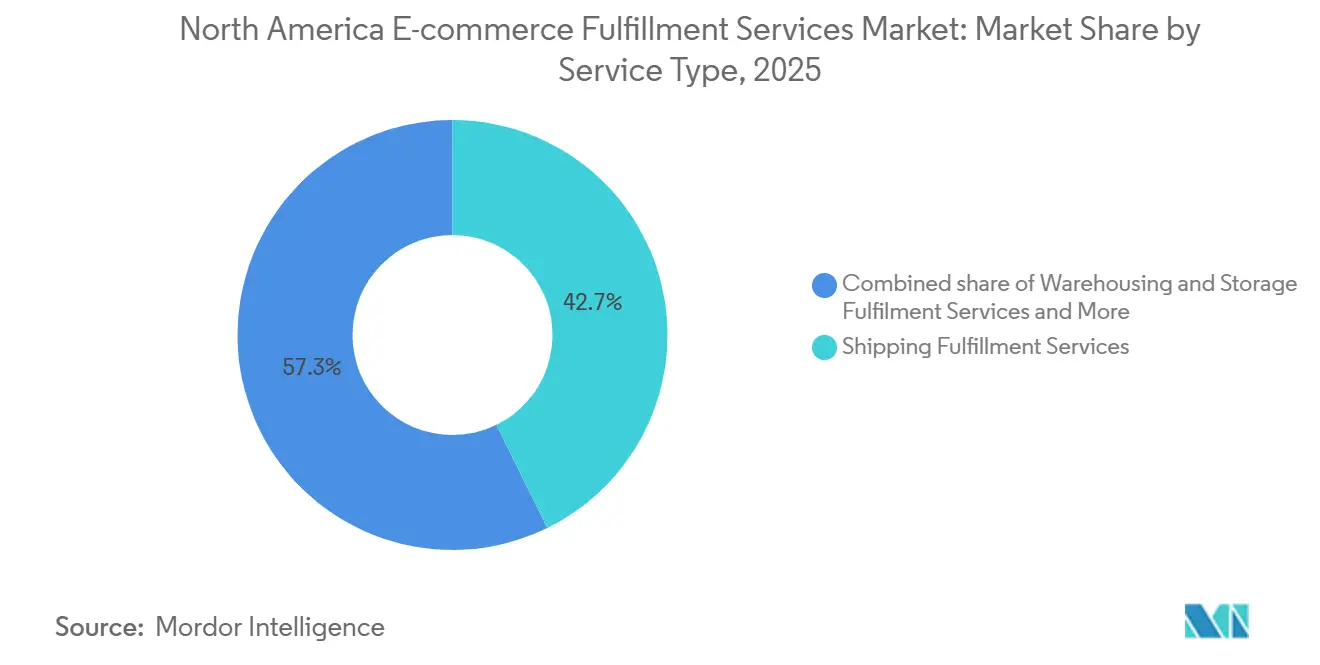
- By service type, shipping fulfilment services captured 42.74% of the North America e-commerce fulfillment services market share in 2025, while bundling fulfilment services are forecast to advance at a 13.83% CAGR to 2031.
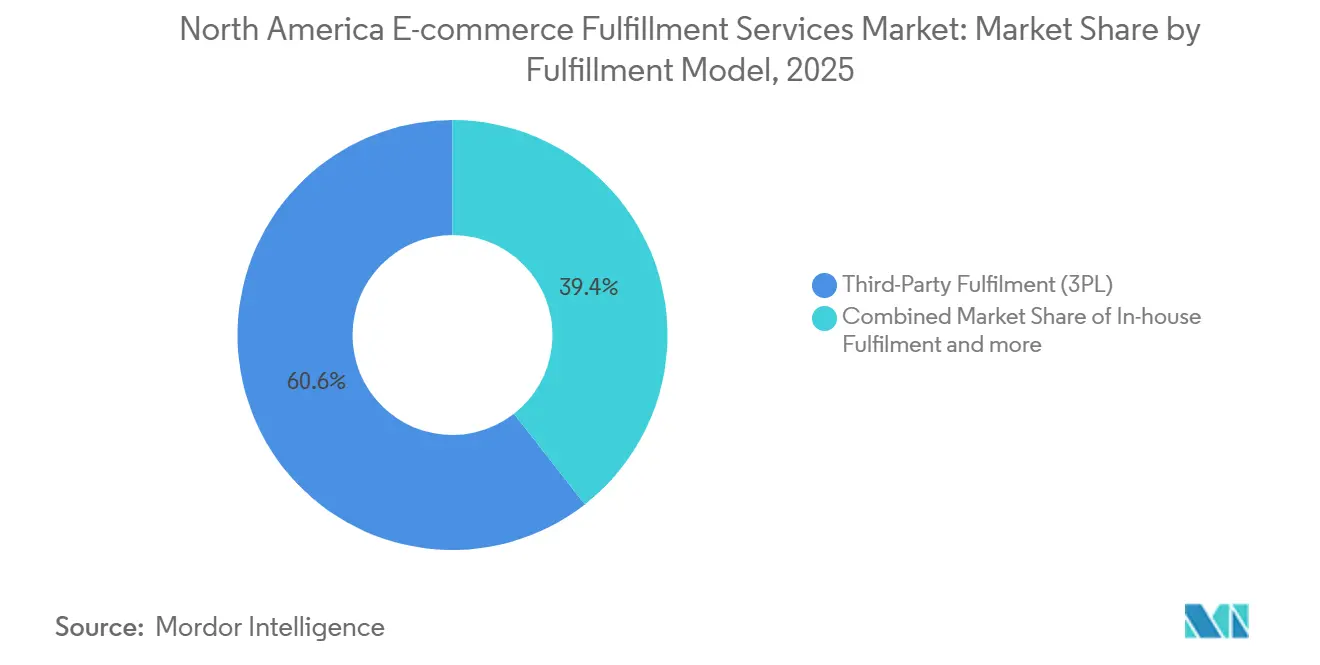
- By fulfillment model, dropshipping is expected to post a 21.98% CAGR through 2031, even as third-party fulfillment held 60.56% share of the North America e-commerce fulfillment services market size in 2025.
- By sales channel, business-to-business accounted for 61.93% market share in 2025, yet direct-to-consumer shipments are projected to grow at a 15.11% CAGR up to 2031.
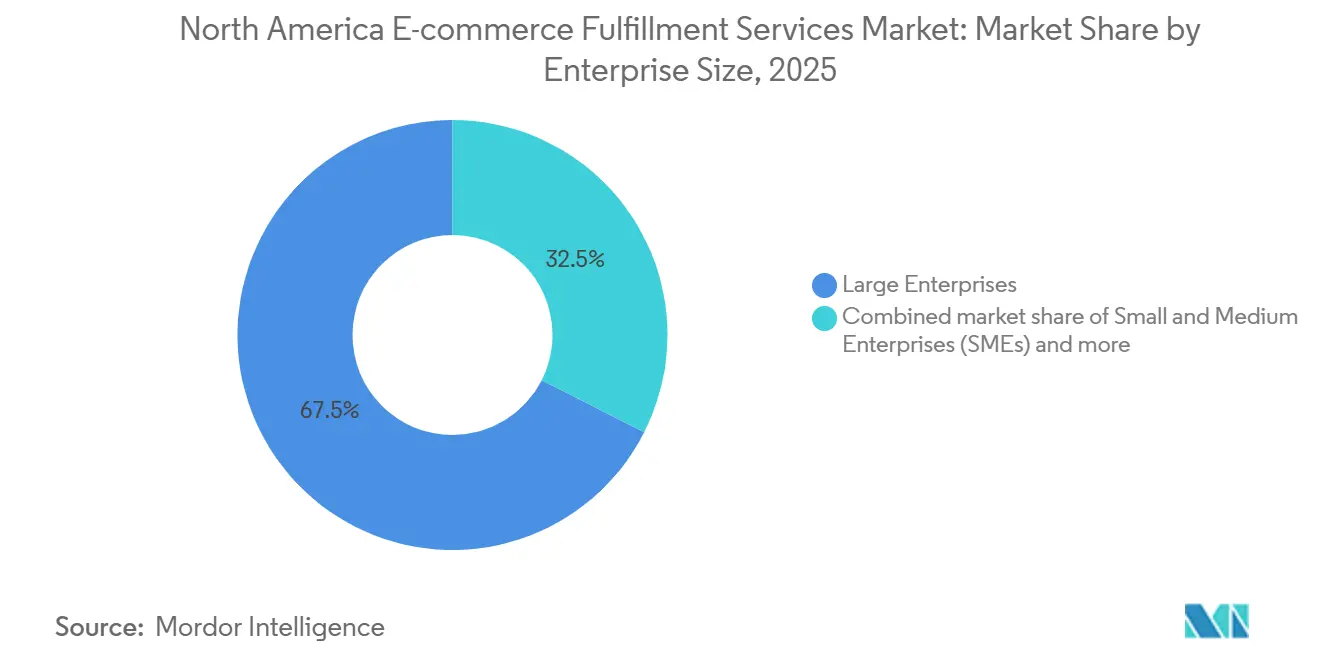
- By enterprise size, large enterprises commanded 67.54% of the North America e-commerce fulfillment services market in 2025, whereas small and medium enterprises are on track for a 14.38% CAGR during the forecast window.
- By end-use, electronics and household appliances are anticipated to expand at a 15.34% CAGR to 2031, outpacing fashion and lifestyle products that nonetheless led with 20.91% market share in 2025.
- By geography, the United States controlled 88.90% market share in 2025, while Mexico is projected to be the fastest-growing country at a 15.84% CAGR through 2031.
Note: Market size and forecast figures in this report are generated using Mordor Intelligence’s proprietary estimation framework, updated with the latest available data and insights as of January 2026.
North America E-commerce Fulfillment Services Market Trends and Insights
Drivers Impact Analysis*
| Driver | (~) % Impact on CAGR Forecast | Geographic Relevance | Impact Timeline |
|---|---|---|---|
| Social-commerce boom spawning micro-batch DTC fulfillment demand | +2.3% | United States and Canada urban centers, emerging in Mexico City | Short term (≤ 2 years) |
| Subscription-box economy creating predictable recurring volumes | +1.9% | North America-wide, concentrated in consumer packaged goods | Medium term (2-4 years) |
| Federal and state tax credits accelerating cold-chain FC build-outs | +1.5% | United States with renewable energy incentives, Canadian provinces | Long term (≥ 4 years) |
| Returns-analytics platforms turning reverse logistics into profit centers | +1.7% | Major metropolitan areas across the United States and Canada | Medium term (2-4 years) |
| Omni-channel BOPIS and ship-from-store orchestration lifting FC throughput | +1.8% | Retail-dense markets in the United States, Canada, expanding to Mexico | Short term (≤ 2 years) |
| Autonomous mobile robots slashing pick-time and labor reliance | +1.6% | Large fulfillment hubs in the United States and Canada, pilot deployments in Mexico | Medium term (2-4 years) |
| Source: Mordor Intelligence | |||
Social-Commerce Boom Spawning Micro-Batch DTC Fulfillment Demand
Micro-batch product drops on TikTok Shop and Instagram Checkout generate 500-2,000 orders in only a few hours, so fulfillment partners must allocate labor dynamically and maintain real-time inventory views to protect campaign momentum. Speed now outweighs volume, rewarding providers that can toggle between high-throughput waves and specialty work cells inside the same facility. Direct connections between warehouse software and social-commerce APIs shorten confirmation cycles and feed accurate status data back into influencer streams. Facilities that master this cadence enjoy premium fees for rapid pick-to-ship service even at low batch sizes, cementing micro-batch fulfillment as a long-term differentiator[1]“Alternative Fuel Vehicle Refueling Property Credit,” Internal Revenue Service, irs.gov.
Subscription-Box Economy Creating Predictable Recurring Volumes
Subscription shipments, accounted for USD 22.7 billion, give operators 30-90 day volume visibility, letting them pre-position inventory and negotiate carrier tiers with certainty. Retention levels of 70-85% keep month-to-month volume swings below 10%, far steadier than mainstream e-commerce. Specialized lines handle kitting and personalization without sacrificing cadence, saving 15-20% on labor versus traditional wave picking. These economics spur purpose-built subscription facilities that trade peak-season flexibility for recurring flow optimization, carving a defensible niche.
Federal and State Tax Credits Accelerating Cold-Chain FC Build-Outs
The Alternative Fuel Vehicle Refueling Property Credit delivers up to USD 100,000 per electric refrigerated truck charging station, trimming 20-30% from cold-chain capital spend for a mid-sized fulfillment center. California, New York, and Illinois stack extra credits for renewable energy compliance, shifting ROI hurdles and front-loading cash flow. Meal-kit, pharma, and fresh grocery players, therefore, commission temperature-controlled docks and EV fleets concurrently, tightening delivery windows for perishable goods. Integrated networks leveraging shared charging yards enjoy extra scale, pushing standalone cold warehouses toward partnership models[2]“Sending It Back: Reverse Logistics and the U.S. Postal Service,” USPS OIG, uspsoig.gov.
Returns-Analytics Platforms Turning Reverse Logistics into Profit Centers
Platforms evaluate reason codes, product condition, and secondary-market pricing to route returns into resale, liquidation, or refurbishment pathways that capture 65-75% of original value, beating manual flows by more than 20 percentage points. Fashion items, where return rates average 24.4%, stand to gain the most, yet electronics deliver higher per-unit recovery because of component harvesting. Monetizing returns data further boosts margins, as brands pay for insights on sizing, quality, and defect trends.
Restraints Impact Analysis*
| Restraint | (~) % Impact on CAGR Forecast | Geographic Relevance | Impact Timeline |
|---|---|---|---|
| Packaging-waste legislation driving up eco-material spend | -1.1% | California, Colorado, Maine, Minnesota, Oregon; expanding to other states | Long term (≥ 4 years) |
| SKU proliferation inflating inventory carrying and slotting complexity | -0.9% | North America-wide, most acute in multi-category fulfillment operations | Medium term (2-4 years) |
| Rising cyber-attacks on WMS/APIs disrupting order flows | -0.8% | Large fulfillment hubs with extensive API integrations | Short term (≤ 2 years) |
| Cross-border customs frictions slowing Canada–United States parcel velocity | -0.6% | Border regions and cross-border e-commerce corridors | Medium term (2-4 years) |
| Source: Mordor Intelligence | |||
Packaging-Waste Legislation Driving Up Eco-Material Spend
Packaging waste legislation is significantly increasing fulfillment costs due to new EPR (Extended Producer Responsibility) rules that tie fees to packaging type and weight. These regulations are pushing operators toward costlier materials, such as paper or compostable mailers, while also requiring detailed compliance reporting. Providers must either absorb these rising material and administrative expenses or pass them on to clients, with smaller operators being disproportionately affected due to their lack of purchasing scale and compliance resources. Coastal and cross-border networks face additional hurdles, contending with climate mandates and Canadian EPR requirements[3]“Statement on CBSA System Outage,” Canada Border Services Agency, cbsa-asfc.gc.ca.
SKU Proliferation Inflating Inventory Carrying and Slotting Complexity
SKU proliferation is driving up costs and complicating warehouse operations. The increase in product variants raises expenses related to storage, carrying, and handling while making slotting, replenishment, and forecasting more challenging. Dynamic slotting and AI-driven optimization offer solutions by reducing travel time and improving service levels, but these require advanced software, data, and process capabilities that smaller 3PLs often cannot afford. Additionally, frequent reslotting driven by seasonal fashion trends or personalized SKUs can erode the efficiency gains achieved through automation.
*Our forecasts treat driver/restraint impacts as directional, not additive. The impact forecasts reflect baseline growth, mix effects, and variable interactions.
Segment Analysis
By Service Type: Bundling Gains as Integration Complexity Rises
Shipping services represented 42.74% of the North America e-commerce fulfillment services market size in 2025, highlighting the decisive weight of final-mile performance on shopper loyalty. Bundling of warehousing, kitting, and shipping is forecast to record a 13.83% CAGR as brands favor unified dashboards over multiple vendor interfaces.
Integrated contracts reduce data silos, give a single escalation path, and support network-wide KPIs that appeal to omnichannel retailers. Providers with proprietary cloud platforms can upsell analytics-based improvements and lock in multi-year renewals, shifting competition from per-parcel pricing to outcome guarantees.


By Fulfillment Model: Dropshipping Surges on Tariff Restructuring
Third-party fulfillment kept 60.56% of the North America e-commerce fulfillment services market share in 2025 by offering variable cost and instant scale. Dropshipping, however, is projecting a 21.98% CAGR because tariff reforms eliminated de minimis relief and penalized overseas direct imports.
Brands lean on the United States-based dropship inventories to preserve fast delivery while avoiding punitive duties, creating room for 3PLs that aggregate inventory for hundreds of micro-brands. Hybrid models combine owned DCs for core SKUs with third-party dropship for long-tail items, spreading fixed costs and maintaining breadth without capital lockup.
By Sales Channel: D2C Momentum Reshapes Channel Economics
B2B still accounted for 61.93% market share of the 2025 value, as pallet-level flows guarantee volume density and predictable routing. Direct-to-consumer parcels, though smaller individually, are on pace for a 15.11% CAGR as brands chase data ownership and higher margins through owned storefronts.
Fulfillment providers now embed turnkey storefront connectors, payment gateways, and real-time inventory APIs so that manufacturers can go D2C in weeks, shrinking dependency on marketplaces. Partnerships such as ShipBob-Temu streamline listing and fulfillment across channels, letting SMEs scale reach without splintering inventory.
By Enterprise Size: SME Adoption Narrows the Capability Gap
Large enterprises controlled 67.54% market share of 2025 spend, leveraging scale to secure custom robotics and dedicated labor teams. Yet SMEs posting a 14.38% CAGR gain enterprise-grade tools via cloud WMS, algorithmic pricing, and multi-tenant warehouses. DHL’s acquisition of IDS Fulfillment typifies how global operators court smaller accounts with modular service menus.
SMEs adopt flexible term contracts and value-added options such as branded packaging and eco-materials to differentiate without massive capital outlay[4]“Autonomous Mobile Robots for Warehouses: Rising U.S. Production,” U.S. International Trade Commission, usitc.gov. Their agility to test new channels and products positions them as early adopters of experimental fulfillment tech, influencing broader market standards.
By End-Use Industry: Electronics Growth Reflects Smart Home Adoption
Fashion and lifestyle SKUs led market share at 20.91% in 2025, but battle high return costs and seasonal peaks. Electronics and household appliances are forecast to expand at 15.34% CAGR, aided by smart-home device upgrades and consumer trust in shipping fragile, high-value goods.
Fulfillment centers add anti-static zones, serialized tracking, and secure cages to win electronics contracts, raising switching costs for clients. Temperature-controlled supplements, personal care, and fresh foods depend on cold-chain incentives that offset infrastructure premiums and support steady volume pipelines.
Geography Analysis
The United States accounted for 88.90% market share of the 2025 revenue, anchored by dense fulfillment ecosystems in California, Texas, Florida, and New York that enable same-day and next-day economics for more than half the nation’s population. Investments such as Stord’s post-acquisition 2 million-square-foot network reinforce national coverage and propel technology diffusion at scale.
Canada leverages USMCA harmonization to channel cross-border parcels, yet grapples with customs delays and plastics bans that mandate expensive packaging changes. Operators invest in Ontario and British Columbia facilities to buffer risk and shorten domestic legs.
Mexico is the fastest-growing geography at a projected 15.84% CAGR, fueled by nearshoring that attracted 453 manufacturers since past few years, and Amazon’s second Monterrey fulfillment center opened in 2024. Lower labor costs, expanding toll roads, and proximity to the United States consumer clusters make Mexico an attractive node for regional inventory pooling.
Competitive Landscape
Competition remains moderate, with national parcel giants, asset-light tech disruptors, and vertical specialists vying for wallet share. FedEx injected capital into Nimble to integrate fully autonomous cells, signaling its intent to blend robotics with its existing carrier backbone. Stord’s acquisitions of Ware2Go and Pitney Bowes’ Kentucky megafacility expand its network and analytics layer, challenging incumbents by offering outcome-based SLAs.
Returns analytics firms, cold-chain specialists, and platform integrators target white spaces such as drug fulfillment, subscription kitting, and cross-border orchestration. Technology shapes competitive advantage: operators deploying AMRs report 2-3× productivity, while AI demand models cut working capital by 20%. Strategic focus is shifting from raw floor space toward orchestration software that spans stores, DCs, and carrier nodes, aligning with client demand for integrated visibility.
Incumbents pursue M&A to secure capability breadth, evidenced by DHL’s purchase of IDS Fulfillment for SME reach and RXO’s USD 1.025 billion takeover of Coyote Logistics to combine brokerage with e-commerce freight. Providers that fuse logistics assets with proprietary software are best placed to capture emerging bundles and defend margin.
North America E-commerce Fulfillment Services Industry Leaders
GXO Logistics
Flexport
Amware Fulfillment
DHL Group
FedEx
- *Disclaimer: Major Players sorted in no particular order

Recent Industry Developments
- May 2025: Stord acquired Ware2Go, adding 2 million sq ft of distributed capacity and elevating 1-2-day delivery coverage to 99% of the United States households.
- May 2025: DHL Supply Chain purchased IDS Fulfillment to bolster SME direct-to-consumer specialization.
- November 2024: Amazon launched its second Monterrey facility, strengthening Mexico’s role in North America's e-commerce flows.
- October 2024: NLS broke ground on a 200,000 sq ft Ontario fulfillment center featuring automated sortation and chilled zones.


North America E-commerce Fulfillment Services Market Report Scope
| Warehousing and Storage Fulfilment Services |
| Bundling Fulfilment Services |
| Shipping Fulfilment Services |
| Other Niche / Value-added Services |
| In-house Fulfilment |
| Third-Party Fulfilment (3PL) |
| Dropshipping |
| Hybrid Fulfilment |
| Direct-to-Consumer (D2C) |
| Business-to-Consumer (B2C Marketplace) |
| Business-to-Business (B2B) |
| Small and Medium Enterprises (SMEs) |
| Large Enterprises |
| Foods and Beverages |
| Personal and Household Care |
| Fashion and Lifestyle (Accessories, Apparel, Footwear) |
| Furniture and Home Decor |
| Electronics and Household Appliances |
| Other Products |
| United States |
| Canada |
| Mexico |
| By Service Type | Warehousing and Storage Fulfilment Services |
| Bundling Fulfilment Services | |
| Shipping Fulfilment Services | |
| Other Niche / Value-added Services | |
| By Fulfilment Model | In-house Fulfilment |
| Third-Party Fulfilment (3PL) | |
| Dropshipping | |
| Hybrid Fulfilment | |
| By Sales Channel | Direct-to-Consumer (D2C) |
| Business-to-Consumer (B2C Marketplace) | |
| Business-to-Business (B2B) | |
| By Enterprise Size | Small and Medium Enterprises (SMEs) |
| Large Enterprises | |
| By End-Use Industry | Foods and Beverages |
| Personal and Household Care | |
| Fashion and Lifestyle (Accessories, Apparel, Footwear) | |
| Furniture and Home Decor | |
| Electronics and Household Appliances | |
| Other Products | |
| By Geography | United States |
| Canada | |
| Mexico |


Key Questions Answered in the Report
What CAGR is projected for North American e-commerce fulfillment through 2031?
The market is forecast to grow at a 10.8% CAGR between 2026-2031.
Which service type is expanding the fastest?
Bundled fulfillment services are expected to lead with a 13.83% CAGR to 2031.
Why is drop shipping accelerating in North America?
Tariff reforms that removed de minimis relief for sub-USD 800 imports push brands to reposition inventory domestically via dropship networks.
How are returns becoming profitable for 3PLs?
Analytics platforms route returns to the highest-value disposition and capture 65-75% of original product value.
What makes Mexico attractive for new fulfillment centers?
Nearshoring, lower labor costs, and improving infrastructure support a 15.84% CAGR, the fastest in the region.
How do autonomous mobile robots affect picking productivity?
AMRs raise collaborative pick rates to 120-180 units per hour, roughly double manual throughput.
Page last updated on:


