North America Freight Brokerage Services Market Size and Share
Market Overview
| Study Period | 2020 - 2031 |
|---|---|
| Forecast Data Period | 2026 - 2031 |
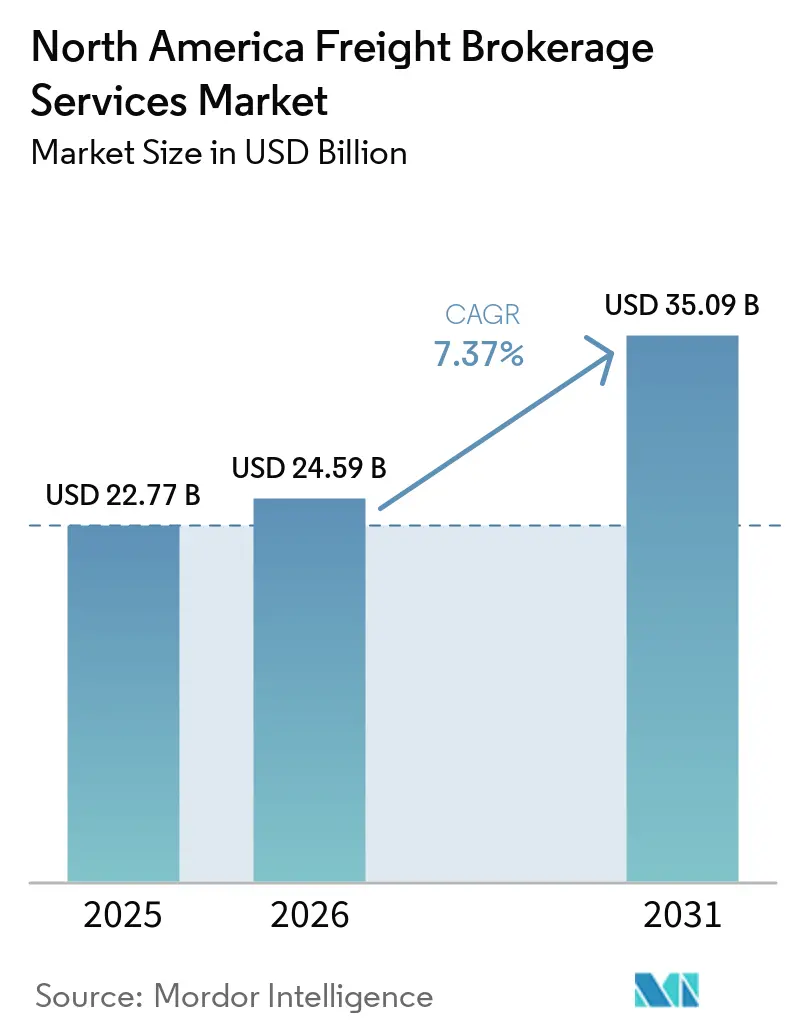
| Base Year Market Size (2025) | USD 22.77 Billion |
| Market Size (2026) | USD 24.59 Billion |
| Market Size (2031) | USD 35.09 Billion |
| Growth Rate (2026 - 2031) | 7.37% CAGR |
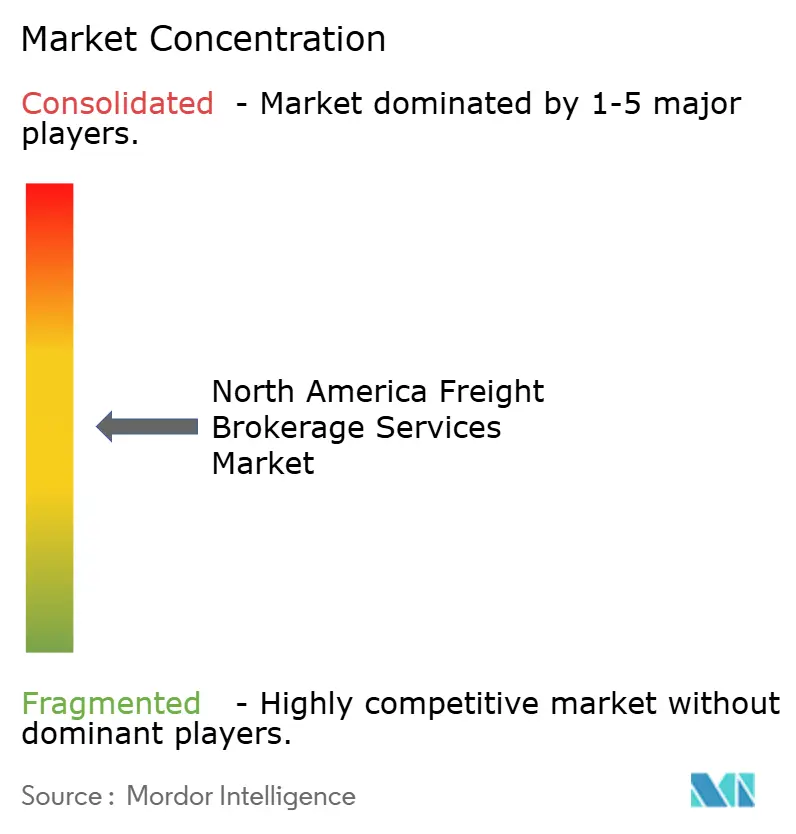
| Market Concentration | Medium |
Major Players *Disclaimer: Major Players sorted in no particular order Image © Mordor Intelligence. Reuse requires attribution under CC BY 4.0. | |
North America Freight Brokerage Services Market Analysis by Mordor Intelligence
The North America freight brokerage services market size is projected to expand from USD 22.77 billion in 2025 and USD 24.59 billion in 2026 to USD 35.09 billion by 2031, registering a 7.37% CAGR between 2026 and 2031.
Expansion reflects the shift from phone-based load coordination toward algorithm-driven capacity orchestration, in which AI pricing engines, API connectivity, and autonomous-truck pilots recast broker value creation. Technology-oriented intermediaries win share by layering predictive analytics, compliance dashboards, and emissions calculators onto long-standing carrier relationships, delivering visibility and speed that direct shipper–carrier tools cannot yet match. Momentum is reinforced by cross-border complexity under USMCA, escalating e-commerce returns, and warehouse labor shortages, each amplifying the need for flexible third-party capacity. Consolidation accelerates as RXO, C.H. Robinson, and other scale brokers absorb smaller rivals that struggle with FMCSA financial-responsibility rules and California AB5 liability, reshaping competitive balance across the North America freight brokerage services market.
Key Report Takeaways
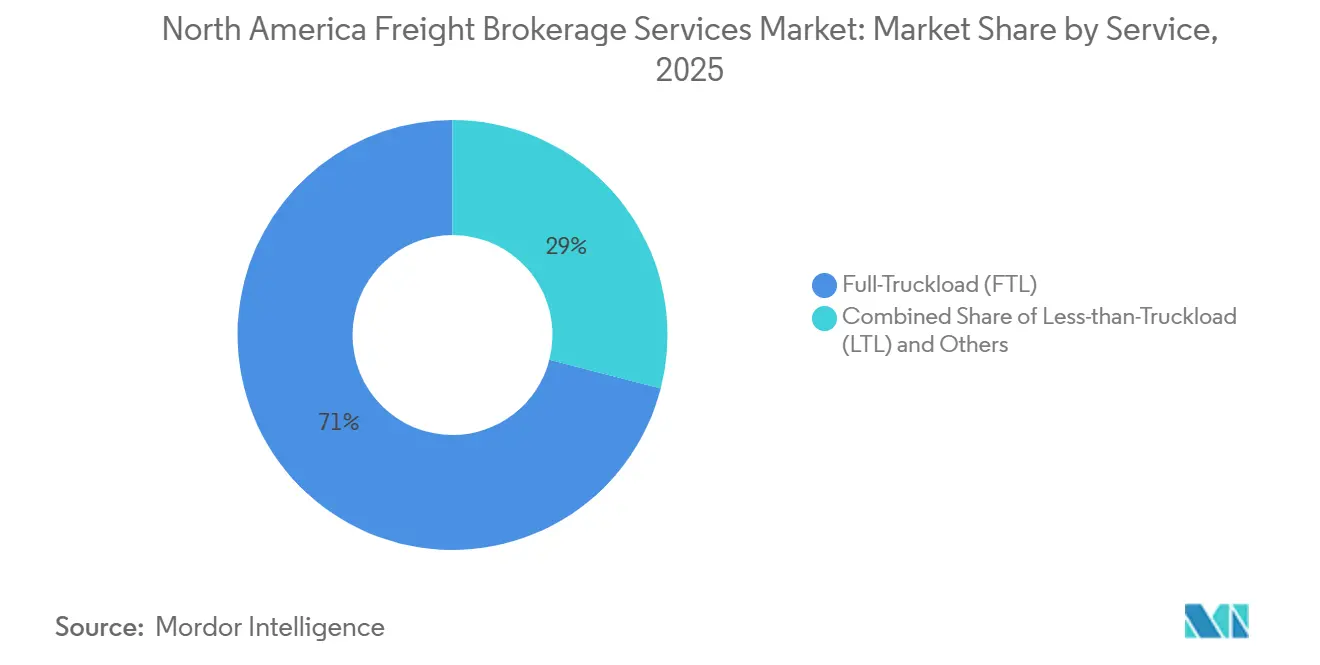
- By service, less-than-truckload captured the fastest 9.66% growth pace, while full-truckload retained 71.05% of the North America freight brokerage services market share in 2025.
- By equipment, refrigerated vans are forecast to account for a 9.97% CAGR, and dry-van moves held 43.78% of the North America freight brokerage services market size in 2025.
- By haul length, long-haul moves generated 64.18% of the North America freight brokerage services market size in 2025, while local haul is projected to expand at 11.03% CAGR through 2031.
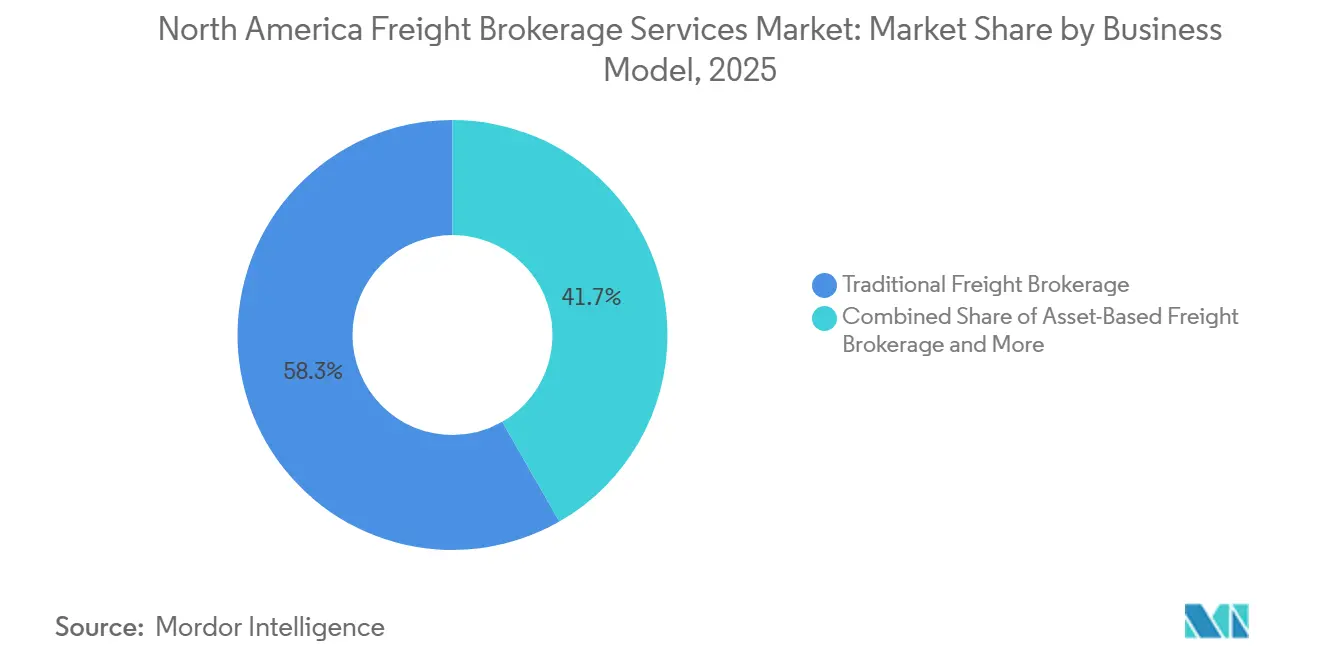
- By business model, digital freight brokerage is advancing at a 21.43% CAGR, yet traditional brokers still controlled 58.28% market share in 2025.
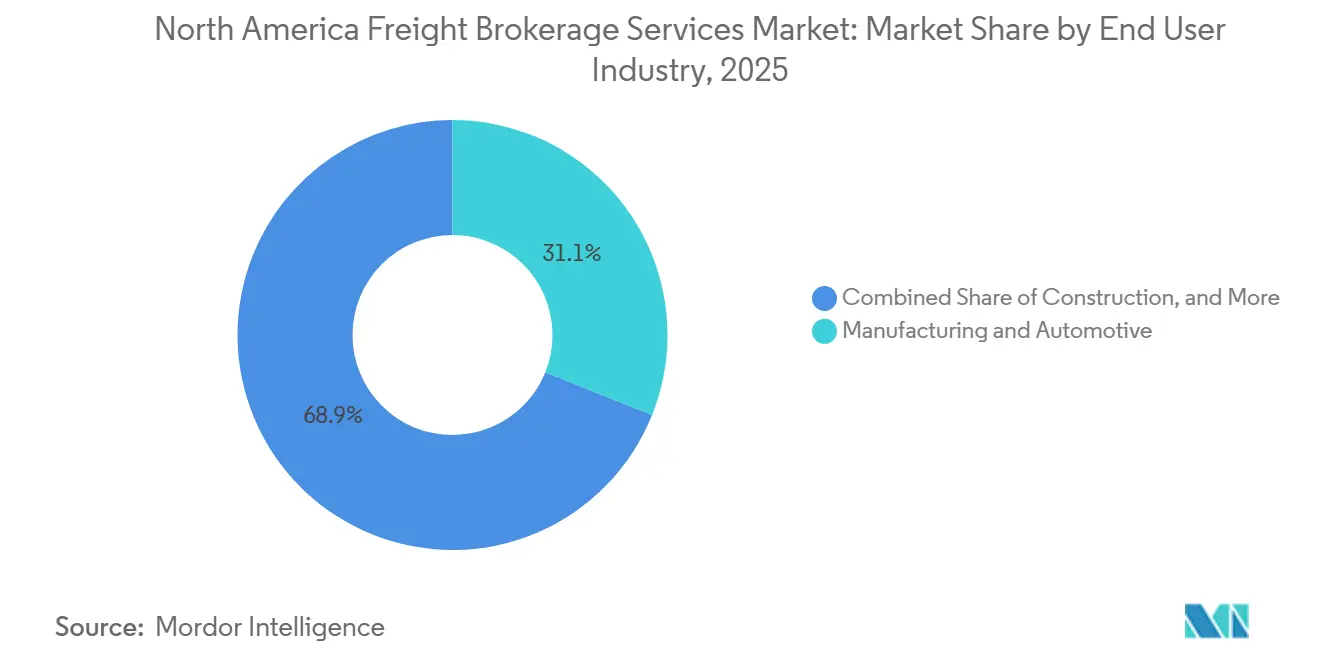
- By end user, manufacturing and automotive led with 31.07% revenue share, while e-commerce and 3PL fulfillment is forecast to post a 14.91% CAGR to 2031.
- By customer size, large enterprises commanded 61.72% market share in 2025, but small businesses are climbing at 12.59% CAGR through 2031.
- Geographically, the United States generated 85.50% of 2025 revenue, whereas Mexico is expected to record the highest 8.61% CAGR over the forecast window.
Note: Market size and forecast figures in this report are generated using Mordor Intelligence’s proprietary estimation framework, updated with the latest available data and insights as of January 2026.
Worldwide, activity is shaped by contributions from multiple regions, with North america representing one of the more structurally developed among them. The global report on freight brokerage services market by Mordor Intelligence reflects how these regional layers combine into a single system.
North America Freight Brokerage Services Market Trends and Insights
Drivers Impact Analysis*
| Driver | (~) % Impact on CAGR Forecast | Geographic Relevance | Impact Timeline |
|---|---|---|---|
| AI-driven lane-level dynamic pricing accelerates broker win-rates | +1.6% | North America, concentrated in high-volume metro corridors | Short term (≤ 2 years) |
| USMCA-enabled cross-border e-commerce shipments spur expedited brokerage demand | +1.3% | US-Mexico-Canada trade corridors, border gateway cities | Medium term (2-4 years) |
| Corporate Scope-3 mandates fuel adoption of broker-led carbon-optimized routing | +0.9% | North America, led by enterprise shippers with ESG commitments | Medium term (2-4 years) |
| Early commercialization of autonomous-truck capacity pools via broker networks | +0.7% | United States, pilot corridors in Texas, Arizona, California | Long term (≥ 4 years) |
| Integrated LTL–parcel consolidation models expand broker share of returns logistics | +1.4% | North America, concentrated in e-commerce fulfillment zones | Short term (≤ 2 years) |
| Real-time compliance analytics from ELD/telematics unlock detention-free SLAs | +1.0% | United States, Canada, FMCSA regulatory zones | Short term (≤ 2 years) |
| Source: Mordor Intelligence | |||
AI-Driven Lane-Level Dynamic Pricing Accelerates Broker Win-Rates
Machine learning now prices individual lanes using live capacity signals and competitive quotes. C.H. Robinson’s AI agents processed over 3 million shipment tasks in 2025, trimming quote-to-accept cycles to minutes and widening margin capture on volatile corridors. Sophisticated models digest historical tender outcomes, weather, and dwell-time metrics to forecast service risk, raising shipper confidence during bid events. Large intermediaries with deep data logs sharpen algorithms faster than smaller rivals, tilting share toward incumbents that reinvest savings into carrier loyalty programs. The dynamic pricing edge is most pronounced on Laredo and Nogales cross-border lanes, where real-time wait times swing spot rates all day. Smaller brokers counter by niching into flatbed or hazmat niches where algorithmic rate history is sparse[1]“Freight Transportation Data and Statistics.” 2024, Bureau of Transportation Statistics, bts.gov/topics/freight-transportation.
USMCA-Enabled Cross-Border E-Commerce Shipments Spur Expedited Brokerage Demand
De minimis thresholds under USMCA simplify small-parcel customs, unleashing direct-to-consumer flows from Mexican facilities into US households. Brokers blend parcel carriers with LTL consolidators to clear customs in bulk, then inject parcels into domestic hubs, shaving days off transit. Bilingual operations teams manage certificates of origin that still accompany mixed-case pallets, protecting shippers from audits. Competitive edges arise for brokers certified under CTPAT and FAST programs that fast-track northbound vehicles. Growth potential is magnified by electronics and apparel sellers that now promise seventy-two-hour cross-border delivery windows[2]“Trade and Cargo Security and Facilitation.” 2024, U.S. Customs and Border Protection, cbp.gov/trade.
Corporate Scope-3 Mandates Fuel Broker-Led Carbon-Optimized Routing
SEC climate disclosure proposals push Fortune 500 shippers to measure transportation emissions in Scope 3 inventories. Brokers embed GLEC-aligned calculators inside quoting engines, ranking carriers by grams of CO₂ per ton-mile. Mode-shift recommendations move freight from solo truckload to pool-distribution or intermodal, where feasible, while lane-mix dashboards flag high-emission corridors needing action. Early adopters win RFPs that score sustainability alongside price and service. Carbon routing still trails cost in procurement weighting, yet pending state mandates in California and Canada give the practice a regulatory tailwind.
Early Commercialization of Autonomous-Truck Capacity Pools via Broker Networks
Self-driving developers partner with brokers for freight access. Aurora and Torc pilot forty-foot reefers between Dallas and Phoenix using broker-aggregated loads that fit overnight delivery profiles. Brokers craft SLAs guaranteeing zero driver swaps and synced dock appointments, easing shipper apprehension. First movers gain preferential truck hours once the technology scales, while refining pricing logic for unmanned asset cost structures. Regulatory clearance remains uncertain, yet early system integrations position brokers to monetize capacity once federal exemptions mature beyond test status.
Restraints Impact Analysis*
| Restraint | (~) % Impact on CAGR Forecast | Geographic Relevance | Impact Timeline |
|---|---|---|---|
| Large shippers' direct digital carrier platforms disintermediate traditional brokers | -1.3% | North America, concentrated among Fortune 500 shippers | Short term (≤ 2 years) |
| State-level co-employment & liability statutes (e.g., AB5) inflate legal exposure | -0.8% | United States, California and states adopting similar frameworks | Medium term (2-4 years) |
| Load-board data oligopoly limits analytics access for small and mid-sized brokers | -0.9% | North America, affecting brokers outside top-tier platforms | Medium term (2-4 years) |
| Rising cybersecurity & data-privacy compliance costs (CISA/NIST frameworks) | -0.7% | United States, Canada, regulated industries | Short term (≤ 2 years) |
| Source: Mordor Intelligence | |||
Large Shippers’ Direct Digital Carrier Platforms Disintermediate Traditional Brokers
Fortune 500 retailers deploy API hubs that pull live rates from contract carriers, bypassing intermediaries for predictable lanes. IntelliTrans now connects mill shippers with 2,800 carriers in real time, reserving broker use only for cross-border or oversized freight. Brokers respond by packaging exception management, detention shields, and guaranteed capacity bundles that software alone cannot match. Margin loss is acute on head-haul lanes in the Southeast, where carrier density is highest. Smaller brokers risk being locked out of enterprise routing guides if they cannot feed rates via standardized APIs[3]“U.S. International Trade Data.” 2024, U.S. Census Bureau, census.gov/foreign-trade/data.
State-Level Co-Employment & Liability Statutes Inflate Legal Exposure
California AB5 reclassified many owner-operators as employees and levied USD 868,000 in late-2024 penalties, jolting agent-model brokers who rely on commissioned contractors. Legal reviews now audit dispatch instructions, payment cadence, and branding use, pushing brokers to rewrite carrier agreements. Multistate fleets brace for similar legislation in New York and New Jersey. Compliance overhead drains technology budgets, while potential retroactive wage claims scare investors. National brokers absorb risk with captive insurance and legal retainer pools, widening resource gaps over regionals.
*Our forecasts treat driver/restraint impacts as directional, not additive. The impact forecasts reflect baseline growth, mix effects, and variable interactions.
Segment Analysis
By Service: LTL Gains Share Through Returns Consolidation
Less-than-truckload revenue is advancing at a 9.66% CAGR, lifted by USD 850 billion in e-commerce returns that now span LTL and parcel blends. Consolidators leverage pool points near Chicago and Dallas, where high parcel density lowers cost per return. Full truckload still anchors 71.05% of the North America freight brokerage services market share in 2025, yet automated carrier apps are eroding routine lane volumes, squeezing brokerage margins.
Digital brokers embed both modes in one dashboard, enabling merchants to toggle between pallet and parcel at late cut-off without re-tendering. Service differentiation pivots on claims handling, as apparel and electronics returns demand speedy refurbishment. Brokers that integrate point-of-sale refund triggers with freight scheduling deepen retailer loyalty and raise switching costs within the North America freight brokerage services market.


By Equipment/Trailer Type: Cold Chain Outpaces Dry Van Growth
Refrigerated capacity is climbing at a 9.97% CAGR as pharma and meal-kit shippers seek sub-two-degree compliance from pickup to doorstep. Dry van leads with 43.78% of the North America freight brokerage services market size in 2025, yet spot-rate volatility remains high because of chassis shortages at West Coast ports.
Autonomous trials favor reefers that run overnight when traffic is low, boosting asset utilization. Brokers deploy telematics hubs that capture temperature spikes and push proactive alerts, reducing OS&D claims. Tanker and flatbed niches hold stable revenue but add complexity through hazmat and over-dimensional permits, insulating niche brokers from algorithmic commoditization across the North America freight brokerage services market[4]“Transportation Energy Data Book.” 2024, U.S. Department of Energy, tedb.ornl.gov.
By Haul Length: Local Services Surge on Last-Mile Demand
Local haul under one-hundred miles is forecast to post an 11.03% CAGR, reflecting micro-fulfillment expansion near major population centers. Pool distribution nodes in Atlanta and Toronto rely on brokers to stitch together courier fleets, box trucks, and final-mile partners. Long-haul still frames 64.18% of the North America freight brokerage services market share in 2025, yet driver shortages and hours-of-service limits pressure cost structure. Once autonomous corridors open statewide in Texas, brokers expect unmanned line hauls to lower per-mile cost by 11%, shifting human drivers to urban segments.
Regional moves between one hundred and five hundred miles connect nearshoring factories with border warehouses, benefiting brokers with bilingual dispatchers. Route optimization differs by distance, forcing brokers to maintain separate pricing tables and KPI dashboards for each haul band inside the North America freight brokerage services market.
By Business Model: Digital Platforms Disrupt Traditional Intermediation
Digital freight intermediaries are scaling at a 21.43% CAGR, though traditional firms still held 58.28% share in 2025. Many legacy brokers now white-label load-matching engines from SaaS vendors to offer instant API tenders. Asset-based hybrids bundle tractor capacity during seasonal spikes, gaining leverage in bid rounds. Agent networks grapple with AB5 risk, driving conversion of 1099 agents into W-2 employees or franchisees.
The North America freight brokerage services market size for digital platforms is set to top significantly by 2031, signaling that technology capability is no longer optional. Competitive gaps narrow around data quality, carrier payment speeds, and exception-handling skill rather than interface aesthetics alone.
By End-User Industry: E-Commerce Disrupts Manufacturing Dominance
Manufacturing and automotive freight kept a 31.07% slice of 2025 revenue, anchored by just-in-time part flows from Mexican Tier 1 suppliers to US assembly plants. E-commerce and 3PL fulfillment revenue is rising at 14.91% CAGR, projected to command a significant part of the North America freight brokerage services market size by 2031. Brokers bundle reverse logistics, photo-verified proof of delivery, and oversized-item pickup to serve direct-to-consumer brands.
Construction freight tracks infrastructure bill funding and remains cyclical. Oil, gas, and chemical loads require hazmat endorsements, carving out high-barrier niches. Healthcare shipments demand a chain-of-custody, driving broker investment in ambient sensors and secure facilities along critical corridors.
By Customer Size: SME Adoption Accelerates Through Digital Access
Small businesses under USD 10 million revenue are expanding at 12.59% CAGR because self-service portals now auto-price single-pallet moves. Embedded financing clears credit checks within minutes, reducing manual interventions once common in the North America freight brokerage services industry. Large enterprises still provide 61.72% of absolute volume, sustaining demand for dedicated control-tower teams and quarterly KPI scorecards.
Mid-market firms graduate from spot boards to contracted capacity as sales grow, representing a fertile upsell channel for technology-led brokers. Account-based marketing paired with AI lead scoring targets shippers most likely to shift from analog to digital tendering in the next twelve months.
Geography Analysis
United States operations generated 85.50% of the 2025 value for the North America freight brokerage services market. Dense interstate corridors, abundant warehousing, and FMCSA oversight foster advanced brokerage practices. Chicago, Dallas, and Los Angeles anchor load boards with five-digit daily postings, enabling 24-hour rate discovery. The April 2026 ELD enforcement purge of 5,000 non-compliant devices boosts demand for brokers that screen carrier hours in real time and maintain alternative capacity when violations trigger out-of-service orders.
Canada contributes steady long-haul volumes between Alberta resource fields and Ontario manufacturing belts. The country’s smaller fleet base elevates broker value in balancing backhauls from Montreal to Vancouver. Seasonal weather swings raise the premium on carriers with winter-spec equipment, prompting brokers to track tire chain regulations and freeze-protect requirements.
Mexico is advancing at an 8.61% CAGR as automotive and electronics nearshoring fills cross-border lanes with predictable volume. OEM clusters around Guanajuato and Nuevo León export finished goods northbound while importing US plastics and steel southbound, creating round-trip efficiency opportunities for brokers owning bilingual dispatch and in-house customs brokerage licenses. Investments in the La Tijera interchange and the Colombia Solidarity Bridge expand capacity, though wait-time variability keeps broker optimization critical.
Mordor Intelligence provides coverage of the freight brokerage services market across other key regional markets, including Europe, each with their regulatory frameworks and demand patterns. Detailed country-level analysis extends to Canada, Germany, Spain, Spain, Netherlands, Poland, Russia, and Mexico incorporating local coverage and market participation, as required.
Competitive Landscape
Market consolidation is tightening. RXO’s USD 1.025 billion purchase of Coyote Logistics injects 10,000 vetted carriers and sophisticated pricing engines into its platform, raising entry barriers. C.H. Robinson employs AI agents across load planning, invoice audit, and mode shift, slashing manual touches per load by 60%. Schneider National pairs its asset fleets with brokerage to guarantee capacity during holiday peaks, winning multiyear contracts with big-box retailers.
Data access is a flashpoint. The March 2025 tie-up of DAT Solutions and Trucker Tools fuses load-board and visibility data, controlling a double-digit share of rate indices that smaller brokers rely on for pricing. In response, mid-market firms join cooperatives that pool shipment data to negotiate analytics subscriptions. Technology road maps now feature blockchain-anchored carrier identity and API-first document exchange to curb a 600% fraud surge.
Niche specialists thrive in refrigerated, hazmat, and project cargo, where regulatory hurdles protect margins. Digital upstarts chase shipper pain points like CO₂ tracking and real-time detention risk. Yet heavy customer-acquisition spend and thin gross margins force many to partner with incumbents rather than displace them outright within the North America freight brokerage services market.
North America Freight Brokerage Services Industry Leaders
C.H. Robinson Worldwide
Total Quality Logistics (TQL)
RXO
J.B. Hunt Transport Services, Inc.
Echo Global Logistics, Inc.
- *Disclaimer: Major Players sorted in no particular order

Recent Industry Developments
- March 2026: Echo Global Logistics completed its acquisition of ITS Logistics, creating a scaled technology-enabled logistics platform.
- March 2026: Thoma Bravo agreed to acquire WWEX Group and combine it with Auctane, linking WWEX’s parcel and freight brokerage brands.
- March 2026: Redwood Logistics acquired EELCO, strengthening S–Mexico cross-border logistics with licensed customs brokerage, Foreign-Trade Zone operations, Laredo warehousing, and Mexico border expertise, supporting nearshoring-led freight flows.
- January 2026: C.H. Robinson launched AI agents to address missed LTL pickups, automating 95% of missed-pickup checks, saving 350+ manual hours per day, and helping freight move up to one day faster for shippers.


North America Freight Brokerage Services Market Report Scope
| Full-Truckload (FTL) |
| Less-than-Truckload (LTL) |
| Others |
| Dry Van |
| Refrigerated Van |
| Flatbed / Step-Deck |
| Tanker (Bulk Liquid and Chemical) |
| Others |
| Long-Haul (More than 500 miles) |
| Regional (100-500 miles) |
| Local (Less than 100 miles) |
| Traditional Freight Brokerage |
| Asset-Based Freight Brokerage |
| Agent Model Freight Brokerage |
| Digital Freight Brokerage |
| Manufacturing and Automotive |
| Construction and Infrastructure Projects |
| Oil, Gas, Mining and Chemicals |
| Agriculture and Food / Beverage |
| Retail, FMCG and Wholesale Distribution |
| Healthcare and Pharmaceuticals |
| E-commerce and 3PL Fulfilment |
| Other End-User Industry |
| Large Enterprise Shippers (More than USD 100 M) |
| Mid-Market Shippers (USD 10–100 M) |
| Small Businesses (Less than USD 10 M) |
| United States |
| Canada |
| Mexico |
| By Service | Full-Truckload (FTL) |
| Less-than-Truckload (LTL) | |
| Others | |
| By Equipment / Trailer Type | Dry Van |
| Refrigerated Van | |
| Flatbed / Step-Deck | |
| Tanker (Bulk Liquid and Chemical) | |
| Others | |
| By Haul Length | Long-Haul (More than 500 miles) |
| Regional (100-500 miles) | |
| Local (Less than 100 miles) | |
| By Business Model | Traditional Freight Brokerage |
| Asset-Based Freight Brokerage | |
| Agent Model Freight Brokerage | |
| Digital Freight Brokerage | |
| By End-User Industry | Manufacturing and Automotive |
| Construction and Infrastructure Projects | |
| Oil, Gas, Mining and Chemicals | |
| Agriculture and Food / Beverage | |
| Retail, FMCG and Wholesale Distribution | |
| Healthcare and Pharmaceuticals | |
| E-commerce and 3PL Fulfilment | |
| Other End-User Industry | |
| By Customer Size | Large Enterprise Shippers (More than USD 100 M) |
| Mid-Market Shippers (USD 10–100 M) | |
| Small Businesses (Less than USD 10 M) | |
| By Geography | United States |
| Canada | |
| Mexico |


Key Questions Answered in the Report
How big is the North America freight brokerage services space expected to get by 2031?
It is forecast to reach USD 35.09 billion, up from USD 24.59 billion in 2026, reflecting a 7.37% CAGR.
Why are small businesses becoming a larger share of broker clientele?
Small businesses are scaling at a 12.59% CAGR as self-service portals lower entry barriers and streamline booking.
Where is the strongest geographic upside over the next five years?
Mexico, supported by nearshoring in automotive and electronics, is projected to post an 8.61% CAGR.
In what ways is technology redefining broker operations?
AI agents already price lanes and process over 3 million annual shipment tasks, cutting quote-to-accept cycles from hours to minutes and boosting margin capture.
What regulatory changes are moving the needle for intermediaries?
FMCSA’s 2026 electronic-logging-device purge and California’s AB5 co-employment enforcement are raising compliance costs and accelerating consolidation among well-capitalized brokers.
Page last updated on:


