North America International Express Service Market Size and Share
Market Overview
| Study Period | 2018 - 2031 |
|---|---|
| Forecast Data Period | 2026 - 2031 |
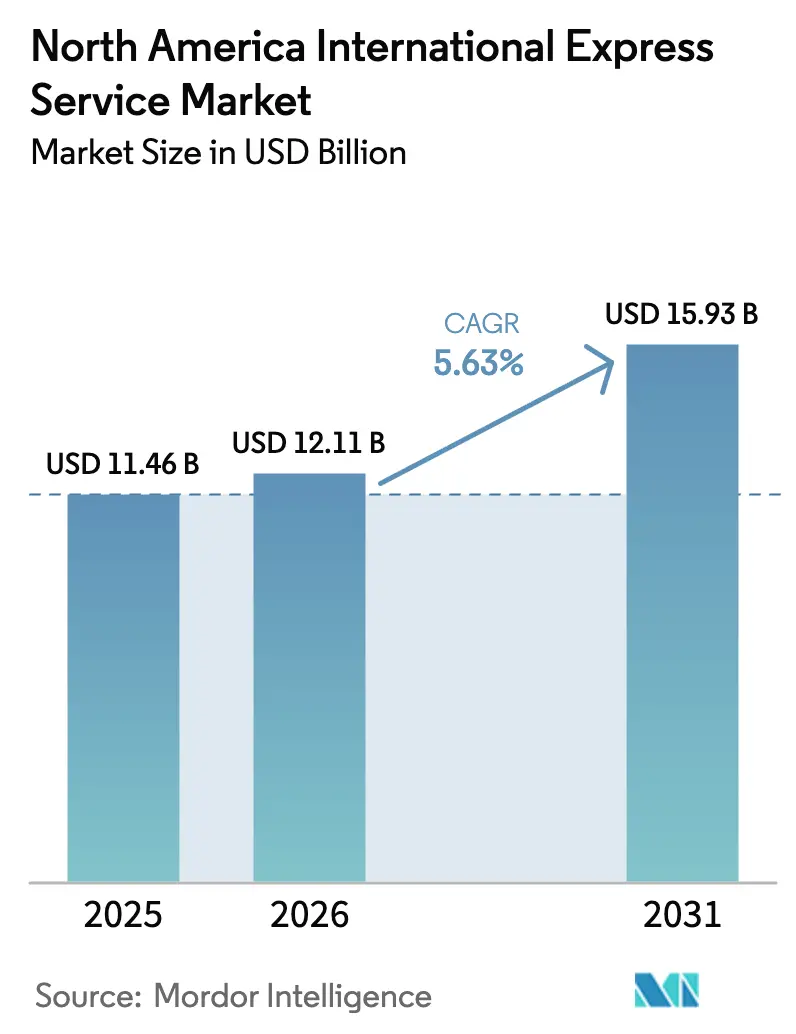
| Base Year Market Size (2025) | USD 11.46 Billion |
| Market Size (2026) | USD 12.11 Billion |
| Market Size (2031) | USD 15.93 Billion |
| Growth Rate (2026 - 2031) | 5.63% CAGR |
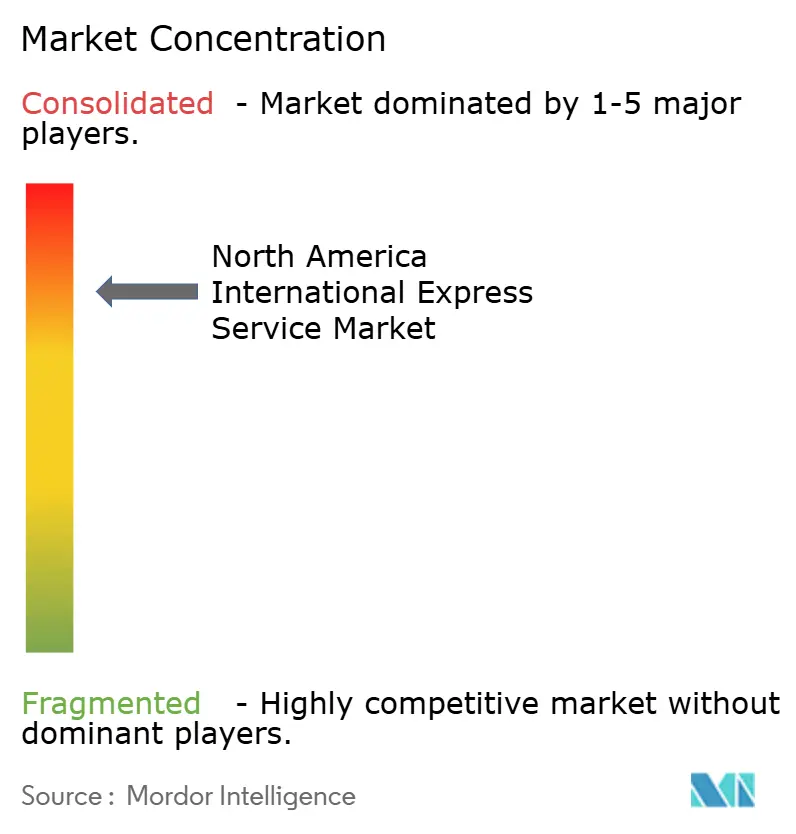
| Market Concentration | High |
Major Players*Disclaimer: Major Players sorted in no particular order Image © Mordor Intelligence. Reuse requires attribution under CC BY 4.0. | |
North America International Express Service Market Analysis by Mordor Intelligence
The North America international express service market size was valued at USD 11.46 billion in 2025 and estimated to grow from USD 12.11 billion in 2026 to reach USD 15.93 billion by 2031, at a CAGR of 5.63% during the forecast period (2026-2031). Robust cross-border trade flows, sustained e-commerce momentum, and near-shoring of manufacturing into Mexico underpin this steady expansion. Retailers have widened next-day and same-day delivery options to retain online shoppers, while healthcare and automotive customers continue to demand temperature-controlled and time-definite delivery. Integrators strengthen capacity through technology investments and strategic partnerships, yet route-level congestion, rising security risks, and potential tariff shifts temper the growth outlook.
Key Report Takeaways
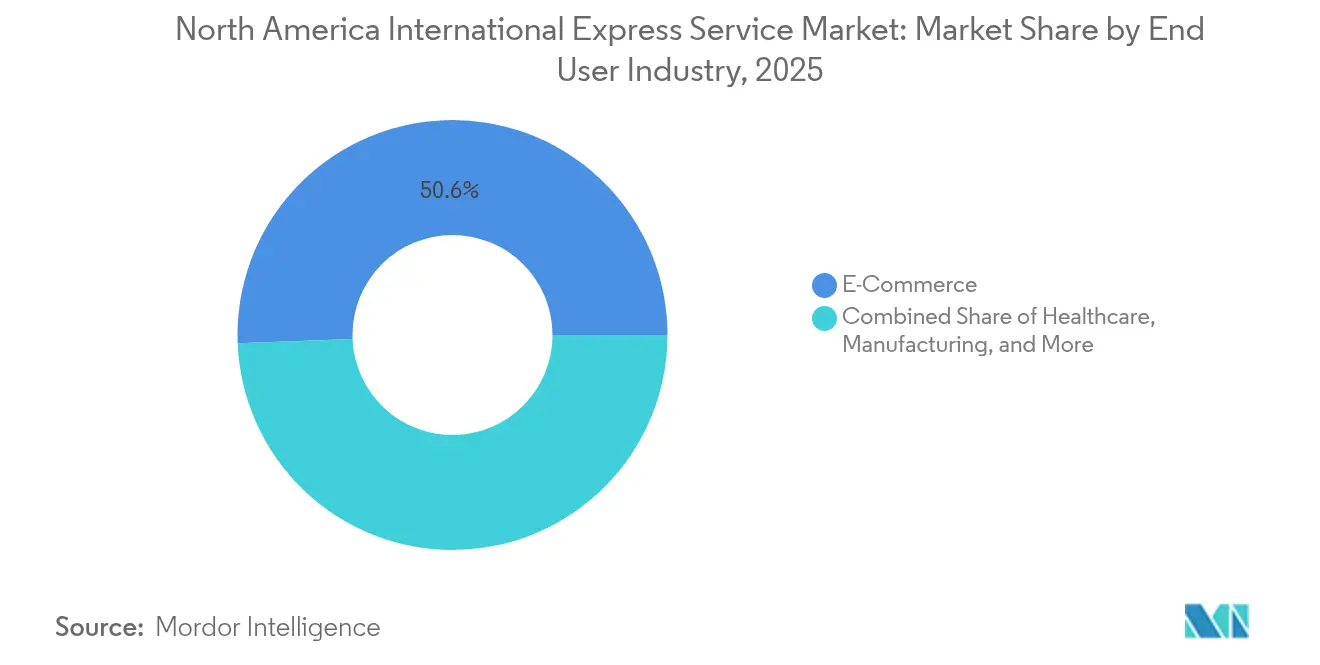
- By end user industry, e-commerce led with 50.62% revenue share in 2025; healthcare is projected to expand at a 6.05% CAGR between 2026-2031.
- By shipment weight, light-weight parcels accounted for 68.65% of the North America international express service market share in 2025, while medium-weight parcels are advancing at a 5.18% CAGR between 2026-2031.
- By route, inter-region services held 72.40% share of the North America international express service market size in 2025, and intra-region services are forecast to grow at a 4.72% CAGR between 2026-2031.
- By country, the United States commanded 78.85% share of the revenue in 2025; Mexico exhibits the highest projected CAGR at 7.02% between 2026-2031.
Note: Market size and forecast figures in this report are generated using Mordor Intelligence’s proprietary estimation framework, updated with the latest available data and insights as of 2026.
North America International Express Service Market Trends and Insights
Drivers Impact Analysis*
| Driver | (~) % Impact on CAGR Forecast | Geographic Relevance | Impact Timeline |
|---|---|---|---|
| Surge in cross-border e-commerce shipments | +1.8% | Global, with concentration in US-Mexico and US-Canada corridors | Medium term (2-4 years) |
| USMCA-driven manufacturing near-shoring boom | +1.5% | Mexico, US border states, select Canadian provinces | Long term (≥ 4 years) |
| Federal funding for North-American digital trade-corridor projects | +0.9% | Canada (NTCF program), US infrastructure corridors | Long term (≥ 4 years) |
| Retailers adopting "one-hour international" delivery promises | +0.7% | Major metropolitan areas across US-Canada and US-Mexico borders | Short term (≤ 2 years) |
| AI-based dynamic route-optimization platforms | +0.6% | Global, with early adoption in high-density corridors | Medium term (2-4 years) |
| Drone-enabled cross-border parcel lanes | +0.4% | Select US-Canada border regions, pilot programs | Long term (≥ 4 years) |
| Source: Mordor Intelligence | |||


Surge in Cross-Border E-Commerce Shipments
Online marketplaces funnel larger parcel volumes through express lanes as consumers grow accustomed to reliable international delivery. U.S. and Canadian shoppers order directly from Mexican fulfillment hubs, leveraging de-minimis thresholds and enhanced customs pre-clearance programs. Retailers intensify same-day promotions to reduce cart abandonment, prompting carriers to add late-cutoff pick-ups and automate sortation centers near border gateways. Marketplaces also integrate multi-carrier API solutions for real-time duty calculation and tracking, improving transparency and sustaining demand across the North America international express service market[1]Mexecution, “USMCA Nearshoring in Mexico: 2025 Trade, Tariffs & Opportunities,” mexecution.com.
USMCA-Driven Manufacturing Near-Shoring Boom
Automotive, electronics, and medical device manufacturers relocate assembly lines from Asia into northern Mexico to shorten lead times and mitigate geopolitical risks. Approximately 4 million vehicles were produced in Mexico during 2024, and related exports reached USD 193.9 billion—31.4% of the country’s outbound trade[2]MundoMaritimo, “Nearshoring Moves From Theory to Reality,” mundomaritimo.net. Just-in-time operations require daily flows of power-train components, printed circuit boards, and testing equipment to U.S. plants, pushing carriers to create scheduled middle-mile shuttles with guaranteed customs windows. This supply-chain redesign will contribute materially to the North America international express service market through 2030.
Federal Funding for North-American Digital Trade-Corridor Projects
Infrastructure programs such as Canada’s CAD 4.3 billion (USD 3 billion) National Trade Corridors Fund enhance border rail, road, and air-cargo connectivity, boosting express reliability[3]Government of Canada, “National Trade Corridors Fund,” canada.ca. Concurrent U.S. INFRA and MEGA grants expand intermodal capacity near Laredo and Detroit-Windsor, while Mexico’s Puerto del Norte port, inaugurated in August 2025, accelerates ocean-air transfers into regional express networks. Digital customs pilots introduce blockchain documentation to cut clearance times, magnifying throughput for premium parcel lanes.
Retailers Adopting “One-Hour International” Delivery Promises
Major brands now market sub-hour transit between paired metros such as El Paso–Ciudad Juárez and Detroit–Windsor. FedEx International Next Flight guarantees pick-up within 60 minutes and door-to-door service across 220 countries, setting a higher service bar for regional competitors. Regional specialists leverage C-TPAT and FAST certifications to pre-stage consignments near ports of entry, while on-board couriers bridge overnight gaps for critical spare parts. The resulting service escalation propels premium-priced shipments within the North America international express service market.
Restraints Impact Analysis*
| Restraint | (~) % Impact on CAGR Forecast | Geographic Relevance | Impact Timeline |
|---|---|---|---|
| Persistent US–Mexico border congestion | -1.2% | US-Mexico border crossings, particularly Laredo and El Paso corridors | Medium term (2-4 years) |
| Shortage of IATA-certified cold-chain capacity | -0.8% | North America, with acute shortages in pharmaceutical corridors | Short term (≤ 2 years) |
| Rising insurance premia for high-value parcels | -0.6% | Global, concentrated in high-theft regions (California, Texas, Illinois) | Short term (≤ 2 years) |
| De-minimis loophole scrutiny and potential duty hikes | -0.5% | US inbound international express, particularly from Asia via Mexico | Medium term (2-4 years) |
| Source: Mordor Intelligence | |||
Persistent U.S.–Mexico Border Congestion
The Port of Laredo processes goods valued at more than USD 800 million every day, crowding inspection bays and reducing schedule reliability during peak seasons. Carriers invest in exclusive docking stations and predictive queue-management software, yet infrastructure expansion trails volume growth, compressing on-time performance across the North America international express service market.
De-Minimis Loophole Scrutiny and Potential Duty Hikes
Revisions to U.S. Section 321 rules removed de-minimis status for tariff-listed items in 2024, forcing shippers to submit full formal entries on a broader product set[4]FreightWaves, “Borderlands Mexico: Surging Cross-Border Flows a Boon for Operators,” freightwaves.com. Additional proposals to lower value thresholds could lengthen customs processing and add compliance costs. Express operators develop automated documentation modules and tariff-classification engines to preserve clearance speed, but uncertainty may still restrain small-parcel velocity.
*Our forecasts treat driver/restraint impacts as directional, not additive. The impact forecasts reflect baseline growth, mix effects, and variable interactions.
Segment Analysis
By End User Industry: Healthcare Drives Premium Growth
Healthcare accounted for a minor share of the North America international express service market in 2025, yet it is on track for a 6.05% CAGR between 2026-2031, outpacing all peer industries. Temperature-controlled biologics, oncology drugs, and clinical trial samples demand validated packaging and continuous monitoring, which command premium surcharges. The North America international express service market size for healthcare consignments is forecast to climb steadily as pharmaceutical producers co-locate near U.S. demand hubs. E-commerce, although already dominant with a share of 50.62% of 2025 revenues, continues to broaden SKU variety and cross-border penetration, ensuring baseline volume stability. Manufacturing, especially automotive and electronics, sustains predictable weekday flows of calibrated tooling and semi-finished assemblies.
Carriers allocate capex toward GDP-compliant storage, dry-ice replenishment chambers, and IR-based geo-fencing alerts to capture healthcare wallet share. UPS’s 2025 acquisition of Andlauer Healthcare Group adds 1.6 million sq ft of cold-chain warehousing in Canada, enabling direct injection into overnight networks. These investments deepen barriers to entry and push competitors to pursue strategic alliances or focus on niche value propositions within the broader North America international express service industry.


By Shipment Weight: Medium Parcels Gain Momentum
Light-weight parcels remain the high-volume backbone, yet medium-weight parcels are the fastest riser, with a 5.18% CAGR expected between 2026-2031. Automotive plants in Nuevo León and Coahuila routinely require brake assemblies, infotainment units, and battery modules that eclipse light-parcel thresholds but still fit express air containers. As a result, the North America international express service market size attributed to medium parcels is widening each year.
Network planners re-engineer conveyor profiles and load-planning algorithms to handle bulkier SKUs without degrading sortation speed. Weight-based surcharges are recalibrated to protect yields while remaining competitive against expedited less-than-truckload alternatives. Consistent growth across medium-weight flows underscores the evolving composition of the North America international express service market and the shift toward just-in-time industrial logistics.

By Route: Intra-Regional Services Expand
Inter-region lanes dominate at 72.40% in 2025 because traditional international express connects distant trading partners. Nonetheless, intra-region volumes—shipments moving within border-spanning metro areas—are accelerating at a 4.72% CAGR between 2026-2031. Same-day road linehauls link Dallas-Fort Worth fulfillment centers with Monterrey consumer districts, while operator-managed PUDO lockers simplify last-mile handoff in both currencies.
Regional specialists collaborate with customs authorities to pilot blockchain-based advanced data submissions, cutting door-to-door cycle time by 30 minutes on average. This densification of short-haul cross-border drops positions intra-regional parcels as a stable growth pillar of the North America international express service market through the next five years.
Geography Analysis
The United States contributes the largest volume to the North America international express service market with 78.85% in 2025, reflecting its broad consumer base, dense distribution infrastructure, and high share of premium-priced healthcare and technology shipments. Major gateways such as Los Angeles, Chicago, and New York handle lifeline connections to Europe and Asia, while southern hubs like Laredo and El Paso orchestrate bulk flows into Mexico. Express operators continue to automate secondary sort centers and deploy electric step vans for urban final-mile, reinforcing service speed and emissions compliance.
Mexico delivers the most rapid expansion, projected at a 7.02% CAGR between 2026-2031 as foreign direct investment in manufacturing climbs and consumer purchasing power increases. New industrial parks near Monterrey and Saltillo integrate bonded express zones that pre-clear incoming tools and consumables, reducing plant downtime. Meanwhile, the inclusion of Puerto del Norte as a multipurpose port grants manufacturers an additional gateway, shrinking maritime lead times by up to five hours relative to Altamira.
Canada maintains stable, mid-single-digit growth supported by automotive exports from Ontario and an uptick in life-science shipments through Montréal and Toronto, facilitated by National Trade Corridors Fund grants. Outlying Central American and Caribbean nations register modest shares but benefit from proximity to Miami’s express freight cluster, which consolidates air cargo swaps into Latin America. Altogether, geographic diversification supports a balanced revenue mix, cushioning the North America international express service market against isolated economic shocks.
Competitive Landscape
Traditional integrators—FedEx, UPS, and DHL—retain scale advantages in linehaul networks, customs brokerage depth, and global account penetration. Each devotes substantial outlays to AI-powered route optimization, automated sortation, and carbon-neutral fleet transition, aiming to compress operating costs while defending service level leadership. In 2025, FedEx completed phase one of its Nimble robotics deployment, integrating autonomous fulfillment cells across five U.S. distribution centers to lift cube utilization and accelerate e-commerce order processing.
Mid-tier challengers such as Asendia and OnTrac hone cross-border niche services, offering bundled customs documentation and returns management that appeal to small and mid-size merchants. Regional specialists exploit proximity to border crossings, leveraging C-TPAT credentials to carve out same-day lanes between Canadian and U.S. cities or across the Rio Grande. Technology platforms entering the North America international express service industry aggregate spot capacity, match shippers to optimal routes in real time, and provide embedded cargo insurance, pressuring incumbents to unbundle services and revisit pricing grids.
Strategic acquisitions intensify. UPS’s CAD 2.2 billion (USD 1.56 billion) purchase of Andlauer in April 2025 strengthens GDP-compliant services in Canada, while DHL earmarks EUR 1 billion (USD 1.16 billion) for temperature-controlled warehouses across North America. GLS binds its U.S. subsidiary with a 40-country European parcel mesh, establishing predictable two-way transatlantic corridors and tapping latent small-business demand. As competitive levers shift toward specialization, integration, and data-driven efficiency, market participants upgrade value propositions to defend share in the growing North America international express service market.
North America International Express Service Industry Leaders
DHL Group
FedEx
International Distributions Services (including GLS)
OnTrac
United Parcel Service of America, Inc. (UPS)
- *Disclaimer: Major Players sorted in no particular order

Recent Industry Developments
- April 2025: DHL Group committed EUR 2 billion (USD 2.20 billion) over five years, with half allocated to the Americas, to expand life-science and healthcare logistics capacity.
- April 2025: UPS finalized the CAD 2.2 billion (USD 1.6 billion) acquisition of Andlauer Healthcare Group, broadening cold-chain reach across Canada.
- January 2025: GLS Group completed the technical linkage of GLS US and its European network, enabling direct parcel routing covering 40 countries.
- September 2024: FedEx invested in Nimble to advance autonomous e-commerce fulfillment, integrating robotics into FedEx Fulfillment operations.


North America International Express Service Market Report Scope
Heavy Weight Shipments, Light Weight Shipments, Medium Weight Shipments are covered as segments by Shipment Weight. Inter-Region, Intra-Region are covered as segments by Route. E-Commerce, Financial Services (BFSI), Healthcare, Manufacturing, Primary Industry, Wholesale and Retail Trade (Offline), Others are covered as segments by End User Industry. Canada, Mexico, United States are covered as segments by Country.| Heavy Weight Shipments |
| Light Weight Shipments |
| Medium Weight Shipments |
| Inter-Region |
| Intra-Region |
| E-Commerce |
| Financial Services (BFSI) |
| Healthcare |
| Manufacturing |
| Primary Industry |
| Wholesale and Retail Trade (Offline) |
| Others |
| Canada |
| Mexico |
| United States |
| Rest of North America |
| Shipment Weight | Heavy Weight Shipments |
| Light Weight Shipments | |
| Medium Weight Shipments | |
| Route | Inter-Region |
| Intra-Region | |
| End User Industry | E-Commerce |
| Financial Services (BFSI) | |
| Healthcare | |
| Manufacturing | |
| Primary Industry | |
| Wholesale and Retail Trade (Offline) | |
| Others | |
| Country | Canada |
| Mexico | |
| United States | |
| Rest of North America |


Market Definition
- Courier, Express, and Parcel - The Courier, Express, and Parcel services, often called as CEP Market, refers to the logistics and postal service providers which specialize in moving small goods (parcels/packages). It captures the overall market size (USD) and market volume (number of parcels) of (1) the shipments/parcels/packages which are under 70kgs/ 154lbs weight, (2) Business Customer packages viz. Business-to-Business (B2B) & Business-to-Consumer (B2C) as well as private customer packages (C2C), (3) non-express parcel delivery services (Standard and Deferred) as well as express parcel delivery services (Day-Definite-Express and Time-Definite-Express), (4) domestic as well as international shipments.
- Demographics - To analyse total addressable market demand, population growth & forecasts have been studied and presented in this industry trend. It represents population distribution across categories like gender (male/female), development area (urban/rural), major cities among other key parameters like population density and final consumption expenditure (growth and share % of GDP). This data has been used for assessing the fluctations in demand & consumption expenditure, and the major hotspots (cities) of potential demand.
- Domestic Courier Market - Domestic Courier Market refers to the CEP shipments wherein the origin and destination is within the boundary of the geography studied (country or region as per the scope of report). It captures the market size (USD) and market volume (number of parcels) of (1) the shipments/parcels/packages which are under 70kgs/ 154lbs weight, including light weight shipments, medium weight shipments and heavy weight shipments (2) Business Customer packages viz. Business-to-Business (B2B) & Business-to-Consumer (B2C) as well as private customer packages (C2C), (3) non-express parcel delivery services (Standard and Deferred) as well as express parcel delivery services (Day-Definite-Express and Time-Definite-Express).
- E-Commerce - This end user industry segment captures the external (outsourced) logistics expenditure incurred by the e-tailers, through online sales channel, on Courier, Express, and Parcel (CEP) services. The scope includes (i) the supply chain of a company's online customer orders being fulfilled, (ii) the process of getting a product from the point of manufacturing to the point at which it is delivered to consumers. It involves managing inventory (deferred as well as time critical), shipping, and distribution.
- Export Trends and Import Trends - Overall logistics performance of an economy is positively and significantly (statistically) correlated to its trade performance (exports and imports). Hence, in this industry trend, total value of trade, major commodities/ commodity groups and the major trade partners, for the studied geography (country or region as per the scope of report) have been analysed alongside the impact of major trade/logistics infrastructure investments & regulatory environment.
- Financial Services (BFSI) - This end user industry segment captures the external (outsourced) logistics expenditure incurred by the BFSI players, on Courier, Express, and Parcel (CEP) services. CEP is important to the financial services industry in shipping of confidential documents and files. The establishments in this sector are engaged in (i) financial transactions (that is, transactions involving the creation, liquidation, or change in ownership of financial assets) or in facilitating financial transactions, (ii) financial intermediation, (iii) the pooling of risk by underwriting annuities and insurance, (iv) providing specialized services that facilitate or support financial intermediation, insurance and employee benefit programs, and (v) monetary control - the monetary authorities.
- Fuel Price - Fuel price spikes can cause delays and diruption for logistics service providers (LSPs), while drops in the same can result in higher short-term profitability and increased market rivalry to offer consumers with the best deals. Hence, the fuel price variations have been studied over the review period and presented along with the causes as well as market impacts.
- GDP Distribution by Economic Activity - Nominal Gross Domestic Product and distribution of the same, across major economic sectors in the geography studied (country or region as per scope of the report) have been studied and presented in this industry trend. As GDP is positively related to the profitability and growth of logistics industry, this data has been used in adjunction to the input-output tables/ supply-use tables for analyzing the potential major contributing sectors towards the logistics demand.
- GDP Growth by Economic Activity - Growth of Nominal Gross Domestic Product across major economic sectors, for the geography studied (country or region as per scope of the report) have been presented in this industry trend. This data has been utilized for assessing the growth of logistics demand from all the market end users (economic sectors considered here).
- Healthcare - This end user industry segment captures the external (outsourced) logistics expenditure incurred by the Healthcare players (Hospitals, clinics, mrdical centres) , on Courier, Express, and Parcel (CEP) services. The scope includes CEP services involved in the defrerred as well time critical movement of medical goods & supplies (surgical supplies and instruments, including gloves, masks, syringes, equipment). The establishments in this sector (i) include the ones providing medical care exclusively (ii) deliver services by trained professionals (iii) involve processes, including labor inputs of health practitioners with the requisite expertise (iv) are defined based on the educational degree held by the practitioners included in the industry.
- Inflation - Variations in both Wholesale Price Inflation (YoY change in producer price index) and Consumer Price Inflation have been presented in this industry trend. This data has been used to assess the inflationary environment as it plays a vital role in smooth functioning of the supply chain, directly impacting the logistics operational cost components e.g., pricing of tyres, driver wages & benefits, energy/fuel prices, maintenace costs, toll charges, warehousing rents, custom brokerage, forwarding rates, courier rates etc. hence impacting the overall freight and logistics market.
- Infrastructure - As infrastructure plays a vital role in an economy's logistics performance, variables like length of roads, distribution of road length by surface category (paved v/s unpaved), distribution of road length by road classification (expressways v/s highways v/s other roads), rail length, volume of containers handled by major ports and tonnage handled by major airports have been analysed and presented in this industry trend.
- International Express Service Market - International Express Service Market refers to the CEP shipments wherein the origin or destination is not within the boundary of the geography studied (country or region as per the scope of report). It captures the market size (USD) and market volume (number of parcels) of (1) the shipments/parcels/packages which are under 70kgs/ 154lbs weight, including light weight shipments, medium weight shipments and heavy weight shipments (ii) Inter-Region as well as Intra-Region Shipments
- Key Industry Trends - The report section named "Key Industry Trends" include all the key variables/parameters studied to better analyze the market size estimates and forecasts. All the trends have been presented in the form of data points (time series or latest available data points) along with analysis of the paramter in the form of concise market relevant commentary, for the geography studied (country or region as per the scope of report).
- Key Strategic Moves - The action taken by a company to differentiate from its competitor or used as a general strategy is referred to as a key strategic move (KSM). This includes (1) Agreements (2) Expansions (3) Financial Restructuring (4) Mergers and Acquisitions (5) Partnerships, and (6) Product Innovations. Key players (Logistics Service Providers, LSPs) in the market have been shortlisted, their KSM have been studied and presented in this section.
- Logistics Performance - Logistics Performance and Logistics Costs are the backbone of trade, and influences trade costs, making countries compete globally. Logistics performance is influenced by market wide adopted supply chain management strategies, government services, investments & policies, fuel/ energy costs, inflationary environment etc. Hence, in this industry trend, the logistics performance of the geography studied (country/ region as per the scope of report) has been analysed and presented over the review period.
- Manufacturing - This end user industry segment captures the external (outsourced) logistics expenditure incurred by the Manufacturing industry (including Hi-Tech/Technology) players, on Courier, Express, and Parcel (CEP) services. The end user players considered are the establishments primarily engaged in the chemical, mechanical or physical transformation of materials or substances into new products. Logistics Service Providers (LSPs) play a crucial role in maintaining a smooth flow of raw materials across the supply chain, enabling timely delivery of finished goods to distributors or end customers and storing & supplying the raw materials to clients for just-in-time manufacturing.
- Other End Users - Other end user segment captures the external (outsourced) logistics expenditure incurred by the construction, real estate, educational services, and professional services (administrative, waste management, legal, architectural, engineering, design, consulting, scientific R&D), on Courier, Express, and Parcel (CEP) services. Logistics Service Providers (LSPs) plays a crucial role in the reliable movement of time critical supplies and documents to/from these industries such as transporting any equipment or resources required, shipping confidential documents and files.
- Primary Industry - This end user industry segment captures the external (outsourced) logistics expenditure incurred by the AFF (Agriculture, Fishing, and Forestry) and Extraction indsutry (Oil &Gas, Quarrying and Mining) players, on Courier, Express, and Parcel (CEP) services. The end user players considered are the establishments (i) primarily engaged in growing crops, raising animals, harvesting timber, harvesting fish & other animals from their natural habitats and providing related support activities; (ii) that extract naturally occurring mineral solids, such as coal and ores; liquid minerals, such as crude petroleum; and gases, such as natural gas. Herein, Logistics Service Providers (LSPs) (i) play a crucial role in acquisition, storage, handling, transportation, and distribution activities for the optimal & continuous flow of inputs (seeds, pesticides, fertilizers, equipment, and water) from manufacturers or suppliers to the producers and smooth flow of output (produce, agro-goods) to distributors/ consumers; (ii) cover entire phases from upstream to downstream and play a crucial role in the transportation of machinery, drilling equipments, extracted minerals, crude oil & natural gas and refined/ processed products from one place to another. This includes both termperature controlled and non-temperature controlled logistics, as and when required according to the shelf life of goods being transported or stored.
- Producer Price Inflation - It indicates inflation from viewpoint of the producers viz. the average selling price received for their output over a period of time. Annual change (YoY) of producer price index is reported as wholesale price inflation in the "Inflation" industry trend. As WPI captures dynamic price movements in most comprehensive way, it is widely used by governments, banks, industry, business circles and is deemed important in formulation of trade, fiscal and other economic policies. The data has been used in adjunction to consumer price inflation for better understanding the inflationary environment.
- Segmental Revenue - Segmental Revenue has been triangulated or computed and presented for all the major players in the market. It refers to the courier, express, and parcel (CEP) market specific revenue earned by the company, over the base year of study, in the geography studied (country or region as per the scope of report). It is computed through the study and analysis of major parameters like financials, service portfolio, employee strength, fleet size, investments, number of countries present in, major economies of concern, etc. that have been reported by the company in its annual reports, webpage. For companies having scarce financial disclosures, paid databases like D&B Hoovers, Dow Jones Factiva have been resorted to and verified through industry/expert interactions.
- Transport and Storage Sector GDP - Value and growth of Transport and Storage Sector GDP has a direct relation to the freight and logistics market size. Hence, this variable has been studied and presented over the review period, in value terms (USD) and as share % of total GDP, in this industry trend. The data has been supported by concise and relevant commentary around the investments, developments, and current market scenario.
- Trends in E-Commerce Industry - Enhanced internet connectivity and boom in smartphone penetration, coupled with increasing disposable incomes, has led to a phenomenal growth in the e-commerce market globally. Online shoppers require fast and efficient delivery of their orders leading to an increase in the demand for logistics services especially e-commerce fulfilment services. Hence, the Gross Merchandise Value (GMV), historial and projected growth, breakup of major commodity groups in e-commerce industry for the studied geography (country or region as per scope of the report) have been analysed and presented in this industry trend.
- Trends in Manufacturing Industry - Manufacturing industry involves the transformation of raw materials into finished products, while logistics industry ensures the efficient flow of raw materials to the factory, and the transport of manufactured products to the distributors & consumers. Demand-Supply of both industries are highly cross-linked and critical for a seamless supply chain. Hence, the Gross Value Added (GVA), breakup of GVA into major manufacturing sectors, and growth of manufacturing industry over the review period have been analysed and presented, in this industry trend.
- Wholesale and Retail Trade (Offline) - This end user industry segment captures the external (outsourced) logistics expenditure incurred by the wholesalers and retailers, through offline sales channel, on Courier, Express, and Parcel (CEP) services. The end user players considered are the establishments primarily engaged in wholesaling or retailing merchandise, generally without transformation, and rendering services incidental to the sale of merchandise. Logistics Service Providers (LSPs) plays a crucial role in the reliable movement of supplies to and finished products from production houses to the distributors and finally to the end customer covering activites like material sourcing, transportation, order fulfillment, warehousing & storage, demand forecasting, inventory management etc.
| Keyword | Definition |
|---|---|
| Axle Load | The axle load refers to the total load (weight) bearing on the roadway through wheels connected to a given axle. Across the globe, there are systems in place to ensure axle load monitoring, wherein surpassing the defined limits set by the concerned regulatory authority can lead to penalty/fine. For transportation of goods via road this can be an important determinant of costs as knowledge about the axle load limits can be used to (i) load the vehicle optimally for maximizing profits (ii) avoid exceeding the same and hence the probable fines associated (iii) avoid wear and tear of the vehicle (iv) avoid damage to pavement resulting in noticeable public maintenance and repair costs (v) achieve better turnaround time. |
| Back Haul | Backhaul is the return movement of a transport vehicle from its original destination to its original point of departure, and can include full, partial, or empty truck loads (all or part of the way) depending on the visibility of the local freight ecosystem. In this regard, transportation of empty containers to the point of origin, known as deadheading is also a significant factor, considering the supply/container shortages across the geographies, resulting in cost escalation and under optimized profit potential attainment. Generally, the carriers offer discounts on the backhaul, to secure freight for the trip. |
| Bill of Lading (BOL) | A bill of lading is a legal contract document issued by a carrier to a shipper to acknowledge reception of their cargo, and is evidence for the contract of carriage between the two parties. Broadly it details the (i) type, quantity, and other specifications of the goods being carried (ii) destination, and terms & conditions of the shipment (iii) carrier and drivers with all the necessary information to process the shipment, which can be used for insurance and customs clearance purposes (iv) assurance that the consignment is damage-free and ready to be shipped to the consignee. In this regard, a house bill of lading (HBL) is a document issued by a freight forwarder or a non-vessel operating common carrier (NVOCC) to acknowledge receipt of items for shipment (to a shipper). If shipments from several shippers are involved a master bill of lading (MBL) might be involved which is a consolidated version of the same for all the shipments being taken care of by the carrier (to a common destination) and might be issued by the carrier to the freight forwarder or the shipper (depending on who books the transport). |
| Bunkering | Bunkering is the process of supplying fuel to power the propulsion system of a ship. It includes the logistics of loading and distributing the fuel among available shipboard tanks. In this regard, (i) Bunker fuel is technically any type of fuel oil used aboard ships. It gets its name from the containers on ships and in ports that it is stored in; in the days of steam they were coal bunkers but now they are bunker-fuel tanks, (ii) Bunker refers to the spaces (Tank) on board a vessel to store fuel, (iii) Bunker trader refers to a person dealing in trade of bunker (fuel), (iv) Bunker call is made when a cargo ship anchors or berths in a port to take on bunker oil or supplies, (v) Bunkering service is the supply of a requested quality and quantity of bunkers to a ship. Bunkering is signficant from point of view of freight rates applicable to the shipper as Bunker Contribution (BUC)/ Fuel Adjustment Factor (FAF)/ Bunker Adjustment Factor (BAF) are applied by shipping lines to offset the effect of fluctuations in the cost of bunkers. |
| Cabotage | Transport by a vehicle registered in a country, performed on the national territory of another country. Cabotage law may restrict domestic cargo traffic to be carried in its own nationally registered, and sometimes built and crewed vehicles, though regulations vary across industries/commodity groups/countries and sometimes specify maximum allowable percentage of cabotage that can be serviced by foreign registered fleet. |
| C-commerce | Collaborative commerce (also known as C-commerce), (i) describes electronically enabled business interactions among an enterprise’s internal personnel, business partners and customers throughout a trading community (industry, industry segment, supply chain or supply chain segment); (ii) is the optimization of supply and distribution channels to capitalize on the global economy by using new technology efficiently. Advantages of C-commerce, to detail few include (i) maximization of organization's efficiency and profitability (ii) technology integration with physical channels to allow companies to work together (iii) increased information exchange such as inventory and product specifications, using the web as an intermediary (iv) increased competitiveness by reaching a broader audience. Examples of C-commerce, also known as peer-to-peer commerce, include (i) companies that allow consumers to rent things from each other, or marketplaces, such as Meta (formerly Facebook) Marketplace, that allow the sale of used goods; (ii) DoorDash teamed up with many national brands, such as McDonald’s and Chipotle, to offer fast food delivery, building their business model on c-commerce. They have since expanded their delivery service from restaurants to retailers and even offer 'fleets' of drivers to businesses. |
| Courier | A business/company that delivers packages/parcels/shipments (upto 70 kgs) including quick door to door pickup and delivery service for goods or documents, domestically or internationally, on a commercial contract basis. Example, DHL Group, FedEx, United Parcel Service of America, Inc., USPS, International Distributions Services, J&T Express, SF Express among several others |
| Cross docking | Cross docking is a practice in logistics management that includes unloading incoming delivery vehicles and loading the materials directly into outbound delivery vehicles, omitting traditional warehouse logistical practices and saving time and money. It requires close synchronization of both inbound and outbound movements. It is highly significant in reduction of costs pertaining to warehousing & storage (and the associated Value Added Services). |
| Cross Trade | International transport between two different countries performed by a vehicle registered in a third country. A third country is a country other than the country of loading/embarkation and the country of unloading/disembarkation. Cross Trade law may restrict international cargo traffic to be carried by respective country's registered vehicles, and sometimes built and crewed vehicles, though regulations vary across industries/commodity groups/countries and sometimes specify maximum allowable percentage of cross trade that can be serviced by foreign registered fleet. |
| Customs Clearance | The process of declaring and clearing cargoes through customs. It includes the procedures involved in getting cargo released by Customs through designated formalities such as presenting import license/permit, payment of import duties and other required documentations by the nature of the cargo. In this regard, a customs broker is a person or company licensed by the respective department of the country to act on behalf of freight importers and exporters. |
| Dangerous Goods | Dangerous goods (or hazardous materials or HAZMAT) include flammable liquids/solids, gases (compressed, liquified, dissolved under pressure), corrosives, oxidising substances, explosive substances and articles, substances which on contact with water emit flammable gasses, organic peroxides, toxic substances, infectious substances, radioactive materials, miscellaneous dangerous goods and articles. |
| First mile Delivery | First mile delivery refers to the (i) first stage of the freight/shipment/cargo/courier transportation (ii) the transportation of goods from a merchant’s premises or warehouse to the next fulfillment centre/warehouse/hub from where the goods are forwarded (iii) shipping goods from local distribution centers to stores (For retailers) (iv) transportation of finished goods from a plant or a factory to a distribution center (For manufacturers), (v) pick up of goods from the end-customer’s home or store followed by movement to a warehouse or storage location (movers and packers), (vi) process where goods are picked up from a retailer and then transferred to third-party logistics providers or courier service providers to be delivered to the end-consumer (e-commerce). Once the package reaches the next warehouse or the courier’s hub, it is then sorted and transported further until it reaches the customer’s doorstep. Example, if one chooses UPS as a courier, first-mile delivery will be the product being delivered from manufacturer's/retailer's warehouse to the UPS’s warehouse/ fulfilment centre. |
| Last Mile Delivery | Last mile delivery refers to the very last step of the delivery process when a parcel is moved from a transportation hub (warehouse or a distribution center or fulfillment centre) to its final destination, which usually is a personal residence/retail store/ business, or parcel locker. It accounts for around half of the total cost involved in entire process of first mile, middle mile, and last mile delivery, though it can vary shipment to shipment, based on commodity, business model and similar factors. |
| Milkrun | A Milk Run is a delivery method used to transport mixed loads from various suppliers to one customer, using lean management principles applied to logistics. Instead of each supplier sending a truck every week to meet the needs of one customer, one truck (or vehicle) visits the suppliers to pick up the loads for that customer. This method of transport got its name from the dairy industry practice, where one tanker used to collect milk from several dairy farms for delivery to a milk processing company. A milk run can be a more efficient way to handle logistics but require proper planning. If the route involves products from different companies, there is need for an agreement about cost-sharing and other aspects of the cooperative delivery arrangement. Once the group settles these issues, this delivery method can save time and money for everyone by pooling operation costs and resources. |
| Multi country consolidation | Multi-Country Consolidation (MCC) is a cost-effective solution that consolidates one's cargo from different countries of origin to build Full Container Loads (FCL). MCC is most suitable for companies that import light volumes of goods from multiple countries but want to take advantage of the more economic FCL freight rates. Apart from costing some of the other advantages include (i) flexibility to choose suppliers from a wider range of origin countries without worrying about the logistics to final destination from each origin, (ii) ability to pick the most suitable suppliers from many different countries for one's business operations. The increase in one's sourcing options by MCC provides the kind of flexibility needed in competitive global markets. |
| Q-commerce | Q-commerce, also referred to as quick commerce, is a type of e-commerce where emphasis is on quick deliveries, typically in less than an hour. The companies providing Q-Commerce services might have vertically intergrated model or might be using third party delivery platforms (outsourced logistics). It has advantages like (i) competitve USP, (ii) potential to earn greater profit margins, (iii) better customer experience, (iv) guaranteed availability of products, (v) traceability, and (vi) scaleability. |
| ReverseLogistics | Reverse logistics is a type of supply chain management that moves goods from customers back to the sellers or manufacturers and may involve ciruclar economy principles (3Rs) viz. recycling, reuse (repurposing, reselling), reducing or repairing. In this regard, reverse commerce (or Recommerce) is the selling of previously owned items through physical or online marketplaces/distribution channels to buyers who reuse, recycle or resell them. |


Research Methodology
Mordor Intelligence follows a four-step methodology in all our reports.
- Step-1: Identify Key Variables: In order to build a robust forecasting methodology, the variables and factors identified in Step-1 are tested against available historical market numbers. Through an iterative process, the variables required for market forecast are set and the model is built on the basis of these variables.
- Step-2: Build a Market Model: Market-size estimations for the forecast years are in nominal terms. Inflation is considered to be a part of the pricing, and the average selling price (ASP) is varying throughout the forecast period for each country
- Step-3: Validate and Finalize: In this important step, all market numbers, variables and analyst calls are validated through an extensive network of primary research experts from the market studied. The respondents are selected across levels and functions to generate a holistic picture of the market studied.
- Step-4: Research Outputs: Syndicated Reports, Custom Consulting Assignments, Databases & Subscription Platforms


