Market Overview
| Study Period | 2020 - 2031 |
|---|---|
| Forecast Data Period | 2026 - 2031 |
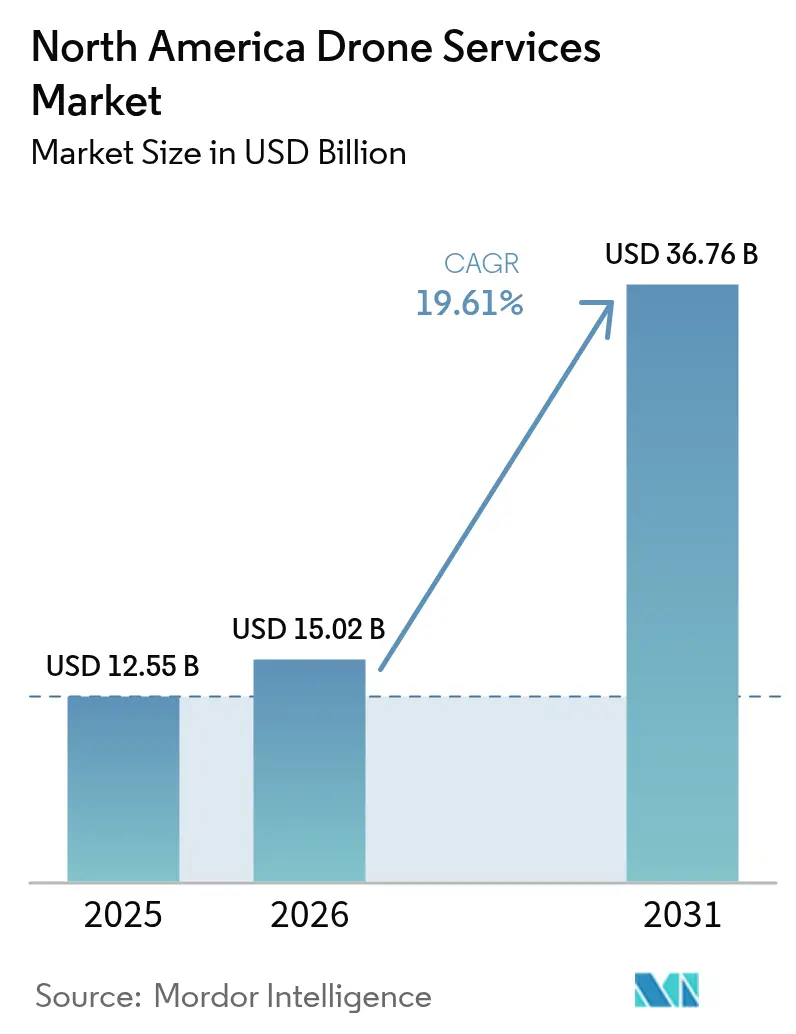
| Base Year Market Size (2025) | USD 12.55 Billion |
| Market Size (2026) | USD 15.02 Billion |
| Market Size (2031) | USD 36.76 Billion |
| Growth Rate (2026 - 2031) | 19.61% CAGR |
| Market Concentration | Low |
Major Players *Disclaimer: Major Players sorted in no particular order Image © Mordor Intelligence. Reuse requires attribution under CC BY 4.0. | |
North America Drone Services Market Analysis by Mordor Intelligence
The North America drone services market size is expected to grow from USD 12.55 billion in 2025 to USD 15.02 billion in 2026 and is forecast to reach USD 36.76 billion by 2031 at 19.61% CAGR over 2026-2031. The growth trajectory is underpinned by fast-moving Federal Aviation Administration (FAA) rulemaking on beyond-visual-line-of-sight (BVLOS) operations, expanding 5G connectivity, and rising enterprise demand for low-carbon data capture. A shift from hardware sales toward service-centric business models is encouraging specialized operators in analytics, training, and maintenance. Rapid consolidation, highlighted by Axon’s 2024 acquisition of Dedrone and John Deere’s 2025 purchase of Sentera, signals a pivot to vertically integrated platforms that combine flight operations with data insights. At the same time, Transport Canada’s streamlined BVLOS rules and Mexico’s regulatory alignment with ICAO standards are opening new addressable segments across the region.[1]Source: Transport Canada, “2025 Summary of Changes to Canada’s Drone Regulations,” tc.canada.ca
Key Report Takeaways
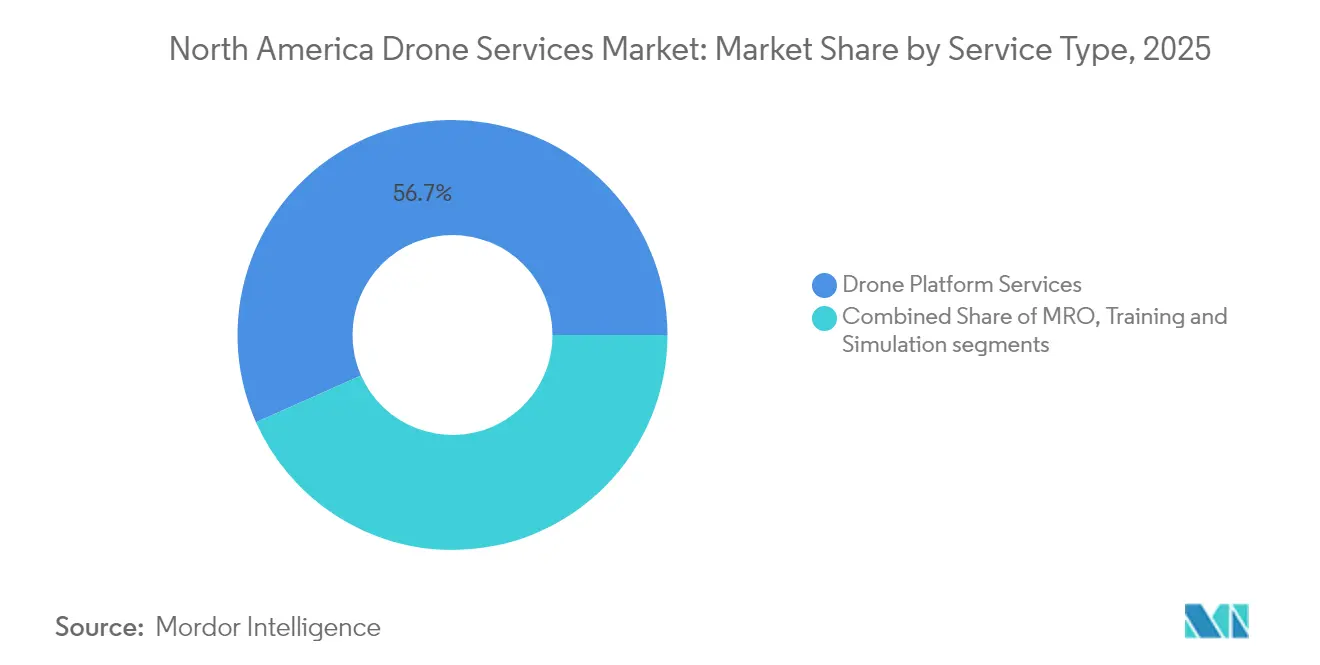
- By service type, drone platform services led with a 56.65% revenue share in 2025, while training and simulation grew fastest at a 24.10% CAGR.
- By end-user industry, construction and infrastructure led with 31.62% revenue share in 2025; the medical and parcel delivery segment is poised to expand at a 25.10% CAGR to 2031.
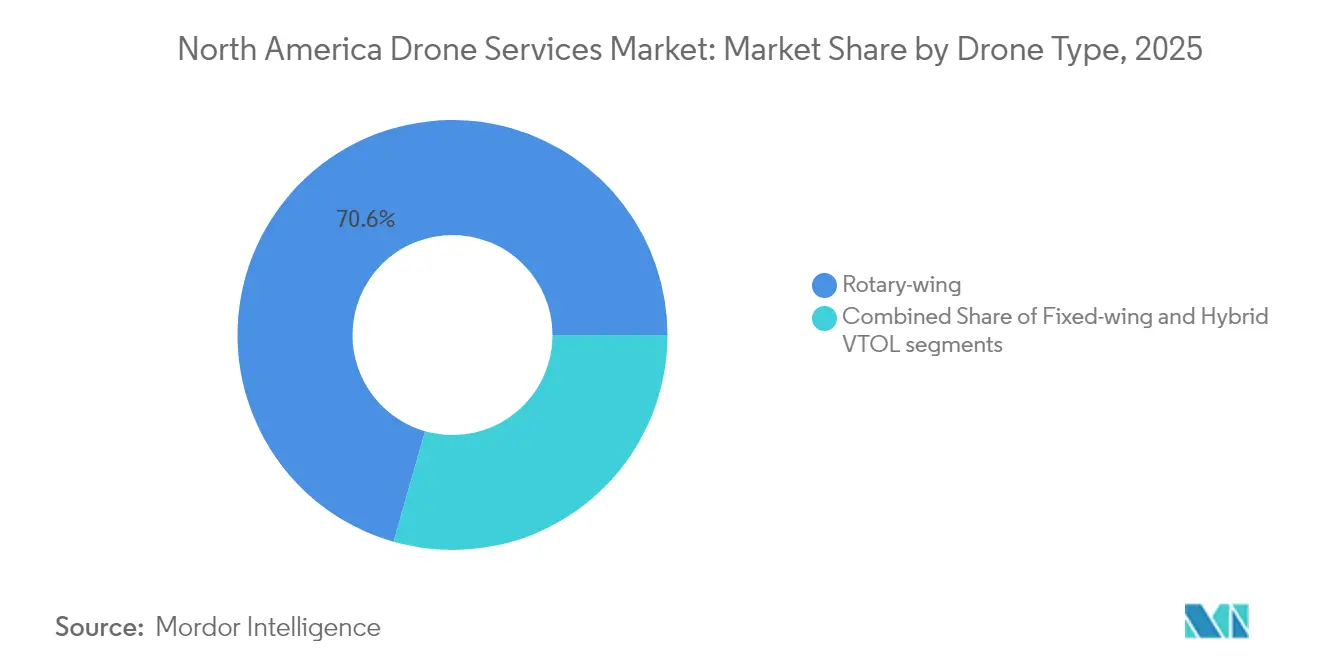
- By drone type, rotary-wing models accounted for 70.58% of the North American commercial drone services market size in 2025, while hybrid VTOL models are set to grow at a 27.95% CAGR.
- By operating range, visual line-of-sight (VLOS) flights accounted for 67.96% of 2025 revenue, but BVLOS services are projected to grow at a 22.98% CAGR through 2031.
- By geography, the United States captured an 86.02% market share in 2025, although Mexico is forecasted to become the fastest-growing country, with a 21.98% CAGR.
Note: Market size and forecast figures in this report are generated using Mordor Intelligence’s proprietary estimation framework, updated with the latest available data and insights as of 2026.
North America Drone Services Market Trends and Insights
Drivers Impact Analysis*
| Driver | (~)% Impact on CAGR Forecast | Geographic Relevance | Impact Timeline |
|---|---|---|---|
| FAA Part 135 and BVLOS waiver expansion | +4.2% | United States with spillover to Canada and Mexico | Medium term (2-4 years) |
| Cost-saving construction and infrastructure inspection | +3.8% | North America, concentrated in US and Canada | Short term (≤ 2 years) |
| Precision-agriculture adoption in row-crop farming | +3.1% | US Midwest, Canadian Prairies, Northern Mexico | Medium term (2-4 years) |
| Scaling medical and retail drone-delivery pilots | +2.9% | US urban centers, expanding to suburban markets | Long term (≥ 4 years) |
| Corporate ESG-driven shift to low-carbon aerial data | +2.4% | Global, early adoption in North America | Medium term (2-4 years) |
| Edge-AI and 5G enabling real-time analytics as-a-service | +2.8% | US and Canada tech corridors, Mexico emerging markets | Long term (≥ 4 years) |
| Source: Mordor Intelligence | |||
FAA Part 135 and BVLOS Waiver Expansion
Congressional direction required the FAA to finalize a Part 108 BVLOS framework within 20 months, transitioning from individual waivers to corporate oversight. The structure is expected to condense approval cycles from months to weeks and ultimately unlock scalable BVLOS services across the North American commercial drone services market.
Cost-Saving Construction and Infrastructure Inspection
Bridge and power-line inspections performed by drones resulted in up to 40% cost reductions and 75% faster cycle times, encouraging state transport agencies and utilities to replace crewed lifts. Georgia Power’s in-house fleet of 200 drones cut inspection spending by 60% while tripling anomaly detection, reinforcing adoption in the North American commercial drone services market.[2]Source: T&D World, “How Drones Are Revolutionizing Power Line Inspections,” tdworld.com
Precision-Agriculture Adoption in Row-Crop Farming
Spray drones treated 10.3 million acres in 2024, generating USD 215 million in service revenue. FAA approvals for swarm operations, which allow one pilot to supervise three heavy spray drones, have lowered labor intensity and pushed demand across the North American commercial drone services market.
Scaling Medical and Retail Drone-Delivery Pilots
Zipline surpassed 1 million commercial deliveries and partnered with Walmart to cover a large portion of the Dallas–Fort Worth area. The P2 Zip drone’s 8-pound payload and 10-mile radius address last-mile logistics inefficiencies and extend serviceable zones within the North American commercial drone services market.
Restraints Impact Analysis*
| Restraint | (~)% Impact on CAGR Forecast | Geographic Relevance | Impact Timeline |
|---|---|---|---|
| Patchwork state and municipal air-rights legislation | -2.1% | United States urban jurisdictions | Short term (≤ 2 years) |
| Limited skilled remote-pilot labour pool despite FAA Part 107 growth | -1.8% | North America, acute in rural areas | Medium term (2-4 years) |
| Cyber-security vulnerabilities in C2 links deterring critical-infrastructure clients | -1.5% | United States and Canada energy sectors | Medium term (2-4 years) |
| Fragmented BVLOS regulation and waiver burden | -1.3% | United States, spillover cross-border | Short term (≤ 2 years) |
| Source: Mordor Intelligence | |||
Patchwork State and Municipal Air-Rights Legislation
Local ordinances on air rights and privacy created a multilayered compliance burden that slowed multi-state roll-outs, particularly in densely populated corridors. Operators must map varying altitude limits and flight-over-people restrictions, which adds cost and dampens near-term growth in the North American commercial drone services market.
Limited Skilled Remote-Pilot Labor Pool
Although FAA Part 107 license holders increased, specialized sectors such as film, energy, and precision agriculture continued to face pilot shortages, with salaries exceeding USD 100,000. Demand for advanced certifications supported a 24.41% CAGR in training services, but constrained operational capacity across the North American commercial drone services market.
*Our forecasts treat driver/restraint impacts as directional, not additive. The impact forecasts reflect baseline growth, mix effects, and variable interactions.
Segment Analysis
By Service Type: Training Momentum Meets Platform Scale
The North American drone services market, for platform services, led with a 56.65% revenue share in 2025, reflecting the central role of piloting, data capture, and processing packages. Enterprises relied on turnkey flight teams and cloud analytics to streamline adoption, sustaining fee-based recurring revenue across energy, construction, and agriculture verticals. Hardware commoditization led providers to focus on value-added insights, and bundled service contracts contributed to expanding average deal sizes in 2025.
Training and simulation grew fastest at a 24.10% CAGR as labor shortfalls increased demand for scenario-based modules covering BVLOS procedures, swarm oversight, and advanced payload operation. Providers adopted mixed-reality simulators aligned with FAA Practical Test Standards, compressing time-to-currency and meeting insurers’ proficiency requirements. As BVLOS rules mature, certification refresh programs are expected to accelerate, further lifting the North American commercial drone services market.


By End-User Industry: Delivery Accelerates, Infrastructure Anchors
Construction and infrastructure held 31.62% of 2025 revenue, benefiting from measurable savings in bridge, transmission line, and pipeline inspections that reinforced steady renewal projects funded under the US Infrastructure Investment and Jobs Act. Tight labor markets and stringent safety mandates incentivized contractors to outsource aerial progress tracking, consolidating demand within the North American commercial drone services market.
Medical and parcel delivery registered the highest 25.10% CAGR. Distance-agnostic drones shortened fulfillment windows and reduced vehicle emissions, aligning with corporate ESG targets. Surgical supply networks, pharmacy chains, and mass-merchandise retailers expanded pilot programs into multi-state coverage zones after receiving route-based BVLOS authorizations, unlocking new addressable revenue streams for the North American commercial drone services industry.
By Drone Type: Hybrid VTOL Surges
Rotary-wing platforms retained 70.58% of the North American commercial drone services market share in 2025, driven by user familiarity, their hovering capability, and low maintenance requirements. They excelled in close-range visual inspections and tactical public safety deployments. Improved obstacle-avoidance sensors and IP-rated airframes extended their service life and minimized downtime.
Hybrid VTOL systems posted a 27.95% CAGR due to the FAA's powered-lift certification rules effective January 2025. Combining vertical takeoff with fixed-wing cruise, these aircraft delivered payloads over 50 km without the need for ground-based launchers, opening up underserved suburban logistics routes within the North American commercial drone services market.
By Operating Range: BVLOS Regulatory Breakthrough Drives Growth
VLOS flights contributed 67.96% of 2025 revenue. They remained the default for inspection and public-safety tasks requiring immediate pilot intervention. Risk-based regulatory compliance and lower insurance premiums sustained volume within the North American commercial drone services market.
BVLOS services, growing at 22.98% CAGR, benefited from Part 108 rulemaking, expanded FAA BEYOND test sites, and mature detect-and-avoid sensors. Zipline’s 2023 FAA approval set safety precedents that encouraged insurers to revise underwriting guidelines, while Transport Canada’s new certificate-free framework for routine BVLOS reduced administrative overhead for cross-border operators. Investors, therefore, funneled capital into fleet expansions designed for regional logistics networks across the North American commercial drone services market.
Geography Analysis
The United States dominates the North American commercial drone services market in 2025, accounting for 86.02% of the market size, supported by the FAA’s structured waiver process, extensive venture funding, and a dense enterprise client base. Federal test sites in Oklahoma, New York, and North Dakota facilitated technology validation, while defense grants under the DIU Blue UAS program accelerated the domestic scale-up of manufacturing. Congressional oversight of Part 108 BVLOS rulemaking further strengthened investor confidence.
Canada accounted for most of the remaining revenue and is forecast to increase as Transport Canada’s November 2025 rules simplify BVLOS approvals for drones weighing 25-150 kg. Routine line-of-sight flights will no longer require Special Flight Operations Certificates in low-risk airspace, reducing administrative costs and promoting adoption in the resource extraction, utilities, and forestry sectors.
Mexico represented the fastest-growing geography, with a 21.98% CAGR, as the civil aviation agency updated regulations in line with ICAO’s Model UAS framework. Large-scale irrigation modernization projects in Sonora and renewable-energy expansion along the Gulf Coast presented use cases for long-range surveys. Although infrastructure gaps persist, venture partnerships with US-based operators accelerated knowledge transfer, integrating skilled crews and command-and-control technologies into the North American commercial drone services market.
Competitive Landscape
The competitive field remained fragmented in 2025. Axon’s USD 170 million purchase of Dedrone brought counter-UAS, first-responder drones, and evidence-management software under one umbrella, creating an end-to-end air-domain awareness stack. John Deere’s Sentera acquisition integrated multispectral optics and crop-scouting analytics into its See and Spray platform, enhancing precision agriculture services.
Skydio raised USD 170 million to scale Remote Flight Deck, enabling browser-based drone control over 5G and positioning the company as a leading provider of autonomy for infrastructure clients. Drone Delivery Canada merged with Volatus Aerospace, combining manufacturing with logistics service delivery to pursue medical supply corridors and border surveillance contracts.
Emerging specialists target niche verticals. Energy-focused VOLT Inspections offered thermographic analytics for transmission lines, while Rantizo scaled spray-drone maintenance subscriptions for co-ops. Edge-AI module providers supplied real-time defect detection to enhance value capture, intensifying differentiation through software within the North American commercial drone services market.
North America Drone Services Industry Leaders
DroneDeploy, Inc.
Zipline International Inc.
Cyberhawk Innovations Limited
AgEagle Aerial Systems Inc.
Skydio, Inc.
- *Disclaimer: Major Players sorted in no particular order

Recent Industry Developments
- May 2025: John Deere acquired Sentera, a leader in remote imagery solutions for the agricultural industry. This strategic move enhances John Deere's technological portfolio, equipping farmers and agricultural service providers with advanced tools to harness data, ultimately boosting farm profitability, efficiency, and sustainability.
- April 2025: Zipline expanded its services to the Dallas area through a partnership with Walmart. The startup, known for delivering everything from vaccines to ice cream using electric autonomous drones, now offers its service in Mesquite, Texas, roughly 15 miles east of Dallas. Walmart customers in the area can opt for 30-minute deliveries via Zipline's latest unmanned aerial vehicles, dubbed P2 Zips. These advanced drones from Zipline can transport cargo weighing up to eight pounds within a 10-mile radius and are precise enough to land packages on surfaces as small as a table or doorstep.
- February 2025: Ondas and Volatus Aerospace partnered to deploy the Optimus autonomous platform for border surveillance.


Research Methodology Framework and Report Scope
Market Definitions and Key Coverage
Our study defines the North America drone services market as the revenue generated from professional operations performed for a fee with remotely piloted or autonomous drones, covering data capture, inspection, mapping, training, simulation, maintenance, and managed-platform services delivered across the United States, Canada, and Mexico. Hardware sales, software licenses sold independently of flight hours, and purely military missions fall outside this boundary.
Scope exclusion: Weaponized, hobby, and one-off hardware resale activities are not counted, ensuring an apples-to-apples service-only lens.
Segmentation Overview
- By Service Type
- Drone Platform Services
- Piloting and Operations
- Data Analytics
- Data Processing
- Maintenance, Repair and Overhaul (MRO)
- Training and Simulation
- Drone Platform Services
- By End User Industry
- Construction and Infrastructure
- Agriculture and Forestry
- Energy and Utilities
- Law Enforcement and Public Safety
- Medical and Parcel Delivery
- Others (Mining, Real-estate, Media)
- By Drone Type
- Rotary-wing
- Fixed-wing
- Hybrid VTOL
- By Operating Range
- Visual Line-of-Sight (VLOS)
- Beyond Visual Line-of-Sight (BVLOS)
- By Geography
- United States
- Canada
- Mexico
Detailed Research Methodology and Data Validation
Primary Research
To bridge data gaps, our analysts interviewed certified remote pilots, chief drone officers at construction, energy, and ag-tech firms, plus regulators in all three countries. These calls clarified prevailing hourly rates, fleet utilization, BVLOS waiver probabilities, and year-ahead procurement budgets, helping us validate desk findings and fine-tune key assumptions.
Desk Research
We first collated publicly available inputs from authoritative sources such as the FAA's Part 107 and Remote-ID registries, Transport Canada's RPAS flight statistics, Mexico's DGAC circulars, North American Industry Classification System shipment tables, and sector associations like the Associated General Contractors and the American Farm Bureau. Company 10-Ks, investor decks, and reputable press stories enrich adoption timelines, while D&B Hoovers and Dow Jones Factiva provide hard financials to benchmark service provider revenues. The sources noted are illustrative; many additional documents informed granular checks and contextual understanding.
Market-Sizing & Forecasting
A top-down build starts with active commercial drone registrations and flight-hour estimates, which are then matched against typical revenue per flight hour and average annual utilization. Select bottom-up cross-checks, such as sampled service-provider revenues and channel checks on hourly billing, help reconcile outliers before totals are locked. Inputs tracked include:
- FAA Part 107 commercial fleet size growth - Annual BVLOS waiver approvals - Average hourly billing rates by end-use (construction, energy, agriculture) - Share of enterprise drones operating under managed-service contracts - 5G coverage expansion across rural corridors - Inflation-adjusted replacement cycle for batteries and airframes impacting MRO spend.
Multivariate regression, supported by scenario analysis on regulatory milestones, projects these variables through 2030. Forecasts are stress-tested with our expert panel before release.
Data Validation & Update Cycle
Model outputs undergo variance checks against independent metrics such as energy-line miles inspected and acres sprayed. Senior analysts review anomalies, and a fresh validation pass precedes every annual refresh; interim updates trigger when major policy or funding shifts occur.
Why Our North America Drone Services Baseline Commands Dependability
Published figures often diverge because firms pick differing service menus, hardware bundling rules, currency bases, and refresh cadences.
Key gap drivers here include whether training hours are billed, how Mexico's nascent market is treated, the timeline assumed for FAA BVLOS rulemaking, and whether hardware revenue is blended into service tallies.
Benchmark comparison
| Market Size | Anonymized source | Primary gap driver |
|---|---|---|
| USD 12.55 B (2025) | Mordor Intelligence | - |
| USD 8.32 B (2024) | Regional Consultancy A | Excludes training & simulation services; relies on older base year without primary validation |
| USD 8.84 B (2024) | Regional Consultancy B | Omits most Mexican activity and assumes slower BVLOS adoption |
| USD 29.14 B (2024) | Global Consultancy C | Bundles hardware sales with services, inflating totals beyond a pure service lens |
The comparison shows that once like-for-like service scope, consistent geography, and current regulatory signals are applied, Mordor's carefully triangulated baseline offers decision-makers a balanced, credible starting point for strategy.


Key Questions Answered in the Report
What is the current value of the North American commercial drone services market?
The North American commercial drone services market size was USD 15.02 billion in 2026.
How fast is the market expected to grow?
The market is projected to expand at a 19.61% CAGR, reaching USD 36.76 billion by 2031.
Which end-user industry is growing the fastest?
Medical and parcel delivery is forecasted to grow at 25.10% CAGR through 2031.
What regulatory change will have the biggest impact?
The FAA’s forthcoming Part 108 BVLOS rulemaking is expected to reduce waiver timelines from months to weeks, enabling scalable beyond-visual-line-of-sight operations.
Why are hybrid VTOL drones gaining traction?
FAA powered-lift certification rules effective in 2025 cleared a pathway for aircraft that combine vertical take-off with fixed-wing efficiency, supporting longer-range delivery and inspection missions.
Page last updated on:


