North America Bottled Water Processing Market Size and Share
Market Overview
| Study Period | 2020 - 2031 |
|---|---|
| Base Year For Estimation | 2025 |
| Forecast Data Period | 2026 - 2031 |
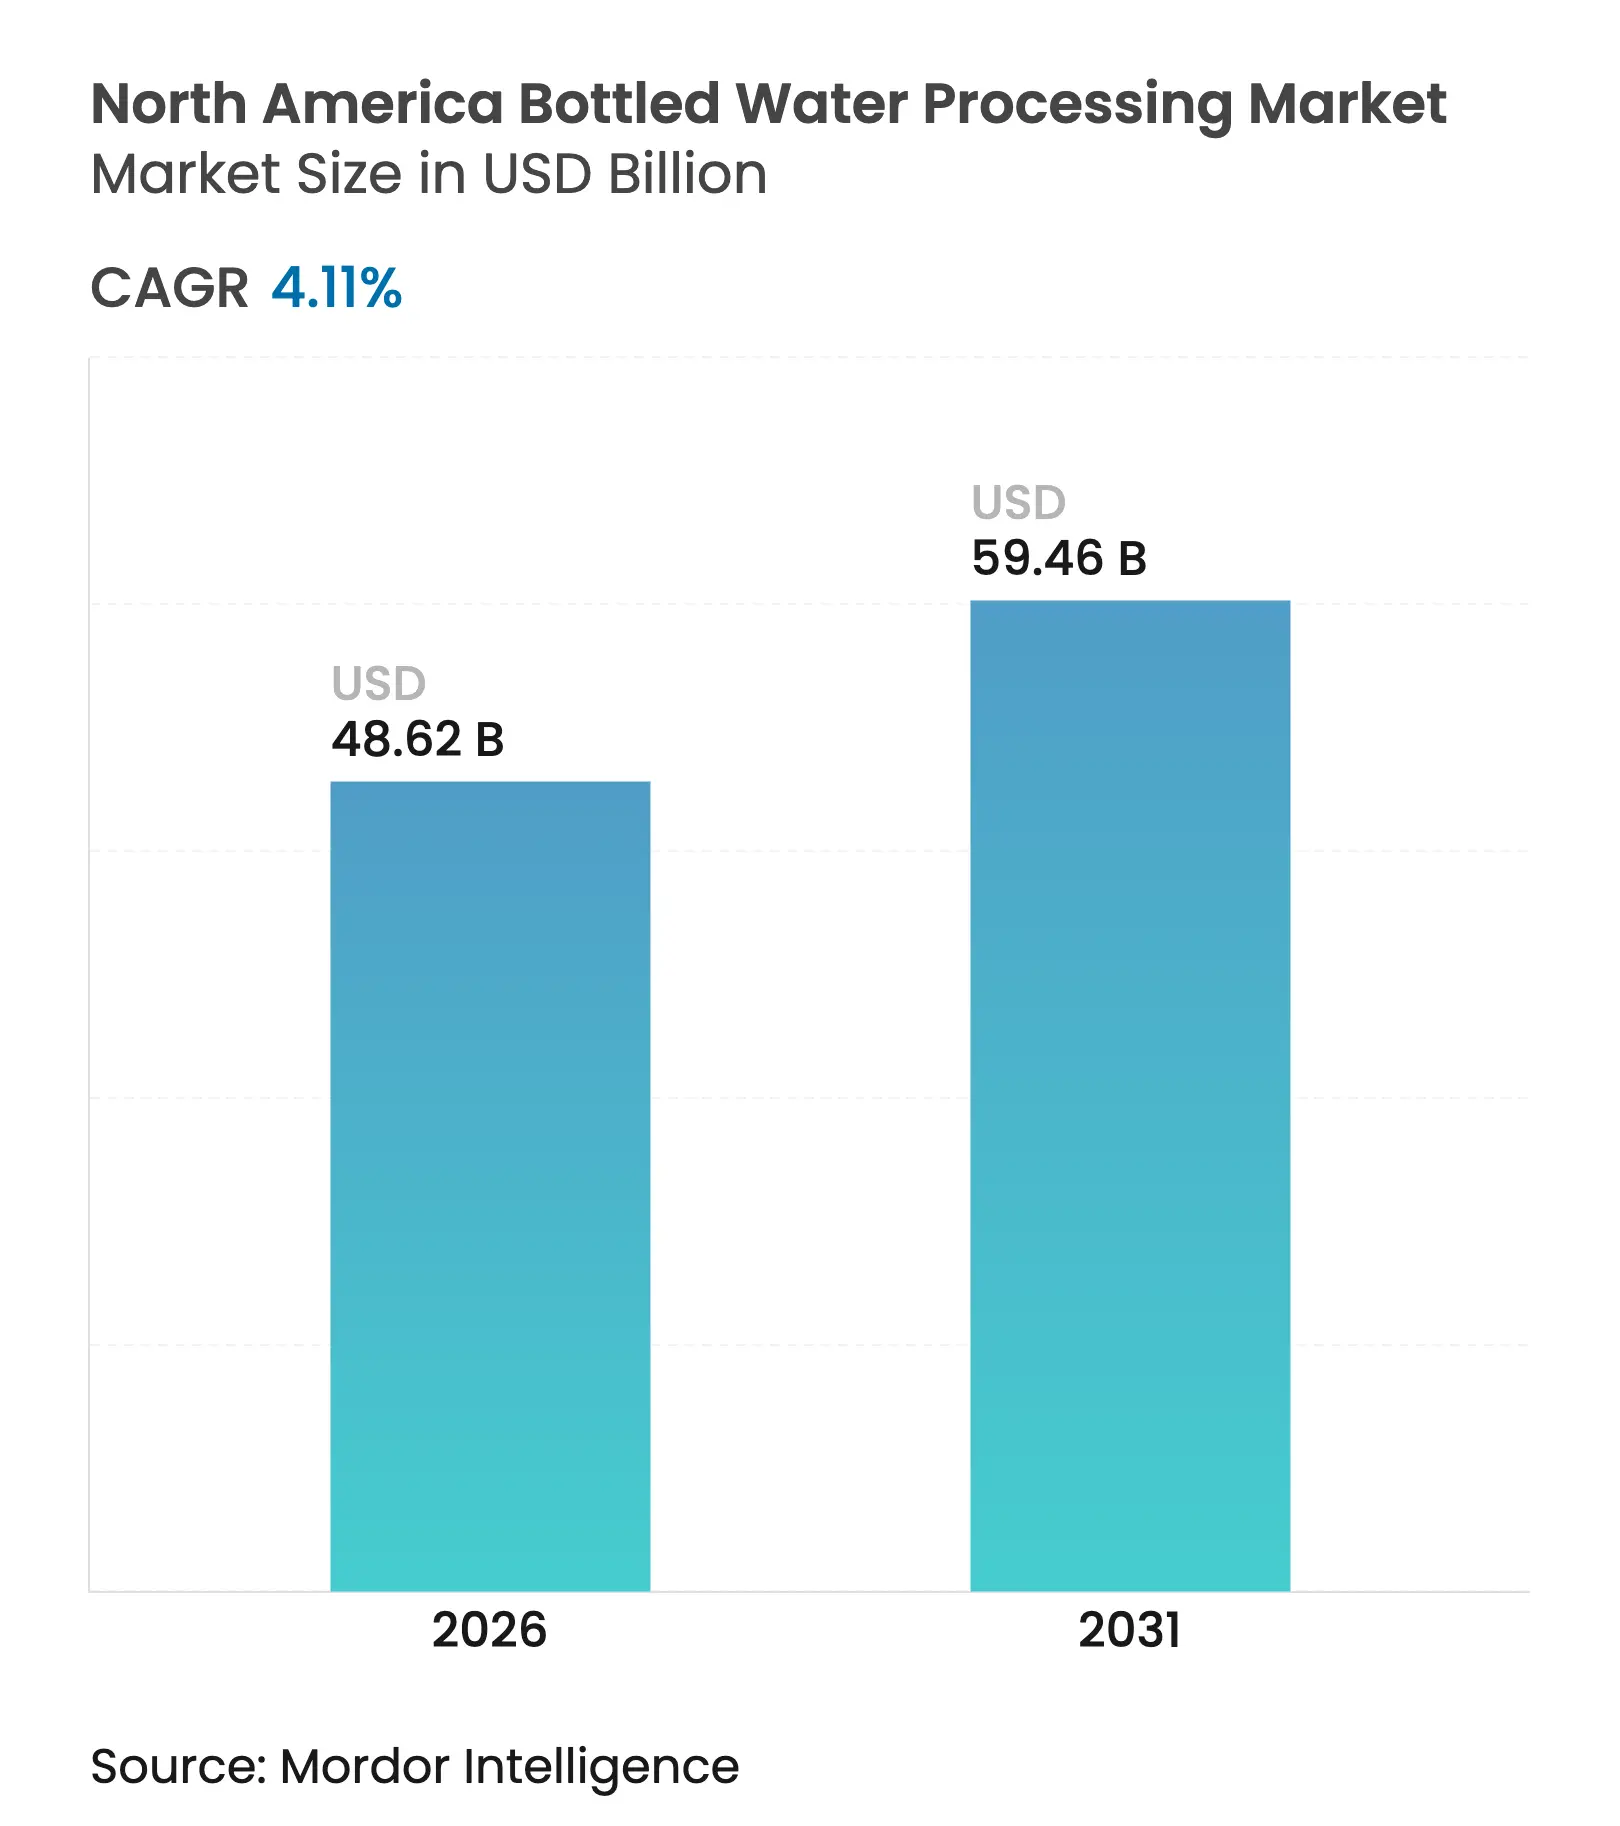
| Market Size (2026) | USD 48.62 Billion |
| Market Size (2031) | USD 59.46 Billion |
| Growth Rate (2026 - 2031) | 4.11 % CAGR |
| Market Concentration | Medium |
Major Players *Disclaimer: Major Players sorted in no particular order. Image © Mordor Intelligence. Reuse requires attribution under CC BY 4.0. |
North America Bottled Water Processing Market Analysis by Mordor Intelligence
The North America bottled water processing market size is expected to grow from USD 46.70 billion in 2025 to USD 48.62 billion in 2026 and is forecast to reach USD 59.46 billion by 2031 at 4.11% CAGR over 2026-2031. Solid consumer pivot toward healthier hydration, state-level recycled-content mandates, and rapid equipment upgrades sustain this expansion. The market benefits from steady replacement cycles in filtration and blow-molding assets, stronger private-label activity that presses processors to scale quickly, and rising capital flows into high-efficiency, PFAS-compliant treatment technologies. Vertical integration among large bottlers shortens lead times and shields operators from PET resin price swings, while regulatory focus on PFAS and rPET promotes adoption of multi-barrier treatment lines and rPET-ready molding platforms. Digitalization of filling and blow-molding systems further supports uptime and energy savings, reinforcing a competitive advantage for plants that embrace data-driven maintenance and production optimization.
Key Report Takeaways
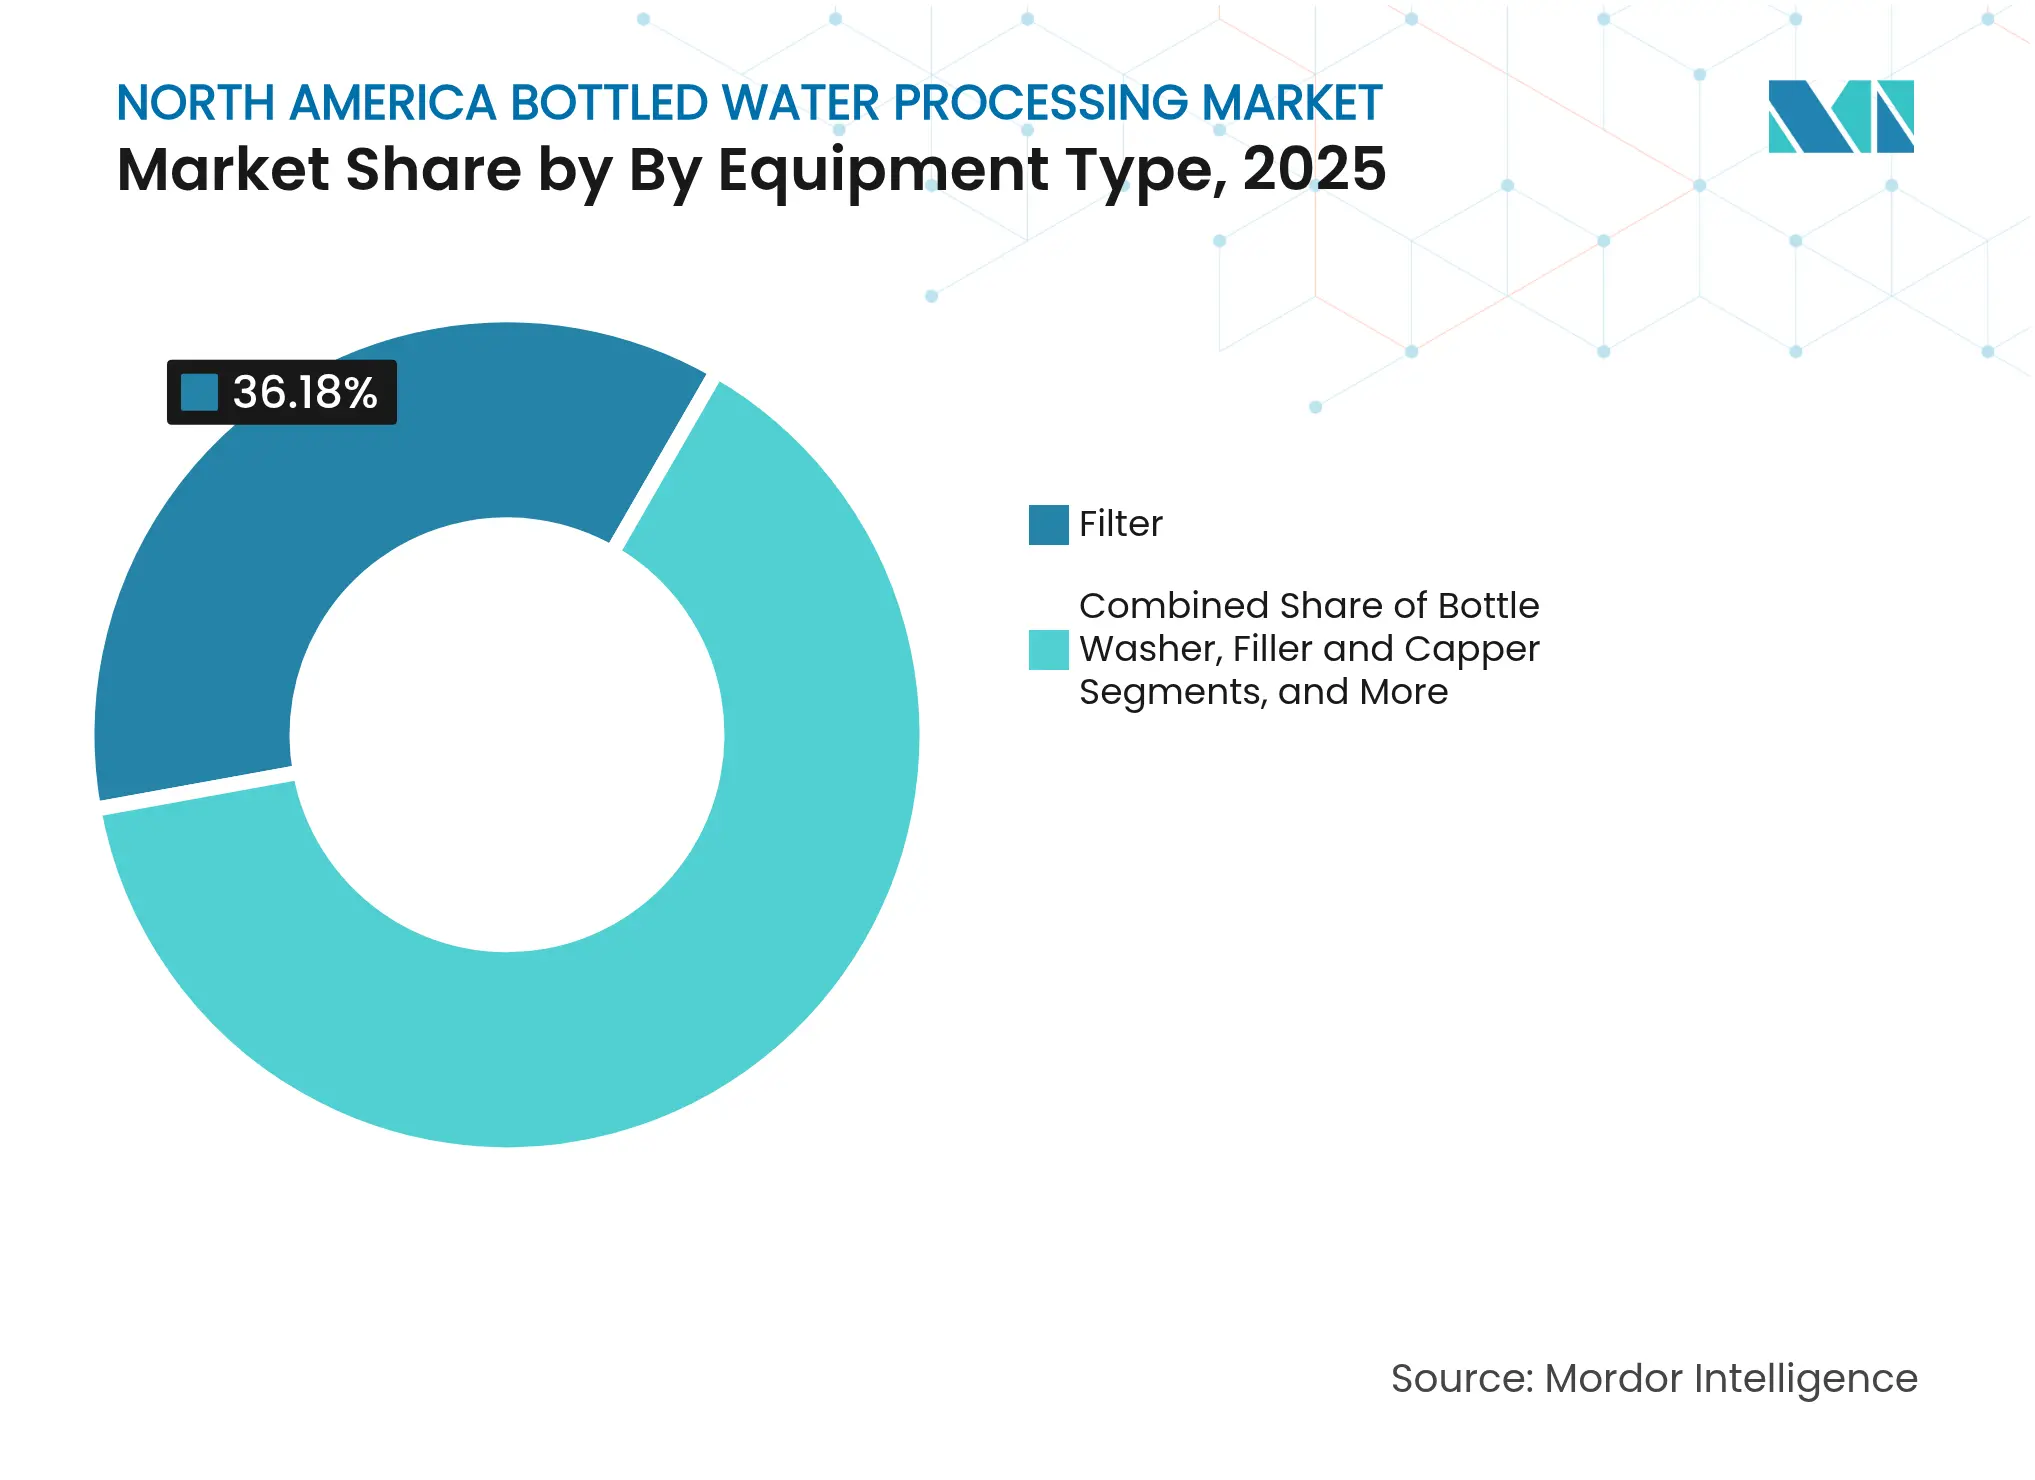
- By equipment type, filters led with 36.18% revenue share in 2025, whereas blow molders are projected to post the fastest 5.41% CAGR to 2031.
- By technology, reverse osmosis captured 52.30% of the North America bottled water processing market share in 2025, while UV disinfection is expected to expand at a 5.29% CAGR through 2031.
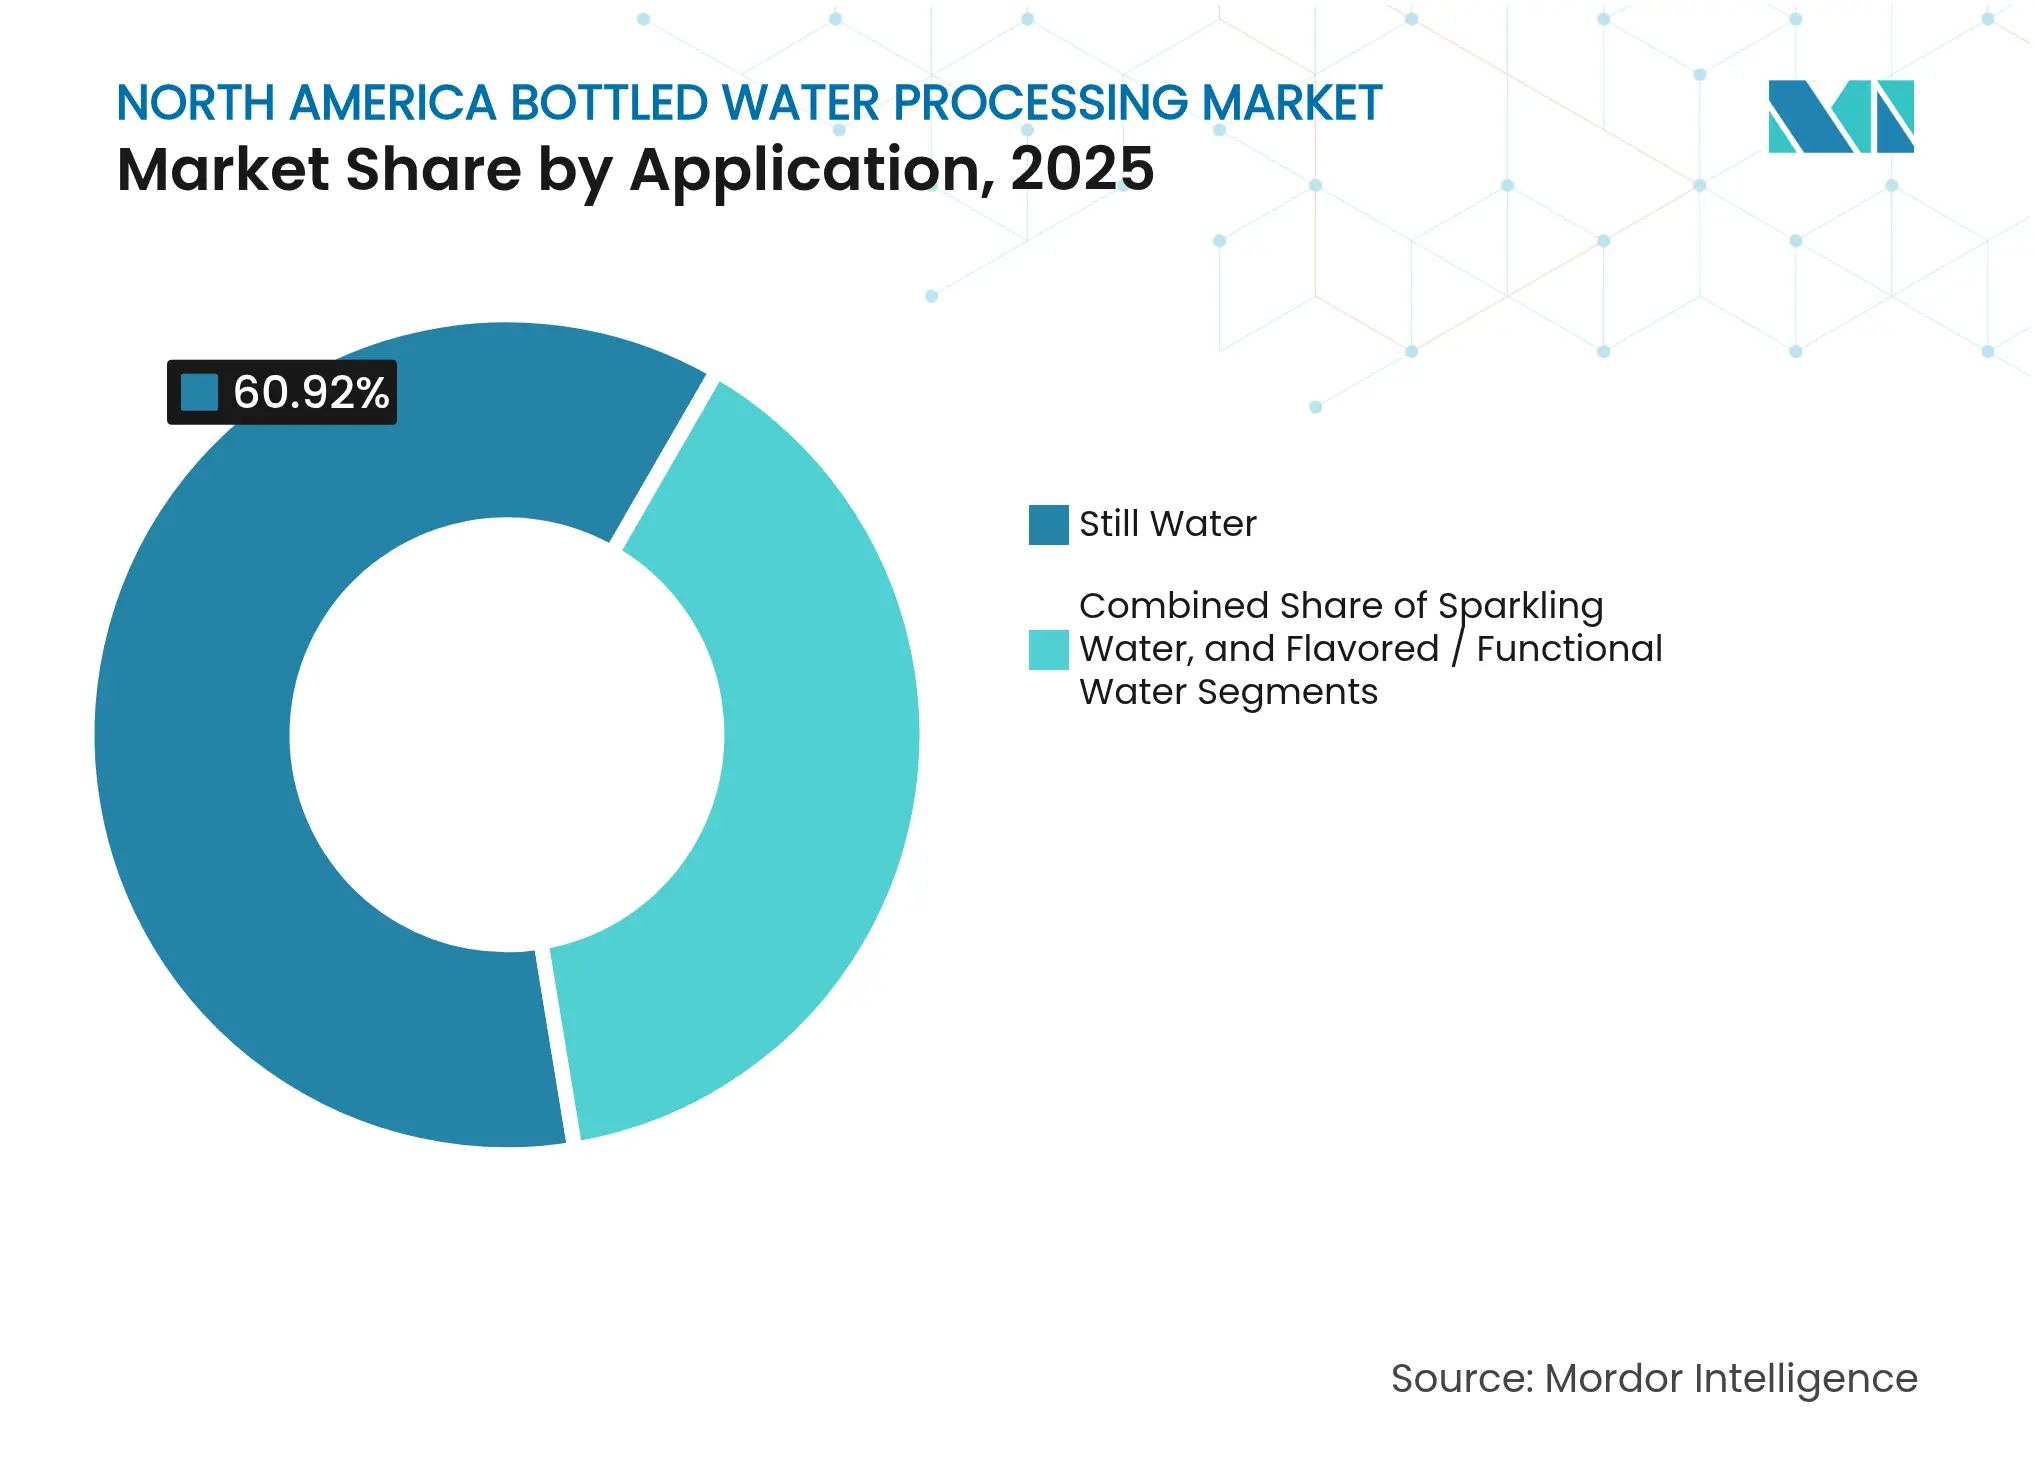
- By application, still water accounted for a 60.92% share of the North America bottled water processing market size in 2025; flavored/functional water is projected to grow at a 5.22% CAGR by 2031.
- By packaging material, PET held 73.65% share in 2025, with rPET anticipated to rise at a 5.36% CAGR during 2026-2031.
- By country, the United States controlled 71.64% of regional revenue in 2025, whereas Mexico is set to record the highest 5.14% CAGR through 2031.
Note: Market size and forecast figures in this report are generated using Mordor Intelligence's proprietary estimation framework, updated with the latest available data and insights as of 2026.
North America Bottled Water Processing Market Trends and Insights
Drivers Impact Analysis
| Driver | (~) % Impact on CAGR Forecast | Geographic Relevance | Impact Timeline | |||
|---|---|---|---|---|---|---|
Increasing consumer shift from carbonated soft-drinks to
bottled water
Increasing consumer shift from carbonated soft-drinks to
bottled water
| +0.8% | North America, strongest in US urban markets | Medium term (2-4 years) |
(~) % Impact on CAGR Forecast
:
+0.8%
|
Geographic Relevance
:
North America, strongest in US urban markets
|
Impact Timeline
:
Medium term (2-4 years)
|
Expansion of flavored and functional water product lines
Expansion of flavored and functional water product lines
| +0.6% | US and Canada, emerging in Mexico | Medium term (2-4 years) | |||
Growing private-label penetration across club and grocery
chains
Growing private-label penetration across club and grocery
chains
| +0.5% | United States, expanding to Canada | Short term (≤2 years) | |||
Adoption of high-efficiency filtration and blow-molding
systems
Adoption of high-efficiency filtration and blow-molding
systems
| +0.4% | Region-wide, led by large plants | Long term (≥4 years) | |||
State-level mandates for minimum rPET content in beverage
bottles
State-level mandates for minimum rPET content in beverage
bottles
| +0.7% | US states with bottle bills | Medium term (2-4 years) | |||
Surge in on-the-go single-serve demand from urban
commuters
Surge in on-the-go single-serve demand from urban
commuters
| +0.3% | Urban centers across region | Short term (≤2 years) | |||
| Source: Mordor Intelligence | ||||||
Increasing Consumer Shift from Carbonated Soft-Drinks to Bottled Water
The retreat from sugary carbonated beverages sustains fresh capacity investments across the North America bottled water processing market. High-speed filling houses configured for the dominant 16.9-ounce PET format receive the bulk of current purchase orders, letting producers capitalize on volume growth without disrupting existing lines. Major fillers increasingly specify dual-capability systems that can switch between still and lightly carbonated SKUs, a choice that trims downtime and bolsters product portfolio breadth. Equipment vendors that provide flexible change-part packages and rapid-clean CIP modules see rising share of new contracts. These dynamics enlarge the addressable aftermarket for spare parts and predictive maintenance software, creating additional recurring revenue streams for suppliers.
Expansion of Flavored and Functional Water Product Lines
Functional drinks featuring electrolytes, botanicals, and vitamins raise formulation complexity and therefore drive premium equipment demand. Pilot-scale units like Sensapure’s skid systems help processors finalize recipe stability before committing to full-capacity assets [1]Sensapure, “Pilot Plant Capabilities,” sensapure.com. At plant level, modular dosing skids and multi-point injection manifolds prevent ingredient degradation, while closed-loop controls maintain turbidity thresholds and microbiological integrity. As portfolios widen, processors pay a premium for automation that logs batch genealogy and orchestrates allergen-clean protocols. The resulting capex uplift directly supports the North America bottled water processing market.
State-Level Mandates for Minimum rPET Content in Beverage Bottles
Legislation such as Texas HB 3060 accelerates equipment replacement cycles by obligating higher recycled-content thresholds and third-party mass-balance certification [2]Texas Commission on Environmental Quality, “HB 3060 Advanced Recycling,” tceq.texas.gov. Blow-molding ovens must fine-tune heat profiles to cope with rPET’s lower intrinsic viscosity, and enhanced filtration removes rPET-specific fines ahead of resin drying. Crystal Geyser’s second in-house rPET line demonstrates the throughput feasibility of 1,650 kg per hour using new-generation molds that minimize acetaldehyde accumulation. These requirements boost order books for suppliers specializing in rPET-ready platforms and inline contamination detection.
Adoption of High-Efficiency Filtration and Blow-Molding Systems
Top bottlers revise asset roadmaps around energy savings and contaminant removal, especially PFAS. Krones logged 12.1% revenue growth in 2024 on strong uptake of multi-barrier lines that merge filtration, UV, and filling zones into a compact block. Niagara Bottling’s lines operating above 1,800 bottles per minute illustrate how highly integrated blow-molding technology amplifies throughput and reduces resin usage. UV units such as the MEGATRON series also find traction as chemical-free complements capable of 90-450 gpm, reducing disinfection by-products. Collectively these upgrades underpin sustained capex growth across the North America bottled water processing market.
Restraints Impact Analysis
| Restraint | (~) % Impact on CAGR Forecast | Geographic Relevance | Impact Timeline | |||
|---|---|---|---|---|---|---|
Rising regulatory scrutiny on PFAS, micro-plastics and
source withdrawals
Rising regulatory scrutiny on PFAS, micro-plastics and
source withdrawals
| -0.9% | United States and Canada | Medium term (2-4 years) |
(~) % Impact on CAGR Forecast
:
-0.9%
|
Geographic Relevance
:
United States and Canada
|
Impact Timeline
:
Medium term (2-4 years)
|
PET resin cost volatility tied to crude-oil and
geopolitical shocks
PET resin cost volatility tied to crude-oil and
geopolitical shocks
| -0.6% | Region-wide | Short term (≤2 years) | |||
Substitution from at-home filtration and sparkling-water
makers
Substitution from at-home filtration and sparkling-water
makers
| -0.4% | Urban and suburban households | Long term (≥4 years) | |||
Community resistance to new groundwater extraction permits
Community resistance to new groundwater extraction permits
| -0.3% | Rural and water-stressed areas | Long term (≥4 years) | |||
| Source: Mordor Intelligence | ||||||
Rising Regulatory Scrutiny on PFAS, Micro-Plastics and Source Withdrawals
Federal PFAS limits set for 2029 compel processors to add granular activated carbon, anion-exchange, or reverse-osmosis stages that can handle flows up to 2,800 gpm, significantly lifting both capex and opex. De Nora’s SORB systems already treat more than 250 million gpd, signaling scalability but highlighting space, power, and brine-disposal hurdles. Smaller facilities risk production downtime during retrofits, and clustered demand may lengthen delivery queues for compliant skids. The resulting cost burden can delay new-product launches and limit margin expansion in the North America bottled water processing market.
PET Resin Cost Volatility Tied to Crude-Oil and Geopolitical Shocks
Swinging PET prices squeeze gross margins and influence line-utilization strategies, especially for blow-molding hubs. Pentair’s Q1 2025 note revealed surcharge implementation to buffer resin inflation, yet higher working-capital needs still dent cash flow. Producers react by stretching preventive-maintenance intervals and deferring non-essential upgrades, which shortens the funnel of immediate equipment orders. Nevertheless, increased interest in rPET provides a natural hedge, steering some investment toward rPET-compatible equipment and partially offsetting volatility pressures on the North America bottled water processing market.
Segment Analysis
By Equipment Type: Filters Lead While Blow Molders Accelerate
Filtration units commanded 36.18% share of the North America bottled water processing market size. Stringent microbial and chemical standards, especially those targeting PFAS, micro-plastics, and mineral content, keep demand high for multi-barrier filter trains that bundle activated carbon, micro-filtration, and RO stages. Replacement cycles average five to seven years, creating a steady aftermarket for membranes and cartridges. The segment also benefits from heightened attention to real-time water-quality monitoring that triggers automatic backwash or membrane-clean protocols.
Blow-molding machinery, although smaller in value today, is scaling fastest at 5.41% CAGR to 2031. Large plants integrate molders with filling blocks to curb neck-handling damage and slash compressed-air usage. Niagara Bottling’s installation illustrates how 1,800 bpm throughput reshapes labor footprints and unit economics. Suppliers like Sidel deploy Actis plasma internal coating to extend shelf life, while dry-preform sterilization grants aseptic capabilities within the same housing. These innovations encourage mid-tier bottlers to internalize bottle production, supporting lasting growth in the North America bottled water processing market.
Note: Segment shares of all individual segments available upon report purchase
By Technology: Reverse Osmosis Dominance Meets UV Innovation
Reverse-osmosis modules secured 52.30% of 2025 revenue, reflecting their unmatched efficacy in dissolved solid rejection and flavor consistency. Plants deploy RO loops with energy-recovery devices that recuperate up to 45% of consumed power, directly improving operating margins. Many facilities layer remineralization skids post-RO to align finished-water taste with brand profiles, underscoring the versatility of the platform.
UV disinfection, although holding a smaller base, leads growth at 5.29% CAGR. Advances in medium-pressure lamp life and LED UV-C arrays enable in-line systems that deactivate 99.99% of pathogens while preserving organoleptic qualities. Processors also value UV’s chemical-free status, which aligns with clean-label marketing. Hybrid trains pairing RO and UV satisfy both dissolved and microbial removal needs, reinforcing UV uptake in the North America bottled water processing market.
By Application: Still Water Foundation Supports Functional Growth
Still water remains the bedrock at 60.92% of 2025 revenue. Brands rely on its high-volume, low-complexity profile to maintain baseline plant utilization, making it instrumental in covering fixed overheads. Line efficiency is paramount; thus fillers are set for 99% operational availability, aided by IoT sensors that trigger predictive interventions.
Flavored and functional water, advancing at 5.22% CAGR, injects margin upside through value-added formulations. Pall Corporation supplies flavor filtration modules that homogenize ingredient slurries and curb turbidity without stripping aromas. Processors invest in aseptic buffers and dedicated CIP circuits to mitigate cross-contamination. This shift amplifies demand for agile dosing manifolds and modular mixing systems, accelerating growth in the North America bottled water processing market.
Note: Segment shares of all individual segments available upon report purchase
By Packaging Material: PET Supremacy Yields to rPET Momentum
PET still dominates packaging at 73.65% in 2025 owing to cost-effectiveness, clarity, and lightweight properties. ISBM (injection stretch blow molding) lines continuously improve cycle times, pushing bottle weight below 9 g for 500 ml formats without compromising top-load strength.
rPET adoption, forecast to climb 5.36% CAGR, draws strength from corporate pledges and statutory recycled-content thresholds. Arca Continental and Coca-Cola added USD 2.8 million to scale a recovery plant that will collect 380 million bottles yearly, ensuring local feedstock. ACERETECH’s FDA-approved bottle-to-bottle system proves that 100% food-grade rPET is technically viable at commercial scale. Blow-molding vendors are redesigning oven profiles and screw geometries to process rPET flakes consistently, expanding market scope for specialized retrofits across the North America bottled water processing market.
Geography Analysis
The United States generated a 71.64% share of the North America bottled water processing market in 2025. Capacity expansions such as Niagara Bottling’s USD 130 million Kentucky site reinforce the country’s position. EPA PFAS mandates catalyze additional retrofits, pushing adoption of advanced carbon beds and RO loops that meet sub-ppt thresholds. PepsiCo’s decision to outsource Aquafina case-pack volumes to Niagara funnels production to high-efficiency hubs equipped with automated case-packers and palletizers, further concentrating demand for top-tier equipment . Sustainability rules aiming for 25% rPET by 2030 also spark blow-molding overhauls, ensuring continuous flow of orders for rPET-capable platforms in the North America bottled water processing market.
Canada holds a stable share underpinned by premium spring and functional products. Processors prioritize energy minimization through variable-frequency drives and heat-recovery blow-molders, often securing provincial incentives that offset capital outlay. Big 8 Beverages deployed a turnkey SIPA line integrating blow-molding, filling, and sleeving, shrinking footprint and lowering water usage by 28%. Regulatory alignment around extended producer responsibility fosters investments in rPET feedstock agreements, locking in supply and anchoring future equipment purchases.
Mexico stands out with a 5.14% forecast CAGR through 2031. The government’s USD 6.1 billion water-infrastructure plan expands access, heightening reliance on packaged water where municipal reliability remains low. Nestlé’s USD 1 billion spend underscores investor confidence, with a large share allocated to high-speed fillers and RO-UV stacks tailored for local source conditions. Equipment suppliers cultivate local service centers and vendor-financed leasing to address mid-tier bottler capital constraints, enhancing penetration in this rising segment of the North America bottled water processing market.

Competitive Landscape
Market Concentration
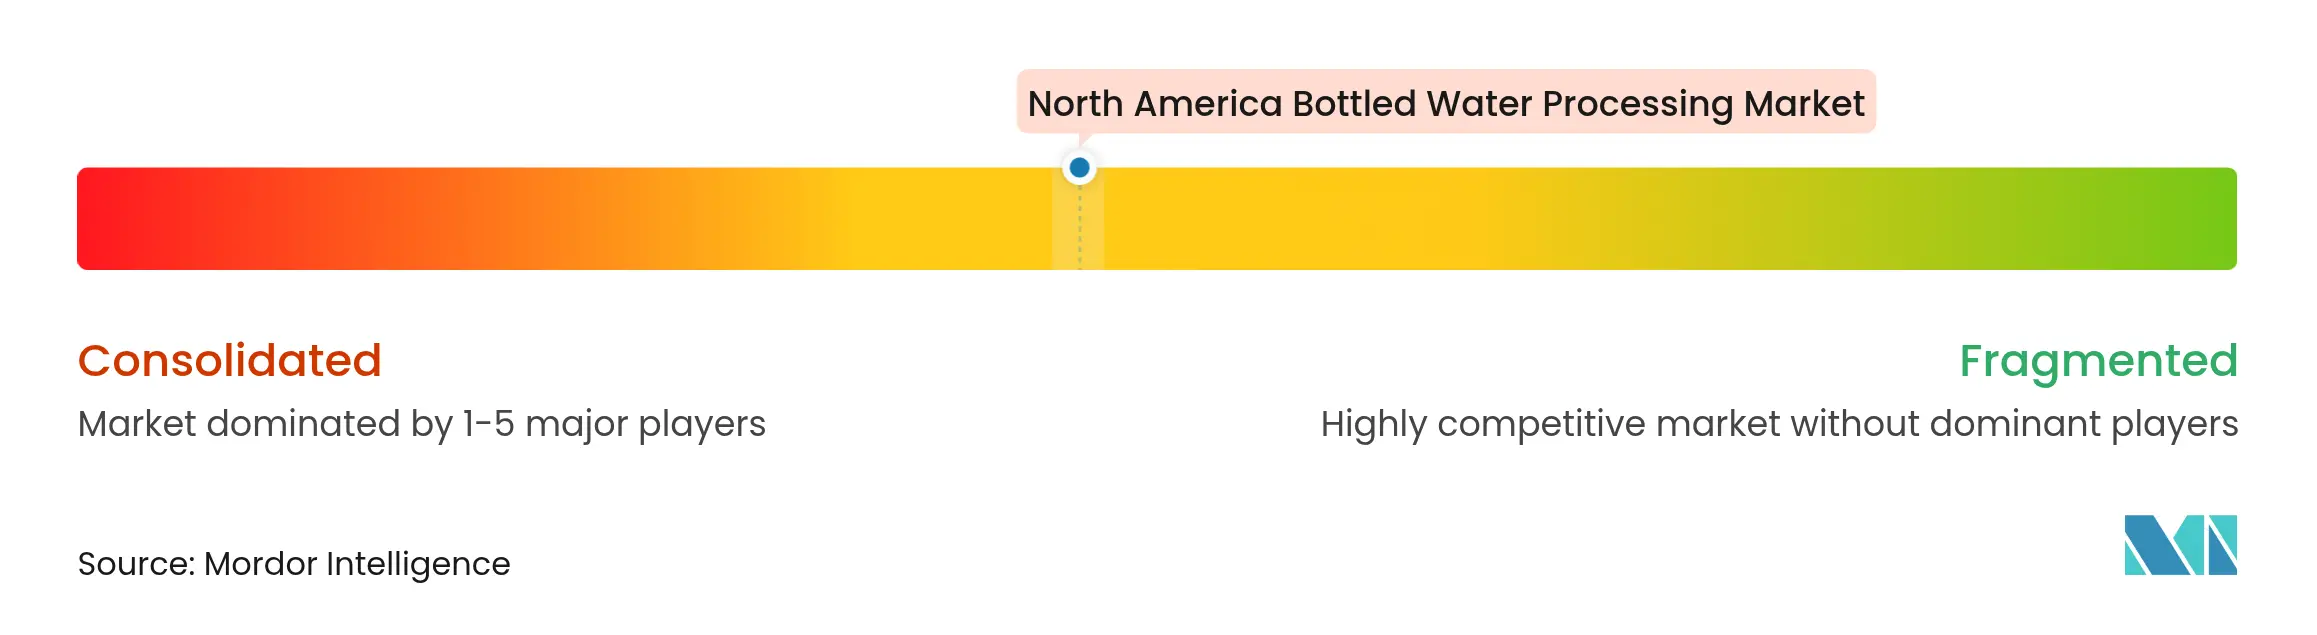
The North America bottled water processing market shows moderate concentration. Krones leads via integrated blocks that trim changeover to under 15 minutes while cutting energy consumption by 30% compared with legacy set-ups. The company’s digital twins help customers simulate rPET behavior before physical trials, expediting commissioning.
Omnia Technologies advanced consolidation by acquiring ACMI, SACMI Beverage, and SACMI Labelling, raising combined turnover to USD 280 million and broadening reach into high-speed conveyance and labelling [4]EFA News, “Omnia Technologies Acquisitions,” efanews.eu. Competitors answer through niche specialization, particularly PFAS adsorption skids, where De Nora and Evoqua promote turnkey packages featuring carbon change-outs matched to source contamination profiles.
Emerging disruptors focus on advanced barrier coatings, all-electric blow-molders, and cloud-based performance-tracking. Suppliers increasingly package financing, spare-parts subscriptions, and operator-training modules into service agreements that seal customer lock-in and grow lifetime value. Such offerings, while technology-agnostic, collectively strengthen supplier bargaining power and influence future share shifts inside the North America bottled water processing market.
North America Bottled Water Processing Industry Leaders

*Disclaimer: Major Players sorted in no particular order
Recent Industry Developments
- June 2025: Veolia completed one of the largest PFAS treatment systems in the Northeast, safeguarding drinking water for over 100,000 residents.
- February 2025: PepsiCo Beverages North America outsourced Aquafina case-pack production to Niagara Bottling, concentrating volumes in high-efficiency sites.
- January 2025: Nestlé pledged USD 1 billion for Mexican production expansion across multiple beverage categories.
- September 2024: Niagara Bottling confirmed a USD 130 million Kentucky facility to extend bottled water capacity.
Table of Contents for North America Bottled Water Processing Industry Report
1. INTRODUCTION
- 1.1Market Definition and Study Assumptions
- 1.2Scope of the Study
2. RESEARCH METHODOLOGY
3. EXECUTIVE SUMMARY
4. MARKET LANDSCAPE
- 4.1Market Overview
- 4.2Market Drivers
- 4.2.1Increasing consumer shift from carbonated soft-drinks to bottled water
- 4.2.2Expansion of flavored and functional water product lines
- 4.2.3Growing private-label penetration across club and grocery chains
- 4.2.4Adoption of high-efficiency filtration and blow-molding systems
- 4.2.5State-level mandates for minimum rPET content in beverage bottles
- 4.2.6Surge in on-the-go single-serve demand from urban commuters
- 4.3Market Restraints
- 4.3.1Rising regulatory scrutiny on PFAS, micro-plastics and source withdrawals
- 4.3.2PET resin cost volatility tied to crude-oil and geopolitical shocks
- 4.3.3Substitution from at-home filtration and sparkling-water makers
- 4.3.4Community resistance to new groundwater extraction permits
- 4.4Value / Supply-Chain Analysis
- 4.5Evaluation of Critical Regulatory Framework
- 4.6Impact Assessment of Key Stakeholders
- 4.7Technological Outlook
- 4.8Porter's Five Forces Analysis
- 4.8.1Bargaining Power of Suppliers
- 4.8.2Bargaining Power of Consumers
- 4.8.3Threat of New Entrants
- 4.8.4Threat of Substitutes
- 4.8.5Intensity of Competitive Rivalry
- 4.9Impact of Macro-economic Factors
5. MARKET SIZE AND GROWTH FORECASTS (VALUE)
- 5.1By Equipment Type
- 5.1.1Filter
- 5.1.2Bottle Washer
- 5.1.3Filler and Capper
- 5.1.4Blow Molder
- 5.1.5Shrink Wrapper
- 5.1.6Others
- 5.2By Technology
- 5.2.1Reverse Osmosis (RO)
- 5.2.2Micro-Filtration (MF)
- 5.2.3UV Disinfection
- 5.2.4Chlorination
- 5.2.5Others
- 5.3By Application
- 5.3.1Still Water
- 5.3.2Sparkling Water
- 5.3.3Flavored / Functional Water
- 5.4By Packaging Material
- 5.4.1PET
- 5.4.2rPET
- 5.4.3Glass
- 5.4.4Cans
- 5.4.5Bio-based and Carton
- 5.5By Country
- 5.5.1United States
- 5.5.2Canada
- 5.5.3Mexico
6. COMPETITIVE LANDSCAPE
- 6.1Market Concentration
- 6.2Strategic Moves
- 6.3Market Share Analysis
- 6.4Company Profiles (includes Global level Overview, Market level overview, Core Segments, Financials as available, Strategic Information, Market Rank/Share for key companies, Products and Services, and Recent Developments)
- 6.4.1BlueTriton Brands, Inc.
- 6.4.2PepsiCo, Inc.
- 6.4.3The Coca-Cola Company
- 6.4.4Danone S.A.
- 6.4.5Suntory Beverage and Food Limited
- 6.4.6Niagara Bottling, LLC
- 6.4.7Mountain Valley Spring Company, LLC
- 6.4.8CG Roxane, LLC
- 6.4.9Otsuka Holdings Co., Ltd.
- 6.4.10National Beverage Corp.
- 6.4.11Highland Spring Limited
- 6.4.12Nestle S.A.
- 6.4.13Primo Water Corporation
- 6.4.14Keurig Dr Pepper Inc.
- 6.4.15GEA Group AG
- 6.4.16Pentair plc
- 6.4.17Pall Corporation
- 6.4.18Veolia Environnement S.A.
- 6.4.19Sidel Group
- 6.4.20Krones AG
- 6.4.21Alfa Laval AB
- 6.4.22Culligan International Company
- 6.4.23Toray Industries, Inc.
- 6.4.24DuPont de Nemours, Inc.
7. MARKET OPPORTUNITIES AND FUTURE TRENDS
- 7.1White-space and Unmet-need Assessment
North America Bottled Water Processing Market Report Scope
The bottled water processing industry refers to the sector involved in the production and processing of bottled water. It includes various stages such as sourcing water from natural or treated sources, treating the water to meet quality standards, bottling, packaging, and distributing of the final product to consumers. The industry ensures that the water is safe, clean, and meets regulatory requirements before it is packaged and sold to the public. Bottled water processing companies utilize advanced technologies and quality control measures to ensure the purity and safety of the water throughout the production process. The industry plays a significant role in providing consumers with convenient access to clean drinking water, especially in areas where tap water quality may be a concern or when individuals prefer the convenience of bottled water.
North America's bottled water processing market is segmented by equipment type (filter, bottle washer, filler, capper, blow molder, and other equipment types), by technology (reverse osmosis (RO), ultrafiltration (UF), microfiltration (MF), chlorination and other technologies), by application (still water, sparkling water, flavored water), by region (United States, Canada, and Mexico).
The market size and forecasts are provided in terms of (USD) for all the above segments.