
Europe Bottled Water Processing Market Size and Share
Market Overview
| Study Period | 2020 - 2031 |
|---|---|
| Forecast Data Period | 2026 - 2031 |
| Base Year Market Size (2025) | USD 38.98 Billion |
| Market Size (2026) | USD 41.06 Billion |
| Market Size (2031) | USD 53.25 Billion |
| Growth Rate (2026 - 2031) | 5.33 % |
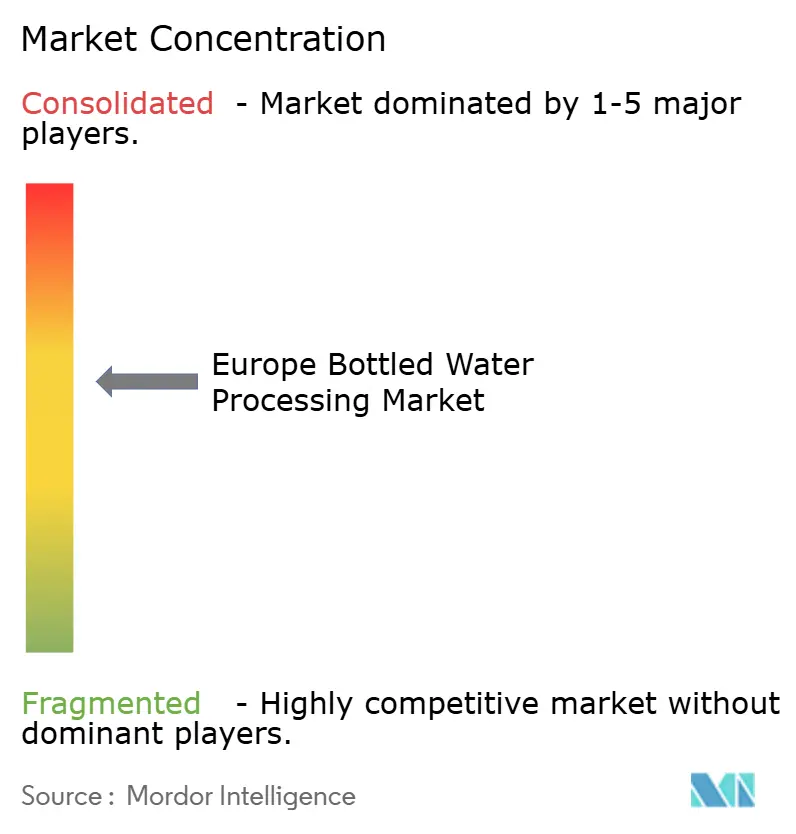
| Market Concentration | Medium |
Major Players *Disclaimer: Major Players sorted in no particular order Image © Mordor Intelligence. Reuse requires attribution under CC BY 4.0. | |
Europe Bottled Water Processing Market Analysis by Mordor Intelligence
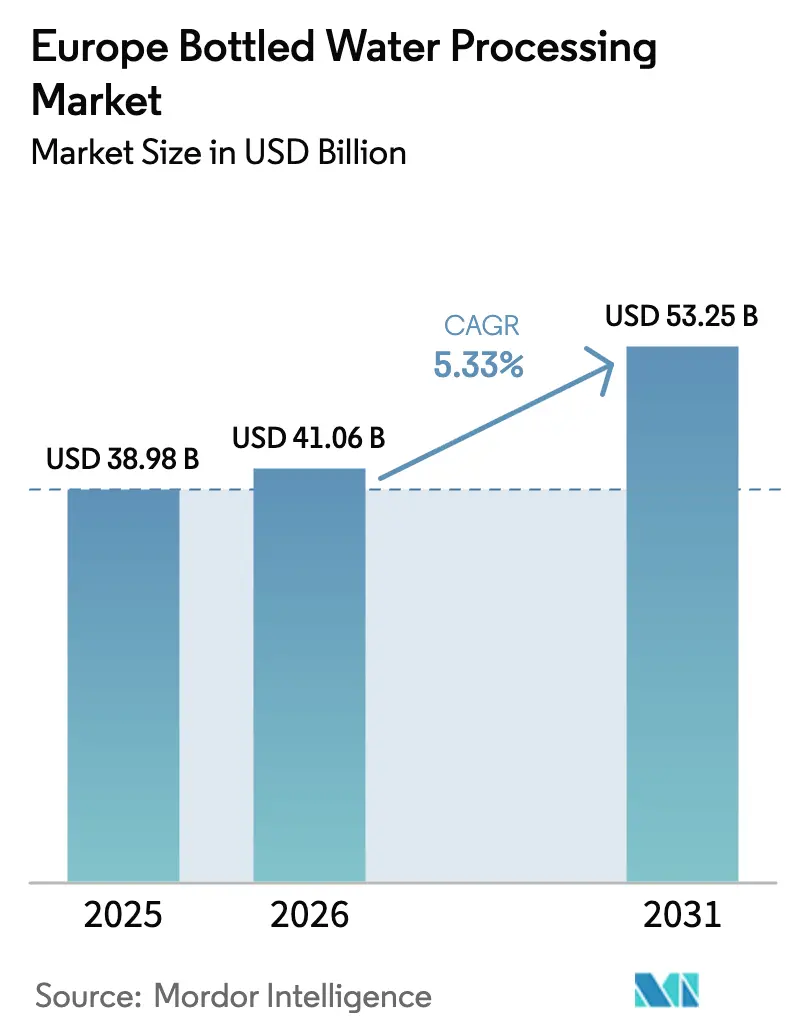
The European bottled water processing market size in 2026 is estimated at USD 41.06 billion, growing from 2025 value of USD 38.98 billion with 2031 projections showing USD 53.25 billion, growing at 5.33% CAGR over 2026-2031. Robust retail demand, sharper EU sustainability mandates, and line-automation investments by scale players shape the current growth runway. Brand owners are tightening control of recycled-content supply chains, discount retailers are expanding private-label shelf space, and equipment makers are bundling predictive-maintenance contracts to lock in clients across the European bottled water processing market. Competitive dynamics favor vertically integrated brands in Germany and France; however, Spain’s tourism-driven volume rebound is spurring the development of greenfield capacity. Line modernization, particularly in areas such as blow molding, inspection, and UV systems, continues to redirect capital toward energy-efficient, rPET-compatible technology.
Key Report Takeaways
- By equipment type, filters led with 31.94% revenue share in 2025; blow molders are projected to expand at a 6.28% CAGR through 2031.
- By technology, reverse osmosis accounted for a 40.83% share in 2025, while UV disinfection is expected to grow at the fastest rate, with a 7.1% CAGR, from 2026 to 2031.
- By application, still water accounted for 63.43% of the European bottled water processing market size in 2025, and flavored water is expected to advance at a 7.36% CAGR through 2031.
- By packaging material, polyethylene terephthalate dominated with a 78.14% share in 2025 and remains the fastest-growing substrate, with a 6.25% CAGR.
- By end user, integrated brands captured a 52.90% share in 2025; however, contract packagers are projected to record the highest forecast CAGR of 5.95% through 2031.
- By geography, Germany commanded a 38.25% share in 2025, whereas Spain is forecast to post the strongest growth rate of 7.95% through 2031.
Note: Market size and forecast figures in this report are generated using Mordor Intelligence’s proprietary estimation framework, updated with the latest available data and insights as of 2026.
Worldwide, activity is shaped by contributions from multiple regions, with Europe representing one of the more structurally developed among them. The global report on bottled water processing market by Mordor Intelligence reflects how these regional layers combine into a single system.
Europe Bottled Water Processing Market Trends and Insights
Drivers Impact Analysis*
| Driver | (~) % Impact on CAGR Forecast | Geographic Relevance | Impact Timeline |
|---|---|---|---|
| Rising health-conscious consumer base | +0.8% | Germany, France, the United Kingdom | Medium term (2-4 years) |
| Heightened stringency of the EU Drinking Water Directive | +1.2% | EU-27, stricter in Germany and France | Short term (≤ 2 years) |
| Growing Private Label penetration in discount retail | +1.0% | Netherlands, Spain, France | Medium term (2-4 years) |
| Rapid proliferation of on-the-go pack sizes | +0.7% | Urban centers across Germany, France, Spain, United Kingdom | Short term (≤ 2 years) |
| Shift toward rPET content mandates | +1.3% | EU-27, early compliance in Germany, France, the Netherlands | Long term (≥ 4 years) |
| Accelerated adoption of AI-enabled inline quality control | +0.5% | Germany, Italy, Spain | Medium term (2-4 years) |
| Source: Mordor Intelligence | |||
Heightened Stringency of EU Drinking Water Directive
The revised directive tightens PFAS thresholds to 0.10 µg/L from January 2026, prompting bottlers to retrofit their ultrafiltration and activated-carbon stages, which increases greenfield line costs by 15-20%. Early enforcement in Germany favors vertically integrated brands that own protected spring sources over contract packagers reliant on municipal feedwater. Capital-expenditure pressure is therefore tilting the European bottled water processing market toward players capable of absorbing compliance spend. Material-contact clauses within the directive also accelerate the transition from legacy PVC tubing to stainless steel and FDA-grade polymers, thereby extending equipment replacement cycles.
Shift Toward rPET Content Mandates
The Packaging and Packaging Waste Regulation requires 30% recycled PET by 2030 and 65% by 2040, backed by extended producer responsibility fees that penalize virgin resin usage. Spot rPET shortages already push prices to parity with virgin resin, motivating Coca-Cola Europacific Partners to invest EUR 250 million (USD 275 million) in a Netherlands recycling facility that is set to come online in 2027. Secure rPET offtake is becoming a strategic differentiator across the European bottled water processing market, altering long-term supply contracts and favoring brands with closed-loop agreements.
Growing Private-Label Penetration in Discount Retail
Private-label bottled water achieved a 47% share in the Netherlands in 2024 and continues to rise as Aldi and Lidl deepen their partnerships with contract packagers.[1]Retail Detail, “Private Label Continues to Gain Ground in Europe,” retaildetail.eu. Retailer demand for agile molds, short lead-times, and rPET-verified packaging intensifies competition among co-packers, compressing margins for mid-tier branded bottlers. Spain and France follow the pattern, with Mercadona and Carrefour citing rPET milestones and on-shelf price gaps of 30-40% compared to national brands, which amplifies volume shifts in the European bottled water processing market.
Accelerated Adoption of AI-Enabled Inline Quality Control
AI vision systems, such as Krones Linatronic, reduce false rejects by 40% at 72,000 bph line rates, eliminating EUR 180,000 in annual waste for a typical still-water facility.[2]Krones AG, “Filling Technology and Inspection Systems,” krones.com. Predictive maintenance tie-ins from Tetra Pak’s Connected Packaging further curb unplanned downtime, widening the efficiency gap between AI-equipped factories and legacy plants. As insurers begin offering premium discounts for real-time monitoring, adoption is expected to accelerate among premium flavoured and functional water bottlers throughout the European bottled water processing market.
Restraints Impact Analysis*
| Restraint | (~) % Impact on CAGR Forecast | Geographic Relevance | Impact Timeline |
|---|---|---|---|
| Volatile virgin PET resin prices | -0.9% | EU-27, acute in Italy and Spain | Short term (≤ 2 years) |
| Rising municipal tap-water campaigns | -0.6% | Germany, France, United Kingdom urban centers | Medium term (2-4 years) |
| High CAPEX for aseptic filling lines | -0.7% | Premium-segment entrants across the EU-27 | Long term (≥ 4 years) |
| Scarcity of qualified maintenance personnel | -0.4% | Germany, France, and Italy's industrial belts | Medium term (2-4 years) |
| Source: Mordor Intelligence | |||
Volatile Virgin PET Resin Prices
European virgin PET traded between EUR 1,100 and EUR 1,500 per ton in 2024, with 25% intra-year swings tied to energy and feedstock shocks. Still-water bottlers with quarterly retailer contracts have limited pass-through flexibility, so margin compression frequently erodes operating leverage. Italian mineral-water players experienced sharp Q3 2024 hits when Brent crude oil reached USD 95 per barrel, underscoring the raw-material exposure in the European bottled water processing market.[3]German Federal Ministry for the Environment, “Deposit Return System Performance Data,” bmu.de.
High CAPEX for Aseptic Filling Lines
Aseptic systems cost EUR 5 million - EUR 8 million (USD 5.5 million - USD 8.8 million) per line, including sterile air, peroxide sterilization, and ISO-class cleanrooms, keeping functional water production largely in the hands of deep-capital incumbents, such as Tetra Pak.[4]Tetra Pak, “Aseptic Processing Technology,” tetrapak.com. Contract packagers seeking to supply premium private-label SKUs encounter minimum-order and payback hurdles that hinder entry, limiting downstream innovation and hindering segment diversification in certain parts of the European bottled water processing market.
*Our forecasts treat driver/restraint impacts as directional, not additive. The impact forecasts reflect baseline growth, mix effects, and variable interactions.
Segment Analysis
By Equipment Type: Blow Molders Gain as Lightweighting Meets rPET Compliance
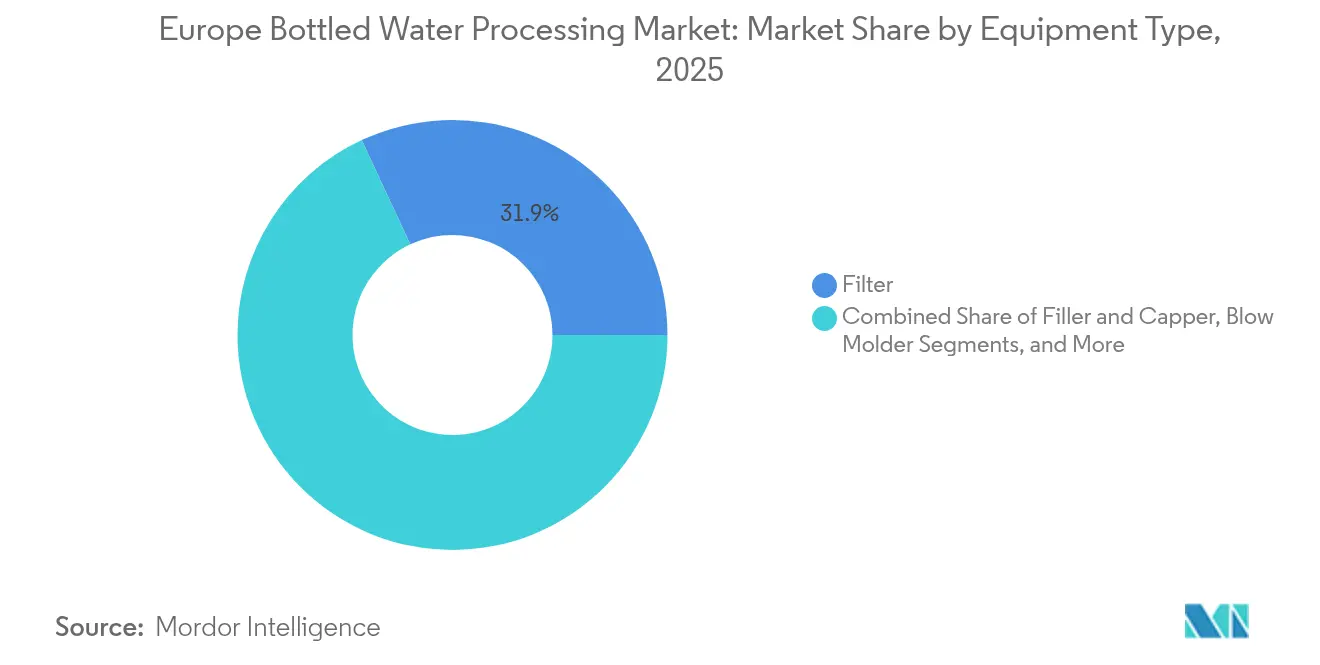
Filters held the largest 31.94% share in the European bottled water processing market in 2025, reflecting the universal demand for particulate and microbial control. Both reverse-osmosis and ultrafiltration modules sustain recurring replacement revenue for suppliers, with membrane life cycles of 18-24 months ensuring stable aftermarket sales. Lightweighting pressures and retailer sustainability targets are, however, driving the acceleration of blow-molded installations. The Sidel Matrix platform reduces preform weight by 12% while maintaining 10 N top-load strength, resulting in material savings of approximately EUR 0.008 per bottle and a fast two-to-three-year payback. Integrated majors often couple blow-molders with high-speed fillers to optimize line balance, whereas contract packagers seek standalone modular units for multi-SKU runs.
The blow-molded CAGR of 6.28% through 2031 surpasses filters as brands pursue in-house preform-to-bottle control, a critical requirement for managing 30%–50% rPET blends. Fillers and capers remain essential, yet their growth tracks overall line buildouts rather than outpacing niche equipment. Bottle washers retain a limited share, mostly inside German glass-returnable operations. Secondary equipment, such as labelers, palletizers, and conveyors, adheres to price-competitive procurement, opening the door for Asian vendors in Southern and Eastern Europe. Technology suppliers respond with end-to-end service bundles, promising up-time guarantees that ease staffing gaps across the European bottled water processing market.



By Technology: UV Disinfection Gains on Energy Economics and Taste Neutrality
Reverse osmosis accounted for a 40.83% share in 2025, driven by its ability to remove dissolved solids and PFAS below detection limits. Energy draw, at 0.4–0.6 kWh per m³, and 20%–30% reject water, nevertheless drives operating cost debates. UV disinfection, which is expanding at a 7.1% CAGR, uses 70% less electricity than ozone and avoids the residual chlorine taste, appealing to premium still and flavored SKUs seeking clean-label cues. Pentair’s Sanitron units, with a throughput of 150 m³ per hour, deliver a 4-log Cryptosporidium reduction without forming disinfection byproducts, aligning with the European bottled water processing market's pivot toward taste integrity.
Support microfiltration, ultrafiltration, and chlorination, maintain midpoint shares, competing on plant-specific water chemistry and regulatory context. Ozone retains a role in sparkling-water lines for concurrent carbon dioxide scavenging, yet its share declines as UV systems integrate with AI-based quality monitoring. As energy tariffs climb and EU carbon-pricing deepens, ROI on UV retrofits strengthens, particularly in Spain and Italy, where kilowatt-hour costs outpace the EU average.
By Application: Flavored Water Rides Health-and-Wellness Tailwinds
Stillwater secured a 63.43% share of the European bottled water processing market in 2025, primarily through premiumization into larger pack sizes and mineral-rich variants. Volume adds trail value growth, signaling market maturity. Flavoured water, expanding at 7.36% CAGR, entices cola-leavers seeking low sugar and natural essences. Brands such as Vittel Infusions and Volvic Juicy employ aseptic filling to preserve delicate aromatics and use inline blending systems that maintain ±2% flavor dosing accuracy. Sparkling water, although smaller in scale, is gaining traction in export-oriented German mineral brands as consumers in Benelux and the United Kingdom trade up from cola.
Processing complexity scales with flavor diversification. Aseptic lines that combine high-shear blending, inline deaeration, and low-oxygen closures become standard for functional SKUs. Retail planograms reflect this migration, dedicating more shelf frontage to zero-calorie infused waters and electrolyte-enhanced sparkling lines. Contract packagers with the requisite aseptic infrastructure capture incremental private-label business, reinforcing the segmentation-led expansion of the European bottled water processing market.
By Packaging Material: PET Dominance Persists Despite Sustainability Headwinds
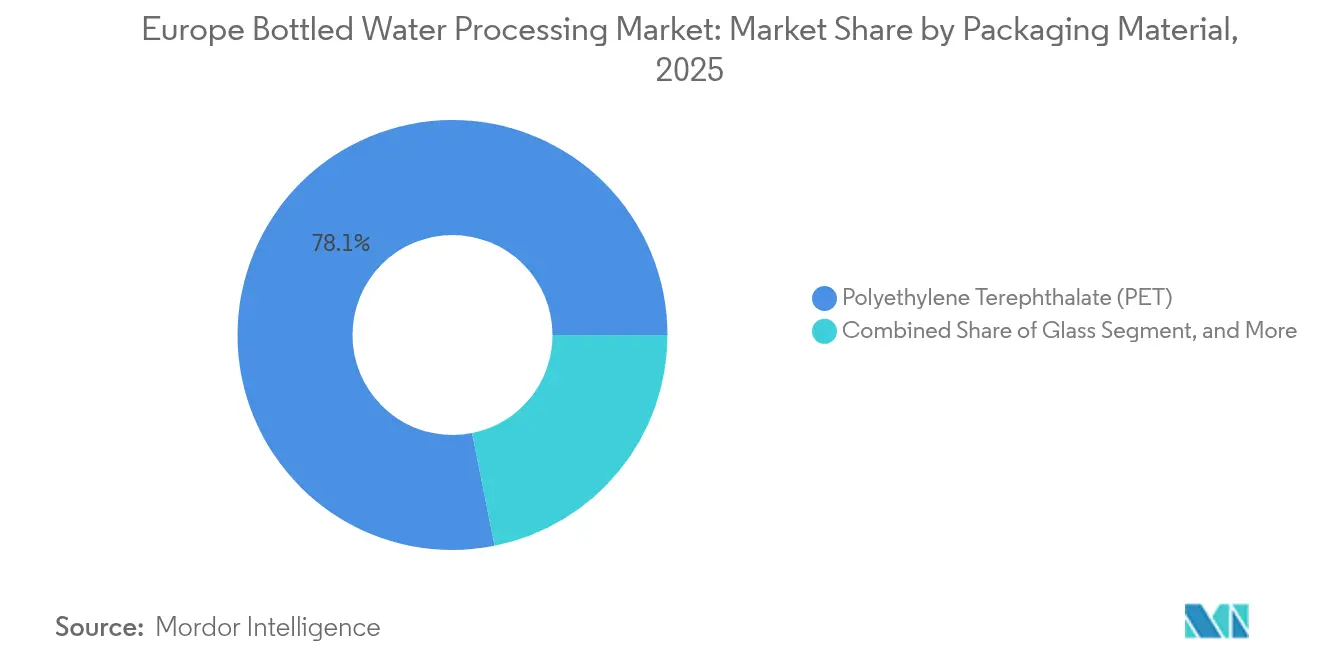
Polyethylene terephthalate commanded 78.14% of the packaging material share in 2025 within the European bottled water processing market and is projected to expand at a 6.25% CAGR through 2031, making it the fastest-growing substrate. This level gives PET the highest European bottled water processing market share by a wide margin. Its ascendancy rests on light weight, impact resistance, shelf appeal, and an extensive deposit-return network that keeps recycling rates high. Coca-Cola Europacific Partners highlighted these advantages in 2024 by introducing a 100% rPET still-water bottle that weighs 23 g, a 17% reduction from the 28 g of a virgin-PET equivalent, resulting in an 8% decrease in pallet transport emissions. Regulatory demands for 30% recycled content by 2030, rising on-the-go consumption of single-serve drinks, and advances in blow molding that trim wall thickness to 0.28 mm without sacrificing top-load strength keep PET on a strong growth path. Germany’s deposit-return system, which collected 93% of PET bottles in 2024, assures bottlers of steady rPET feedstock even when virgin resin prices swing.
By End User: Contract Packagers Gain as Brands Pursue Asset-Light Models
Integrated brands captured a 52.90% share in 2025 by controlling source, processing, and distribution economics within the European bottled water processing market. Yet their CAGR lags segment averages because capital is shifting toward marketing and route-to-market. Nestlé Waters outsourced an additional 80 million L to Niagara in 2025, signaling a pivot to asset-light tactics. Contract packagers, led by Refresco, are advancing 5.95% CAGR on the back of private-label demand and seasonal flex requirements. Scale allows them to absorb rPET surcharge risk and amortize aseptic lines across multiple SKUs.
Retail consolidation amplifies this model: the top five EU grocers now hold 38% of bottled-water volume, negotiating private-label exclusives that only large co-packers can supply. Smaller bottlers, caught between rPET compliance costs and price-led tenders, confront margin erosion. Investment, therefore, shifts to flexible lines capable of rapid mold and flavor changeovers, reinforcing the bifurcation trend across the European bottled water processing market.
Geography Analysis
Germany held a 38.25% share in 2025, underpinned by 530 registered mineral sources and a consumer preference for carbonated formats, which were priced 25-35% higher than still formats. Deposit-return systems capturing 93% PET collection supply rPET feedstock, prompting EUR 198 million in recycling investments since 2022. Domestic competition remains fragmented, with more than 200 bottlers defending regional proof of claims that resonate in the European bottled water processing market. High-line speeds and strict quality audits are pushing German plants toward AI-enabled inspection and blow-mold integration to maintain cost competitiveness.
Spain is projected to post the fastest growth rate of 7.95% through 2031. The tourism resurgence in coastal regions led to an 18% increase in bottled-water consumption in 2024, while export demand to North Africa and the Middle East gained momentum with the rise of halal certifications. Twelve new lines came online in 2024, mainly in Catalonia and Valencia, totaling EUR 104.5 million in investment. Spain’s 30% rPET mandate by 2027, three years ahead of EU targets, accelerates closed-loop initiatives, reinforcing local recycling ecosystems feeding the European bottled water processing market.
France, Italy, and the United Kingdom collectively account for 34.65% of the value. France excels in premium mineral exports; Italy dominates HORECA channels through regional brands; the United Kingdom faces headwinds from the installation of 1,800 public refill stations by 2024, which dampens single-serve PET growth. Yet private-label share in UK retailers tops 52%, steering co-packer capital toward lightweight PET alternatives for impulse channels.
Mordor Intelligence provides coverage of the bottled water processing market across other key regional markets, including North America, each with their regulatory frameworks and demand patterns.
Regulatory Landscape
EU compliance priorities for bottled water processing in Europe are being shaped by tightening water-quality and packaging rules. On the water side, the revised EU Drinking Water Directive framework is being implemented in 2026, with the RD-referenced PFAS threshold of 0.10 micrograms per liter from January 2026 increasing retrofit demand for activated carbon, ultrafiltration, and RO polishing stages, particularly for packagers using municipal feedwater. On the packaging side, Regulation (EU) 2025/40 on packaging and packaging waste (PPWR) entered into force on 11 February 2025 and applies from 12 August 2026, setting requirements such as packaging recyclability by 2030, deposit-return system rollout deadlines (by 2029 for single-use plastic or metal beverage containers), and escalating reuse obligations for beverage distributors (10% reusable packaging by 2030, rising to 40% by 2040).
Together, these measures raise the compliance bar for both process validation and packaging-system design. PPWR timelines reinforce the shift already visible in PET and rPET-ready bottling lines by pushing brand owners and co-packers toward verified recycled-content sourcing, traceable packaging specifications, and, where applicable, reuse-compatible formats. Some beverage categories with aseptic shelf-life requirements face carve-outs in reuse targets, which keeps aseptic and high-hygiene processing investments commercially relevant in the near term.
Value Chain Analysis
The Europe bottled water processing value chain covers water sourcing (natural mineral sources or municipal feedwater), treatment and process control (filtration, RO/UF, UV/ozone as applicable), packaging conversion (preforms, closures, labels, and bottle manufacturing via blow molding), filling and secondary packaging, and downstream distribution into retail and HORECA. Upstream resin and additive suppliers (for PET and other packaging polymers) affect cost and availability, while rPET supply increasingly depends on deposit-return collection performance and recycler output, particularly in high-collection markets such as Germany. Equipment OEMs and system integrators covering filling, blow molding, inspection, and water-treatment skids are supported by consumables and service layers, including membrane replacements on 18-24 month cycles and predictive-maintenance contracts that help reduce downtime and respond to maintenance labor constraints.
Midstream, bottlers and co-packers create differentiation through line speed, changeover flexibility, and quality assurance, with private-label tender cycles and rPET documentation tightening requirements for traceability and process control. The service ecosystem is also broadening: Pall positions bottled-water filtration offerings around lowering total cost of ownership through fewer elements and smaller vessels, while smaller automation specialists such as Liquid Packaging Solutions supply auxiliary equipment (for example bottle handling, rinsing, and indexing systems) for multi-SKU operations. Macro feedstock volatility remains a recurring risk node, and Dow has flagged ongoing supply chain disruption pressures through 2026, which can flow into packaging-material lead times and pricing across bottling supply chains.
Competitive Landscape
The European bottled water processing market is characterized by moderate concentration, with the top five equipment suppliers, Krones, Sidel, GEA, Tetra Pak, and Alfa Laval, capturing roughly 62% of the 2024 installations. However, the top ten bottlers held only 48% of the retail value. Equipment firms differentiate through digital twins, financing, and predictive service contracts. Krones’ 2024 digital twin launch claims a 12% total cost-of-ownership reduction, deepening lock-in throughout the equipment's life cycle. Tetra Pak’s A3/Speed filler, unveiled in June 2025, reduces peroxide sterilization time to 4.2 seconds, lowering entry barriers for mid-tier flavoured-water launches.
Three archetypes shape bottler strategies. Integrated majors such as Danone and Nestlé invest in sustainability storytelling and premium SKUs. Regional specialists, such as Gerolsteiner, defend their home markets with mineral provenance and HORECA relationships. Contract packagers, exemplified by Refresco, scale across borders and retailer-specific programs. Horizontal consolidation inches forward: Alfa Laval’s 2024 membrane-filtration acquisition deepens turnkey capabilities, and Refresco’s 2025 Spanish plant buy bolsters Mediterranean reach.
Europe Bottled Water Processing Industry Leaders
Dow Chemical Co
Pall Corporation
Liquid Packaging Solutions Inc
Velocity Equipment Solutions Inc
Norland International Inc
- *Disclaimer: Major Players sorted in no particular order

Market Opportunities and Future Outlook
PPWR implementation timing (entered into force in February 2025, applies from August 2026) creates near-term whitespace for rPET-verified, recyclability-aligned packaging systems and for process and data capabilities that help producers evidence compliance across multi-country operations. The market is already showing rPET supply-chain actions that feed into processing and packaging line decisions, including Coca-Cola Europacific Partners committing EUR 250 million to a Netherlands recycling facility planned to come online in 2027. This supports higher-confidence rPET offtake and encourages bottlers to specify rPET-capable blow molding and inspection configurations. In parallel, the tightening PFAS-related requirements referenced in the RD for January 2026 increase demand for retrofit packages (activated carbon, UF/RO polishing, and associated monitoring), particularly for packagers without protected spring sources.
Operationally, there is opportunity for equipment and component suppliers to reduce barriers tied to high capex and labor scarcity by bundling automation, digital inspection, and service. AI-enabled inspection systems used at high line rates and Pall’s positioning around capex and footprint reduction align with bottlers and co-packers looking to upgrade compliance capability without proportionate facility expansion. PPWR’s reuse and deposit-return direction also increases demand for line flexibility, including format handling, traceability, and quality controls, as producers manage a wider mix of pack sizes and packaging specifications across discount retail and branded portfolios.
Recent Industry Developments
- June 2026: The Dow and Univar Solutions sign long-term distribution agreement for Dow's Decarbia low-carbon products. The deal expands access to low-carbon packaging materials across Europe, supporting supply-chain decarbonization. The arrangement strengthens Dow's low-carbon packaging tech reach across Europe and beyond through a logistics partner.
- May 2026: The Dow Chemical Company and Pembina Pipeline sanction an amended ethane supply agreement to Dow. The arrangement provides feedstock security for Dow’s Path2Zero packaging projects, helping stabilize material inputs for regional bottling initiatives. The action secures ethane supply critical for future capacity expansion in European bottling applications.
- November 2025: Krones AG enhances its AI driven inspectors achieving reliability greater than 99.9 percent to reduce bottle bursts. The development improves equipment level quality control on bottling lines, contributing to smoother operations and fewer production disruptions. The upgrade strengthens line automation capabilities central to European bottled water processing modernization.


Research Methodology Framework and Report Scope
Market Definition and Coverage
For this report, the market covers the value generated from processing bottled water across Europe, starting from raw water treatment and moving through blowing, filling, capping, labeling, and end-of-line checks that prepare bottles for shipment.
Scope exclusions: We do not count retail sales value of bottled water, or the value of caps, labels, bottles, and cartons when they are sold as standalone packaging materials.
Segmentation Overview
- By Equipment Type
- Filter
- Filler and Capper
- Blow Molder
- Bottle Washer
- Other Equipment Types
- By Technology
- Reverse Osmosis
- Microfiltration
- Ultrafiltration
- Chlorination
- UV Disinfection
- Other Technologies
- By Application
- Still Water
- Sparkling Water
- Flavoured Water
- By Packaging Material
- Polyethylene Terephthalate (PET)
- Glass
- High-Density Polyethylene (HDPE)
- Other Packaging Materials
- By End User
- Integrated Bottled Water Brands
- Contract Packagers
- Private Label Producers
- By Geography
- United Kingdom
- Germany
- France
- Italy
- Spain
- Rest of Europe
Data Sources, Market Sizing, and Validation
Desk Research
We began by mapping the industry flow, which helped us separate processing activity from packaged water brand revenue and from upstream packaging material markets. To anchor volumes and compliance context, we referred to public sources such as Eurostat (production, trade, and industrial indicators), the European Environment Agency (waste and recycling signals), the European Commission (food contact and drinking water related rules), and FAO statistics where relevant for water-related supply context.
Next, the desk work was used to build input ranges for plant throughput, typical line configurations, and replacement cycles, and these ranges were then tested in interviews. Company annual reports and investor presentations helped identify major capacity expansions and capex priorities, while patents databases were used to see which processing steps were getting more automation and quality monitoring. We also used a paid subscription for company financials, and a separate paid subscription for import and export shipment-level checks where public series lacked detail. These desk sources are illustrative, and we relied on additional public and paid references to collect data, validate assumptions, and clarify open questions.
Primary Interviews and Surveys
To close the gaps left by public data, we conducted structured interviews and short surveys with equipment-side experts, plant operations staff, quality teams, and distributors that support bottling lines across Europe. The discussions focused on what is actually being installed or replaced, how pricing changes with automation and compliance features, and how utilization shifts by country and by water type, and then we applied those learnings back into the model.
Distribution of primary research fieldwork respondents
| Company type | Respondent position |
|---|---|
| Top tier: 32% | CXOs: 20% |
| Mid tier: 47% | Functional/Unit leaders: 39% |
| Smaller Players: 21% | Managers: 41% |
Market-Sizing & Forecasting
Sizing started with a top-down build where production and trade indicators, packaged water output proxies, and the implied number of active bottling lines were reconstructed by country and then rolled up to Europe. We then checked the totals using selective bottom-up approximations, including sampled line capacity by bottles per hour, typical operating shifts, and a price-per-line or price-per-module view for major process steps, which helped us adjust for under-reporting in smaller sites.
Key inputs used in the model include the pace of line automation upgrades, rPET readiness and related changeovers, inspection and quality compliance intensity, average line utilization by season, and the typical replacement cycle for major modules (filling, blowing, filtration, and labeling). For forecasting, we used scenario analysis supported by a simple multivariate relationship, where macro beverage demand and industrial investment signals set the direction, and interview feedback set the practical limits on how fast projects can be executed. When bottom-up signals were thin for niche technologies, we used a conservative adoption curve and then validated it through follow-up calls before it was kept in the final build.
Data Validation & Update Cycle
Outputs were checked against independent signals, such as implied processing intensity per liter, country-level production patterns, and the timing of known capacity additions, and then outliers were reviewed again before sign-off. When variances were large, we re-contacted respondents to confirm whether the issue was scope, timing, or pricing, and we also revisited currency conversion assumptions to keep the series comparable.
Reports are refreshed annually, and interim updates are made when a material event changes investment behavior, regulation timing, or input pricing. Before delivery, an analyst completes a final pass to confirm that the latest public releases and fresh interview notes are reflected in the numbers clients receive.
Mordor Intelligence's Europe Bottled Water Processing Market Size Measured Against Other Published Estimates
Published market sizes for bottled water processing in Europe can look far apart because authors do not always treat price timing, currency conversion, and what counts as processing in the same way. Differences also show up when one estimate leans on demand value for bottled water, while another leans on equipment spend or plant capex cycles.
The spread usually comes from how average selling prices are escalated over the forecast window, whether values are kept in constant dollars or converted using a single year rate, and how often the assumptions are refreshed after cost shocks and new sustainability rules. In our work, those refresh checks are done at the variable level, and the latest currency timing and ASP progression are re-tested through interviews before the final number is locked, which is a modeling discipline applied by Mordor Intelligence.
Benchmark comparison
| Source | Market Size | Gaps in Research Methodology |
|---|---|---|
| Mordor Intelligence | USD 38.98 B (2025) | |
| Regional Consultancy A | USD 35.20 B (2024) | Uses an earlier base year and holds pricing closer to a constant-dollar view, which can understate the post-2022 uplift in automation and compliance-linked module pricing in some countries. |
| Trade Journal B | USD 44.60 B (2025) | Appears to fold in broader packaged water value and related packaging line spend, which inflates totals when processing activity is not separated from brand revenue and adjacent packaging equipment. |
Overall, the table shows that year selection, what is counted as processing, and how pricing is updated explain most of the gap. By keeping the scope tied to processing steps and then re-validating ASP timing and utilization assumptions during refresh, we keep the estimate traceable to clear inputs and repeatable checks.


Key Questions Answered in the Report
What is the current value of the Europe bottled water processing market?
It is valued at USD 41.06 billion in 2026 with a 5.33% CAGR forecast to 2031.
Which equipment segment is expanding fastest?
Blow molders, advancing at a 6.28% CAGR as brands pursue lightweighting and rPET integration.
Why is UV disinfection gaining traction?
UV systems cut energy use by 70% versus ozone and avoid residual chlorine taste, supporting premium still and flavoured waters.
Which country leads regional market share?
Germany dominates with 38.25% share, supported by its extensive mineral-water tradition and recycling infrastructure.
How are private-label dynamics influencing processors?
Retailers in Spain, the Netherlands, and France raise private-label volumes, pushing contract packagers to invest in flexible, rPET-ready lines.
What limits entry into functional bottled water?
Aseptic filling lines cost EUR 5 million – EUR 8 million, a capital hurdle deterring smaller bottlers.
Page last updated on:


 Your data is secure and never sold or shared.


