
Non-vascular Stents Market Size and Share
Market Overview
| Study Period | 2020 - 2031 |
|---|---|
| Market Size (2026) | USD 1.89 Billion |
| Market Size (2031) | USD 2.31 Billion |
| Growth Rate (2026 - 2031) | 4.18 % |
| Fastest Growing Market | Asia Pacific |
| Largest Market | North America |
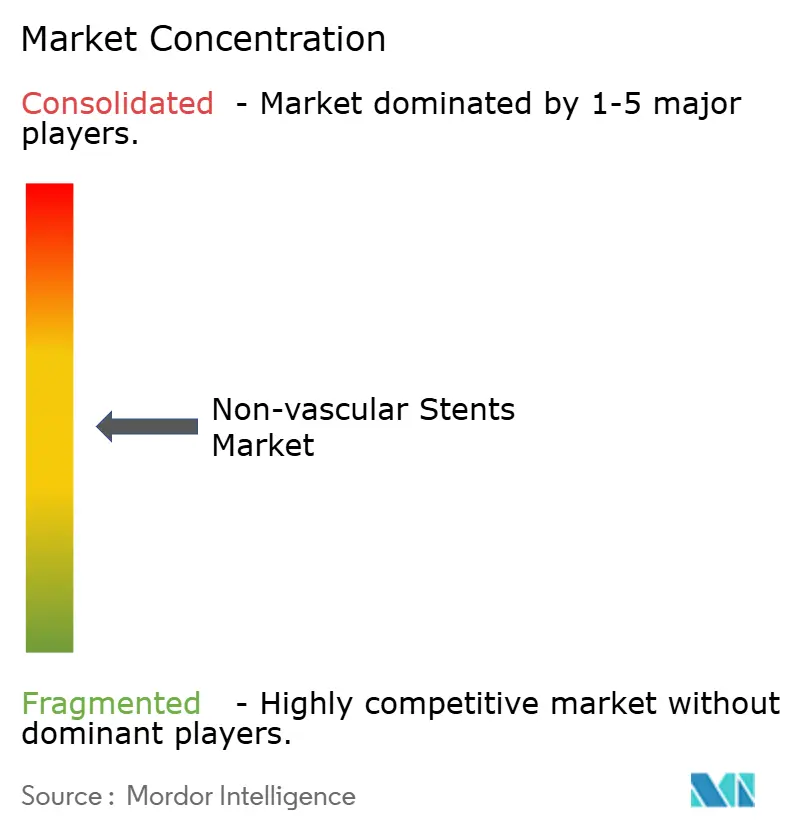
| Market Concentration | Medium |
Major Players *Disclaimer: Major Players sorted in no particular order Image © Mordor Intelligence. Reuse requires attribution under CC BY 4.0. | |
Non-vascular Stents Market Analysis by Mordor Intelligence
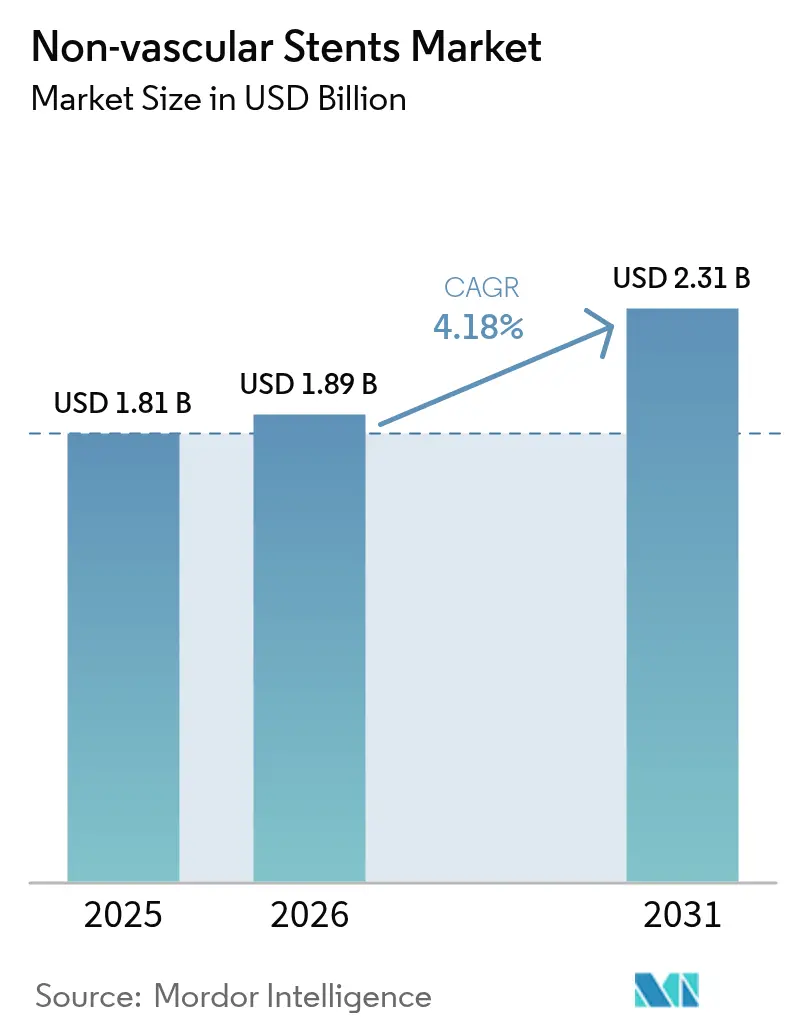
The non-vascular stents market size was valued at USD 1.81 billion in 2025 and estimated to grow from USD 1.89 billion in 2026 to reach USD 2.31 billion by 2031, at a CAGR of 4.18% during the forecast period (2026-2031). The measured growth pace reflects a maturing segment in which material science breakthroughs, especially bioresorbable polymers and patient-specific 3-D printing, complement entrenched metallic designs to meet diverse clinical demands. Manufacturers are absorbing up to 20% increases in specialty-alloy input costs, yet long-term demand resilience is anchored in a rapidly aging global population, a wider clinical shift toward minimally invasive procedures, and regulatory programs that shorten time-to-market for breakthrough devices. Competitive differentiation centers on novel coatings that curb restenosis, software-guided deployment systems that enhance procedural precision, and closer alignment between device life-cycle and sustainability mandates. Pulmonary, biliary and tracheal indications illustrate how procedure volumes continue to migrate from open surgery to endoscopic and bronchoscopic routes, reinforcing willingness to pay for advanced stent platforms.
Key Report Takeaways
- By product type, gastrointestinal devices led with 41.98% of non-vascular stents market share in 2025, while pulmonary stents are projected to log the fastest 7.41% CAGR through 2031.
- By material, metallic devices held 61.10% share of the non-vascular stents market size in 2025; bioresorbable and drug-eluting coated variants are advancing at an 8.63% CAGR.
- By design, self-expandable formats commanded 70.75% of non-vascular stents market share in 2025 and are tracking a 6.32% CAGR to 2031.
- By end user, hospitals accounted for 64.70% share of the non-vascular stents market size in 2025, whereas ambulatory surgical centers are growing at 6.56% CAGR.
- By geography, North America captured 36.10% revenue share in 2025, but Asia-Pacific is pacing the field with a 7.52% CAGR through 2031.
Note: Market size and forecast figures in this report are generated using Mordor Intelligence’s proprietary estimation framework, updated with the latest available data and insights as of 2026.
Market Trends and Insights
Drivers Impact Analysis of Non-vascular Stents Market*
| Driver | (~) % Impact on CAGR Forecast | Geographic Relevance | Impact Timeline |
|---|---|---|---|
| Growing Geriatric Population & Chronic Disease Prevalence | +1.2% | Global, with highest impact in North America & Europe | Long term (≥ 4 years) |
| Technological Advancements In Materials & Coatings | +0.8% | Global, led by North America & APAC innovation hubs | Medium term (2-4 years) |
| Rising Demand For Minimally-Invasive Procedures | +0.7% | Global, accelerated in developed markets | Short term (≤ 2 years) |
| 3D-Printed Patient-Specific Stents Gain Clinical Traction | +0.4% | North America & Europe early adoption | Medium term (2-4 years) |
| Fast-Track Regulatory Pathways | +0.3% | Primarily North America & Europe | Short term (≤ 2 years) |
| Advantages Associated with Biodegradable Polymer Stents | +0.5% | Global, with premium market focus | Long term (≥ 4 years) |
| Source: Mordor Intelligence | |||
Growing Geriatric Population and Chronic Disease Prevalence
Population aging intersects with higher incidences of gastrointestinal, pulmonary and urological disorders, lifting procedure volumes across every therapeutic class within the non-vascular stents market.[1]Yongduo Yu, “Global burden of paralytic ileus and intestinal obstruction in adults aged 65 and over,” BMC Gastroenterology, biomedcentral.com Forecasts to 2040 show colorectal, pancreatic and liver cancers remaining on an upward trajectory, creating multi-organ intervention requirements among elderly cohorts, whose tissue fragility and comorbidities demand stents with improved conformability and reduced inflammatory profiles. Growth therefore reflects not only rising absolute case numbers but also repeat procedures as patients live longer with chronic conditions.
Technological Advances in Materials and Coatings
Next-generation molybdenum-rhenium alloys combine high fatigue strength with biocompatibility, unlocking new design freedom beyond conventional nitinol Argus Media. Laser micro-patterning techniques can suppress smooth-muscle proliferation by 75% while enhancing endothelialization twofold. Drug-free collagen-functionalized platforms similarly shorten healing times without relying on anti-proliferative agents.[2]Haoshuang Wu, “A drug-free cardiovascular stent functionalized with tailored collagen supports in-situ healing of vascular tissues,” Nature Communications, nature.com Collectively, these innovations are widening addressable patient pools by reducing restenosis risks and metal allergy concerns.
Rising Demand for Minimally Invasive Procedures
Venous sinus stenting for idiopathic intracranial hypertension carries <1% complication risk and yields symptom relief inside 3 months, exemplifying the procedural shift toward low-trauma solutions. Electrocautery-enhanced lumen-apposing metal stents achieve 94.8% technical and 100% clinical success in gallbladder drainage for high-risk surgical patients, displacing open cholecystectomy in fragile populations. These outcomes underscore payer and provider preference for same-day discharge pathways that compress inpatient costs.
3-D-Printed Patient-Specific Stents
FDA clearance of individualized oral stents and the production of more than 600 airway implants through AI-driven design workflows demonstrate how additive manufacturing personalizes lumen geometry to each patient. Validated finite-element models now forecast balloon-expandable stent behavior under patient-specific loading, refining sizing accuracy and limiting over-expansion risks. Hospitals are exploring in-house 3-D print farms to fabricate biodegradable ureteral devices that degrade 11% in three weeks, pointing to a future of just-in-time production and streamlined logistics.
Restraints Impact Analysis of Non-vascular Stents Market*
| Restraint | (~) % Impact on CAGR Forecast | Geographic Relevance | Impact Timeline |
|---|---|---|---|
| Complications: Migration, Occlusion & Infection | -0.6% | Global, higher impact in emerging markets | Short term (≤ 2 years) |
| Availability Of Alternative Therapies | -0.4% | Developed markets with advanced healthcare | Medium term (2-4 years) |
| Supply-Chain Risk For Ni-Ti Alloys & Rare Metals | -0.3% | Global, concentrated in manufacturing hubs | Short term (≤ 2 years) |
| Sustainability Pressure On Single-Use Devices | -0.2% | Europe & North America regulatory focus | Long term (≥ 4 years) |
| Source: Mordor Intelligence | |||
Complications: Migration, Occlusion and Infection
Biliary stent migration appears in 8.4% of treated patients and frequently triggers cholangitis or obstruction that require urgent retrieval, adding cost and clinical burden. Rare intracardiac displacement of ureteral devices illustrates the severity spectrum, with endovascular extraction and multidisciplinary care raising hospital resource use. Despite improved anchoring designs, complication anxiety weighs on clinician decision-making, especially in regions lacking advanced retrieval tools.
Availability of Alternative Therapies
Drug-coated balloons now treat in-stent restenosis without leaving behind permanent scaffolds; 2025 literature confirms durable lumen patency and 96.7% procedural success, thereby challenging repeat stenting in coronary interventions. EUS-guided gastroenterostomy delivers superior re-intervention rates versus metallic stents for gastric outlet obstruction, steering gastroenterologists toward anastomosis over stenting in complex malignancies. As clinicians gain confidence in these modalities, share-of-procedure for non-vascular stents may plateau in select indications.
*Our forecasts treat driver/restraint impacts as directional, not additive. The impact forecasts reflect baseline growth, mix effects, and variable interactions.
Non-vascular Stents Market Segment Analysis
By Product Type:
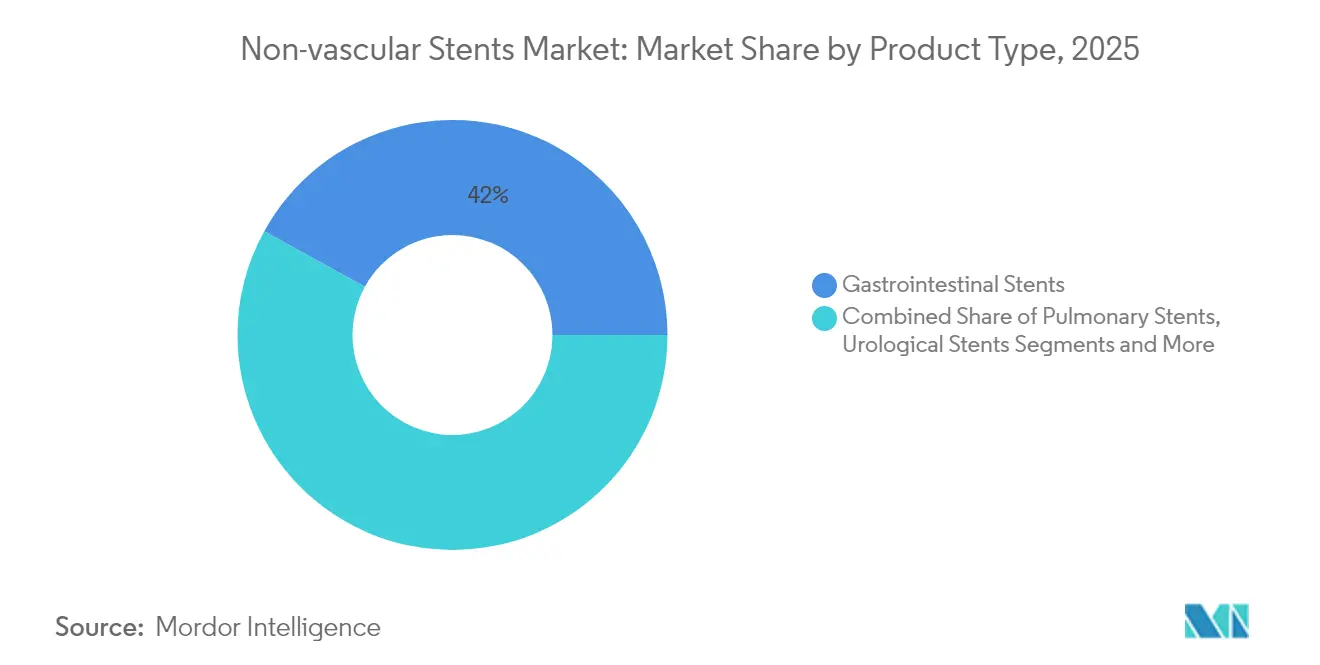
Gastrointestinal Dominance Faces Pulmonary ChallengeGastrointestinal platforms generated 41.98% of the non-vascular stents market in 2025 on the strength of entrenched protocols for esophageal, biliary and colorectal procedures. Hospitals deploy self-expandable metal designs to treat malignant obstruction where palliative decompression can avert emergency surgery and preserve quality of life. Technical success consistently exceeds 90%, while fully covered devices are entering benign esophageal strictures, broadening application scope. Pulmonary stents, although a smaller base, are expanding 7.41% per year as interventional pulmonology gains acceptance for both malignant airway obstruction and benign tracheobronchomalacia.
Clinical guidelines now position silicone and hybrid metal-silicone tubes as first-line for central lesions, but biodegradable polydioxanone alternatives have achieved 89.7% effectiveness in adult cohorts after two months, easing later removal. Custom tracheobronchial units produced through AI-enabled 3-D modeling further compress lead times compared with labor-intensive manual molding. In parallel, urological devices continue to capture physician mind-share thanks to extractable strings that cut removal pain scores from 5.23 to 0.86 and slash dwell time to 16 days, saving patients USD 146 in follow-up costs. Oral oncology stents represent another high-value niche, protecting surrounding tissue during radiotherapy and underscoring how additive manufacturing unlocks low-volume bespoke use cases.



By Material Type:
Metallic Supremacy Challenged by Biodegradable InnovationMetallic constructions, primarily nitinol, contributed 61.10% of 2025 revenue, benefiting from decades of clinical familiarity, high radial force and kink resistance. Supply chain turbulence, however, has raised alloy costs by 20%, prompting both diversification and renewed interest in iron and magnesium bioresorbables. Second-generation magnesium scaffolds such as AMS-2.1 restore vessel strength yet complete degradation inside 720 days, answering clinician calls for temporary support that avoids permanent caging. Iron scaffolds still corrode too slowly, though surface texturing and galvanic coupling show early promise.
Polymer-based designs accelerate degradation but often rely on metallic backbones for strength; hybrid models therefore combine poly-l-lactide or poly-dioxanone sleeves with thin nitinol frameworks. Drug-eluting layers using sirolimus or paclitaxel further cut neointimal hyperplasia, supporting 8.63% growth for coated systems. Sustainability mandates are also shaping R&D, with firms testing cellulose-based delivery sheaths and recyclable tray materials to align with EU packaging rules effective in 2026.
By Design:
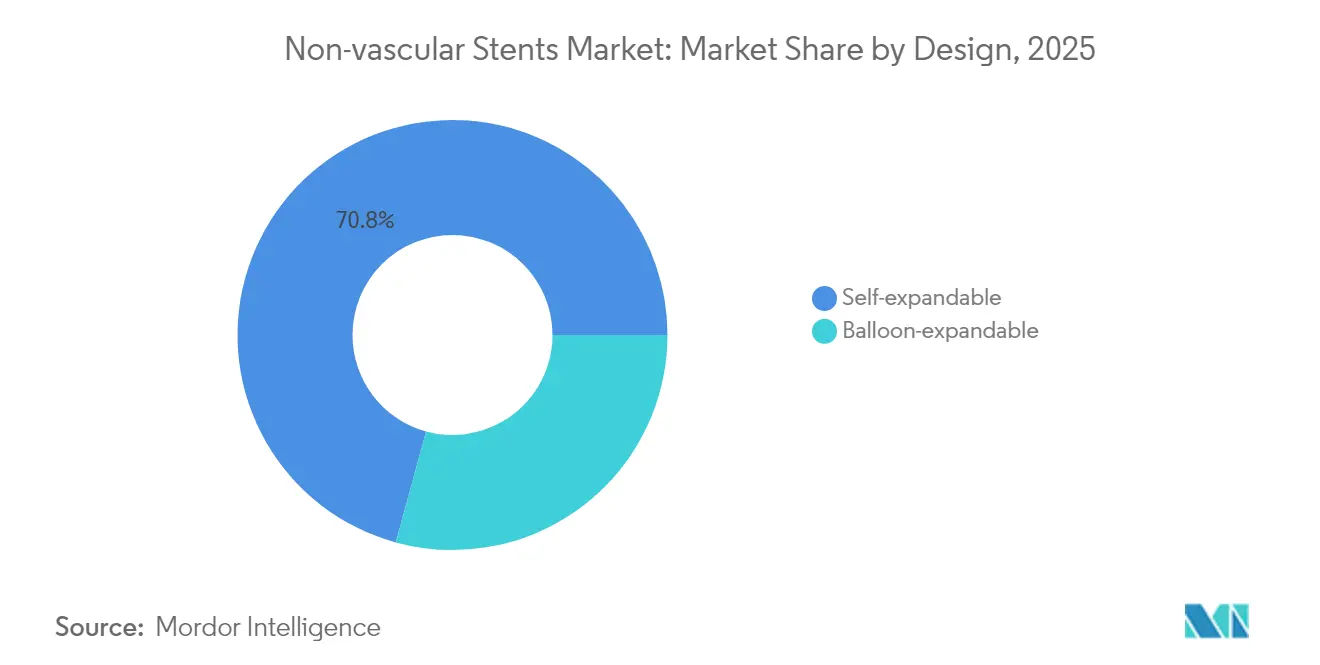
Self-Expandable Dominance Reflects Clinical PreferenceSelf-expandable formats captured 70.75% of non-vascular stents market share in 2025 because they adapt to anatomical changes, tolerate compression and simplify sizing in tortuous ducts. Five-year outcomes from the MER carotid study illustrate the durability of braided nitinol constructs, which reported only 7% restenosis at follow-up. For gastrointestinal cases, radial force must balance luminal patency against tissue over-expansion; braided designs offer a gentle force curve that limits perforation risk. Balloon-expandable devices maintain relevance where precise diameters and symmetric expansion are critical, especially in calcified colonic strictures. New digital sizing algorithms simulate expansion against real-time CT models, trimming oversizing complications. Emerging shape-memory polymers may bridge both paradigms by delivering self-expansion with programmable final diameters.
By End User:
Hospital Dominance Faces Outpatient MigrationHospitals retained 64.70% of the non-vascular stents market size in 2025 given their ability to manage high-risk patients and respond to procedural emergencies. Interventional suites equipped with fluoroscopy and anesthesiology teams remain essential for complex airway and biliary cases. Nevertheless, ambulatory surgical centers are posting a 6.56% CAGR as payers encourage site-of-service shifts that lower total episode cost. Same-day discharge after colorectal decompression or ureteral stent placement is increasingly routine when post-operative pain and bleeding risks are minimal. Specialized digestive-disease clinics now conduct routine stent exchanges under conscious sedation, freeing hospital capacity for acute care. Reimbursement parity initiatives in the United States and Japan continue to propel outpatient penetration as long as patient safety benchmarks remain uncompromised.
Geography Analysis
North America Non-vascular Stents Market
North America consolidated 36.10% revenue in 2025, buoyed by Medicare coverage pathways that guarantee reimbursement for breakthrough devices within six months of FDA clearance.The FDA has already granted 1,041 Breakthrough Device designations, 128 of which reached the market, turbo-charging domestic adoption of advanced polymer and AI-assisted platforms. Outpatient migration is particularly strong, with hospital outpatient departments swiftly integrating electrocautery-enhanced stents for gallbladder drainage.
APAC Non-vascular Stents Market
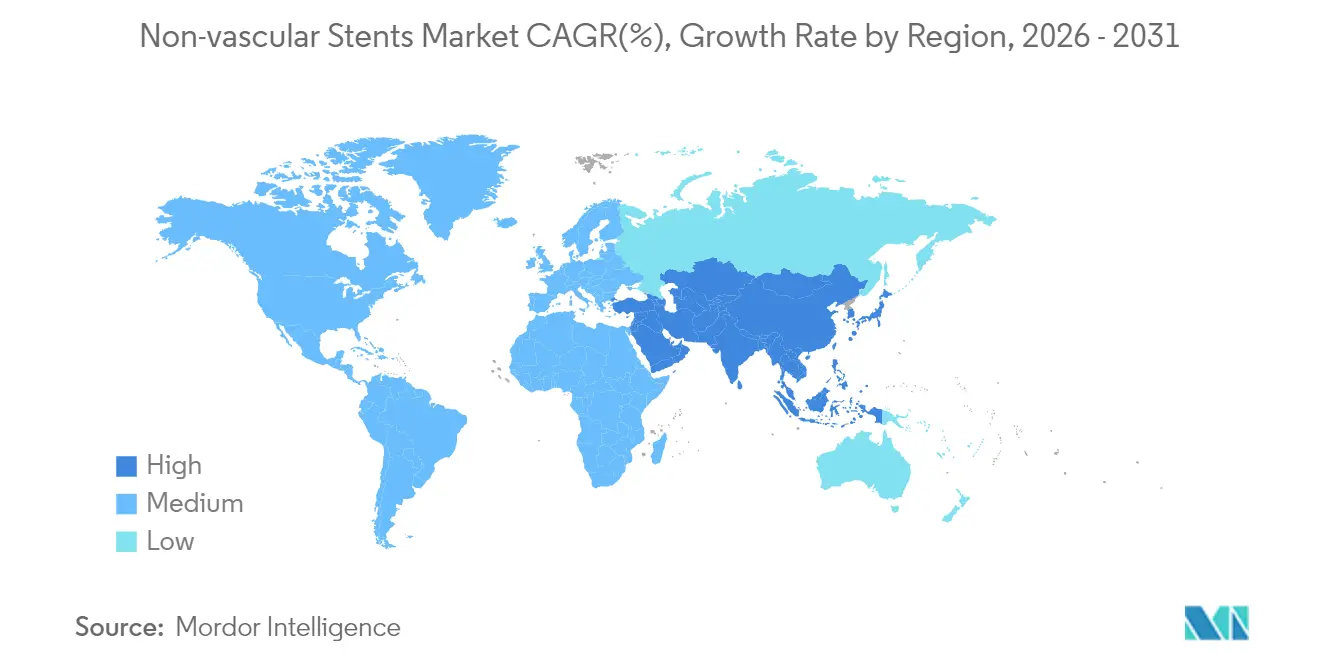
Asia-Pacific is advancing at a 7.52% CAGR, the fastest worldwide, as demographic aging intersects with expanded state insurance programs. Japan remains the region’s technology bellwether, importing high-precision U.S. stent systems for complex biliary and airway cases despite conservative physician adoption cycles. Regional policymakers are also courting technology transfer deals that pair Western intellectual property with local mass-production capacity, helping offset foreign-exchange exposure and supply chain volatility. Venture funding compressed in 2024 yet proprietary 3-D printed airway devices still secured regulatory approvals, signaling continued investor appetite for differentiated indications.
EMEA and South America Non-vascular Stents Market
Europe represents a stabilizing influence with demand anchored in universal coverage schemes and early adoption of sustainability directives. Packaging regulations effective from 2026 oblige device makers to account for end-of-life recycling even in sterile environments, nudging R&D toward light-weight trays and QR-code-enabled traceability. Middle East & Africa and South America collectively hold a smaller footprint yet exhibit rising tender activity for modular endoscopy suites that support rapid deployment of stent programs in tertiary hospitals.

Regulatory Landscape
Non-vascular stents are regulated as implantable medical devices, with added complexity when drug elution or biologic coverings create combination-product characteristics. In the United States, the FDA assigns combination-product oversight based on the principal mode of action (PMOA), with review led by CDRH or CDER as applicable. Review timelines and evidence expectations are also shaped by recognized consensus standards and labeling/testing guidance, and the report context notes that FDA Breakthrough Device pathways continue to be used by stent developers as an access accelerator, citing 1,041 Breakthrough Device designations granted to date.
In Europe, the EU MDR 2017/745 framework and associated guidance (including MDR Article 117 and Notified Body Opinion requirements when a device component is integral to a medicinal product) affect timelines and documentation, particularly for coated or drug-device designs. Sustainability and packaging-related obligations taking effect from 2026, as referenced in the report context for EU packaging rules, are pushing manufacturers to incorporate end-of-life and traceability considerations into sterile-pack design and technical documentation alongside core implant safety requirements.
Value Chain Analysis
The value chain runs from specialty raw materials (notably nitinol and other high-performance alloys, plus polymers used in covered, biodegradable, or drug-eluting designs) to precision component processing and device manufacturing, then sterilization and packaging. Distribution follows through direct sales and hospital or clinic procurement channels. Upstream steps include alloy melt and secondary processing, tubing or wire production, laser cutting or braiding, electropolishing, and integration of membranes, coatings, or drug layers for combination-type products, followed by clean-room assembly with delivery systems.
Lead-time and qualification constraints tend to concentrate around constrained nitinol capacity and secondary processing, and around specialized clean-room coating capability for drug-device combination stents. Suppliers and CMOs with validated processes and quality systems (including ISO 13485-aligned operations) function as strategic partners, while manufacturers increasingly qualify alternate sources and add in-house capabilities to reduce exposure to alloy volatility and support consistent performance in high-precision non-vascular indications.
Competitive Landscape
Industry structure remains moderately fragmented as no single vendor controls more than one-third of the non-vascular stents market. Boston Scientific’s USD 1.26 billion purchase of Silk Road Medical broadened its carotid portfolio and demonstrates how incumbent firms absorb niche innovators to extend clinical reach. Teleflex’s planned €760 million acquisition of BIOTRONIK’s Vascular Intervention unit brings in-house drug-coated balloons and peripheral self-expanding products, illustrating a trend toward portfolio convergence across vascular and non-vascular specialties. Medtronic partnered with Contego Medical for Neuroguard to deepen neuro-protection capabilities and mitigate stroke risk during carotid deployment. Supply resilience now ranks alongside innovation as a strategic imperative, with multinationals centralizing alloy procurement and qualifying secondary sources in India and Vietnam to buffer geopolitical disruptions.
Start-ups are carving white-space in patient-specific and biodegradable niches. VisionAir has already designed more than 600 custom airway units through cloud-based AI modeling, while Kallisio’s FDA-cleared oral stent underscores opportunity in radiation oncology adjuncts. Investors continue to reward device makers that marry material innovation with digital planning tools capable of shortening operating room times and raising first-pass success, thereby lowering overall episode cost.
Non-vascular Stents Industry Leaders
Medtronic
Becton, Dickinson and Company
Boston Scientific Corporation
CONMED Corporation
Cook Medical
- *Disclaimer: Major Players sorted in no particular order
Non-vascular Stents Market Companies Covered in this Report
- Beckton Dickinson
- Boston Scientific
- Conmed
- Cook Group
- ELLA-CS s.r.o.
- Glaukos
- Hobbs Medical
- Medtronic
- Micro-tech
- W. L. Gore & Associates
- Taewoong Medical
- Olympus
- Abbott Laboratories
- Medi-Globe (EndoFlex GmbH)
- Stryker
- Merit Medical Systems
- Coloplast
- Changzhou Intl. Trade & Enterprises Cooperative Co., Ltd(CITEC)

Market Opportunities and Future Outlook
Opportunities cluster in non-vascular indications where migration, occlusion, and infection remain persistent barriers, and where repeat interventions increase total episode cost. Bioresorbable and coated platforms target removal burden and tissue regrowth, aligning with the report context that coated variants are advancing faster than the overall market and that biliary migration can reach 8.4% in treated patients. This supports demand for improved anchoring, surface engineering, and deployment accuracy.
The pipeline also points to opportunities at the intersection of drug delivery and minimally invasive therapy, especially in airway and drainage applications where durable patency competes with alternative approaches. The cited evidence pack includes recent FDA Breakthrough Device activity, such as Solaris Endovasculars Breakthrough Device Designation (May 2026) for a drug-eluting covered stent in hemodialysis outflow stenosis, and Airiver Medicals initiation of a U.S. pivotal trial (March 2026) for a paclitaxel-coated balloon in central airway stenosis. Together, these developments support continued innovation transfer from vascular drug-delivery into adjacent luminal disease markets. Additive-manufactured, patient-specific designs referenced in the report context, including production of more than 600 airway implants via AI-driven workflows, also support commercialization for customized airway and niche GI or urology geometries where standard catalogs underperform.
Recent Industry Developments in Non-vascular Stents Market
- May 2026: Artivion completed its acquisition of Endospan Ltd. for an upfront net purchase price of USD 135 million, bringing the NEXUS Aortic Arch System into Artivions portfolio. The deal shifts a complex stent-graft platform under a larger strategic and commercial umbrella, supporting broader funding and operational scale for advanced endovascular implant programs.
- February 2025: Teleflex agreed to acquire BIOTRONIKs Vascular Intervention business for approximately EUR 760 million to deepen its interventional portfolio. The transaction highlights continued portfolio convergence across interventional platforms and reinforces competitive pressure on adjacent implant categories through broader bundled offerings and channel reach.
- July 2024: VisionAir Solutions surpassed 600 patient-specific airway stents produced through its AI VisionAir 3-D platform. This milestone underscores growing operational readiness for customized, patient-matched non-vascular stents, shortening design-to-implant cycles for complex airway anatomies where standard sizes are less effective.


Non-vascular Stents Market Report Scope and Research Methodology
Market Definition and Coverage
This market covers the revenue generated from non-vascular stents that are placed in non-blood vessel body passages to restore or maintain flow, typically in gastroenterology, urology, and respiratory care, across all major regions.
Scope exclusions: Vascular stents, dilation balloons, trauma repair plugs, and reusable drainage catheters are not counted in this market sizing.
Segments Covered in This Report
- By Product Type
- Gastrointestinal Stents
- Pulmonary (Airway) Stents
- Urological Stents
- Others
- By Material Type
- Metallic
- Non-metallic
- Biodegradable / Drug-eluting Coated
- By Design
- Self-expandable
- Balloon-expandable
- By End-User
- Hospitals
- Ambulatory Surgical Centers
- Specialty Clinics
- By Geography
- North America
- United States
- Canada
- Mexico
- Europe
- Germany
- United Kingdom
- France
- Italy
- Spain
- Rest of Europe
- Asia-Pacific
- China
- Japan
- India
- Australia
- South Korea
- Rest of Asia-Pacific
- Middle East and Africa
- GCC
- South Africa
- Rest of Middle East and Africa
- South America
- Brazil
- Argentina
- Rest of South America
- North America
Data Sources, Market Sizing, and Validation
Desk Research
Desk research was used to set the factual base for the model and to anchor realistic demand and pricing movements. We relied on public sources such as the US FDA device databases and safety communications, Centers for Medicare and Medicaid Services (CMS) reimbursement files, and US International Trade Commission (USITC) trade statistics to understand category signals and cross-border movement.
To keep medical context consistent, we checked clinical demand signals using sources such as the National Library of Medicine (PubMed) for procedure and guideline trends, and the World Health Organization (WHO) for broader disease burden indicators. Company annual reports, investor presentations, and reputable press coverage were used to clarify product mix shifts and geographic emphasis. We also used a paid subscription for company financials and a patent database selectively to fill gaps around pipelines and commercialization timing. This list is illustrative only, and many other public sources were also reviewed for data collection, cross-checks, and clarification.
Primary Interviews and Surveys
Primary work was done through expert interviews and structured surveys with manufacturers, distributors, hospital procurement teams, and clinicians who routinely use non-vascular stents. Because this is a global market, respondent input was checked across the Americas, EMEA, and APAC to avoid assuming utilization patterns, tender behavior, or average selling price movements from a single geography.
Distribution of primary research fieldwork respondents
| Company type | Respondent position | Region |
|---|---|---|
| Top tier: 37% | CXOs: 18% | APAC: 42% |
| Mid tier: 45% | Functional/Unit leaders: 35% | EMEA: 35% |
| Smaller Players: 18% | Managers: 47% | Americas: 23% |
Market-Sizing & Forecasting
Market size was first reconstructed using a top-down approach, where procedure volumes and treated patient pools were converted into stent demand using realistic adoption and replacement assumptions, and then translated into value using average selling prices by major clinical use. The totals were then corroborated with selective bottom-up approximations, such as sampled ASP multiplied by estimated unit volumes from channel checks and supplier discussions, which helped us adjust outliers without forcing a fully bottom-up build.
Key model inputs included minimally invasive procedure volumes for biliary and esophageal obstruction management, ureteral obstruction and stone management activity, airway stenting use in malignant and benign strictures, the share of self-expanding versus other deployment types, and price movement patterns tied to material choices and hospital purchasing cycles. Where unit data was thin in smaller countries, gaps were handled through regional ratioing using comparable healthcare capacity indicators, and then re-checked with local interview feedback.
For forecasting, scenario analysis was used because uptake and pricing can change with reimbursement, guideline shifts, and new product launches. Base case growth assumptions were aligned to expert expectations on procedure growth, mix shift toward covered metal stents in key indications, and measured ASP erosion in mature hospital accounts.
Data Validation & Update Cycle
Outputs were validated through multiple checks so that a single data stream did not drive the final number. We compared the modeled value trend against independent signals, including procedure growth direction, reimbursement updates, trade movement patterns, and the expected pace of mix change across GI, urology, and pulmonary use.
When large variances appeared, assumptions were re-tested and, if needed, experts were re-contacted to confirm what changed in purchasing or clinical practice. Before sign-off, the work is reviewed in steps by other analysts for logic, arithmetic, and consistency across years. Reports are refreshed annually, and interim updates are made when material events occur, followed by a final pre-delivery review so clients receive the latest view.
Mordor Intelligence's Non Vascular Stents Market Size Measured Against Other Published Estimates
Published market values for non-vascular stents can look far apart even when they refer to the same general device category. The gaps usually come from what is included in the product scope, how procedure-based demand is converted into units and price, and the exact year and currency timing used for normalization.
The main gap comes from counting adjacent drainage and dilation devices as stents, where Mordor Intelligence only counts newly manufactured non-vascular stents sold as implantable luminal support devices and leaves out reusable drainage catheters, dilation balloons, trauma repair plugs, and all vascular stents.
Benchmark comparison
| Source | Market Size | Gaps in Research Methodology |
|---|---|---|
| Mordor Intelligence | USD 1.81 B (2025) | |
| Global Consultancy A | USD 1.71 B (2024) | Uses a different base year and forecast window, and may apply broader end use and pricing averages that smooth out category level ASP and mix changes across GI, urology, and airway stents. |
| Industry Publisher B | USD 1.50 B (2026) | Starts from a later year and can shift the total by using a longer horizon growth view and different adoption timing for newer stent types, which changes unit conversion and price progression. |
In practice, most of the spread is explained by scope filters, base year selection, and how unit demand is tied back to real procedure activity and achievable pricing. By keeping the steps traceable to procedure signals and interview checks, the final estimate stays balanced and easier to reproduce year after year for planning.


Key Questions Answered in the Report
What is the current size of the non-vascular stents market?
The market generated USD 1.89 billion in 2026 and is forecast to reach USD 2.31 billion by 2031.
Which product segment leads today?
Gastrointestinal devices hold 41.98% of 2025 revenue, reflecting their long-standing use in esophageal, biliary and colorectal procedures.
What material trends are shaping future growth?
Metallic nitinol remains dominant, but bioresorbable iron, magnesium and polymer hybrids are growing at 8.63% as clinicians seek temporary scaffolds.
How fast is Asia-Pacific expanding?
The region is projected to grow at 7.52% CAGR through 2031, making it the fastest-growing geography.
Why are ambulatory surgical centers gaining share?
Stent procedures increasingly allow same-day discharge, aligning with payer efforts to lower costs and patient preference for outpatient care.
What complications still restrain adoption?
Migration, occlusion and infection remain key risks, with biliary migration reported in 8.4% of cases and necessitating additional interventions.
Page last updated on:


 Your data is secure and never sold or shared.


