
Facial Fat Transfer Market Size and Share
Market Overview
| Study Period | 2020 - 2031 |
|---|---|
| Market Size (2026) | USD 3.04 Billion |
| Market Size (2031) | USD 4.84 Billion |
| Growth Rate (2026 - 2031) | 9.73 % |
| Fastest Growing Market | Asia Pacific |
| Largest Market | North America |
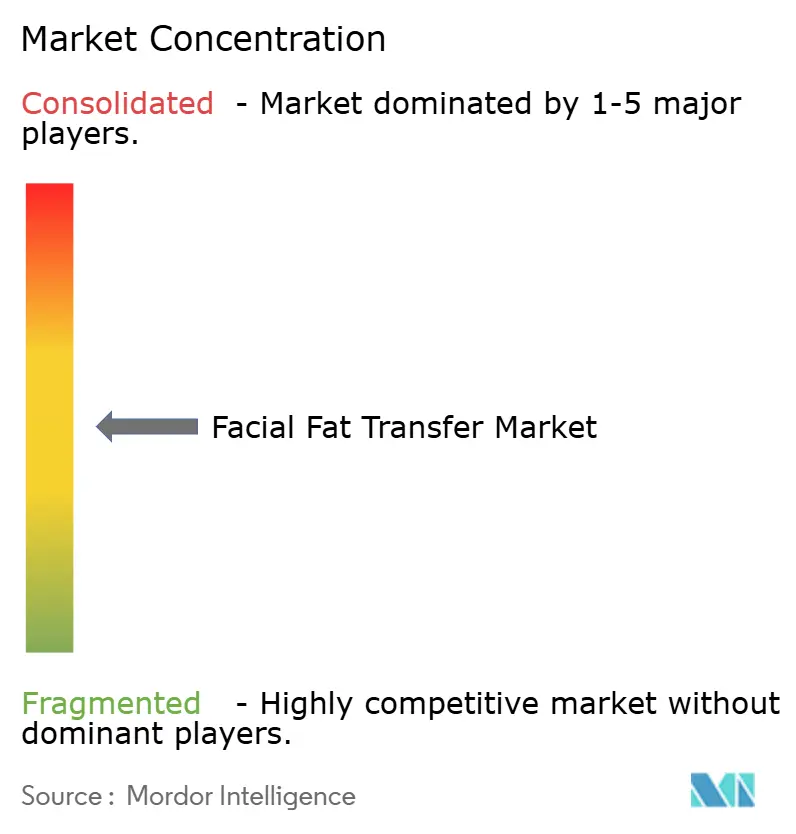
| Market Concentration | Medium |
Major Players *Disclaimer: Major Players sorted in no particular order Image © Mordor Intelligence. Reuse requires attribution under CC BY 4.0. | |

Facial Fat Transfer Market Analysis by Mordor Intelligence
The Facial Fat Transfer Market size was valued at USD 2.77 billion in 2025 and estimated to grow from USD 3.04 billion in 2026 to reach USD 4.84 billion by 2031, at a CAGR of 9.73% during the forecast period (2026-2031).
Volumization needs of an aging global population, a cultural pivot toward natural aesthetics, and reproducible outcomes from cell-assisted lipotransfer (CAL) keep demand rising within the facial fat transfer market. Hospitals anchor procedure volumes today, yet medical spas capture fast-growing outpatient demand as younger patients seek minimally invasive services that mirror routine skincare visits. North America retains leadership thanks to early technology adoption and extensive clinical training networks, but Asia-Pacific is accelerating as disposable incomes rise and surgeons refine techniques that respect Asian facial anatomy. Regulatory vigilance around adipose-derived stem cells, coupled with disruptive closed-system processors such as REVOLVE, is reshaping competitive strategies across the facial fat transfer market.
Key Report Takeaways
- By donor site, the abdomen led with 42.56% revenue share in 2025, while the thigh segment is forecast to advance at a 12.13% CAGR through 2031.
- By application, facial rejuvenation held 35.62% of the facial fat transfer market share in 2025; post-oncologic reconstruction is projected to expand at 15.02% CAGR to 2031.
- By end user, hospitals commanded 52.05% share of the facial fat transfer market size in 2025, whereas medical spas are growing at 15.41% CAGR to 2031.
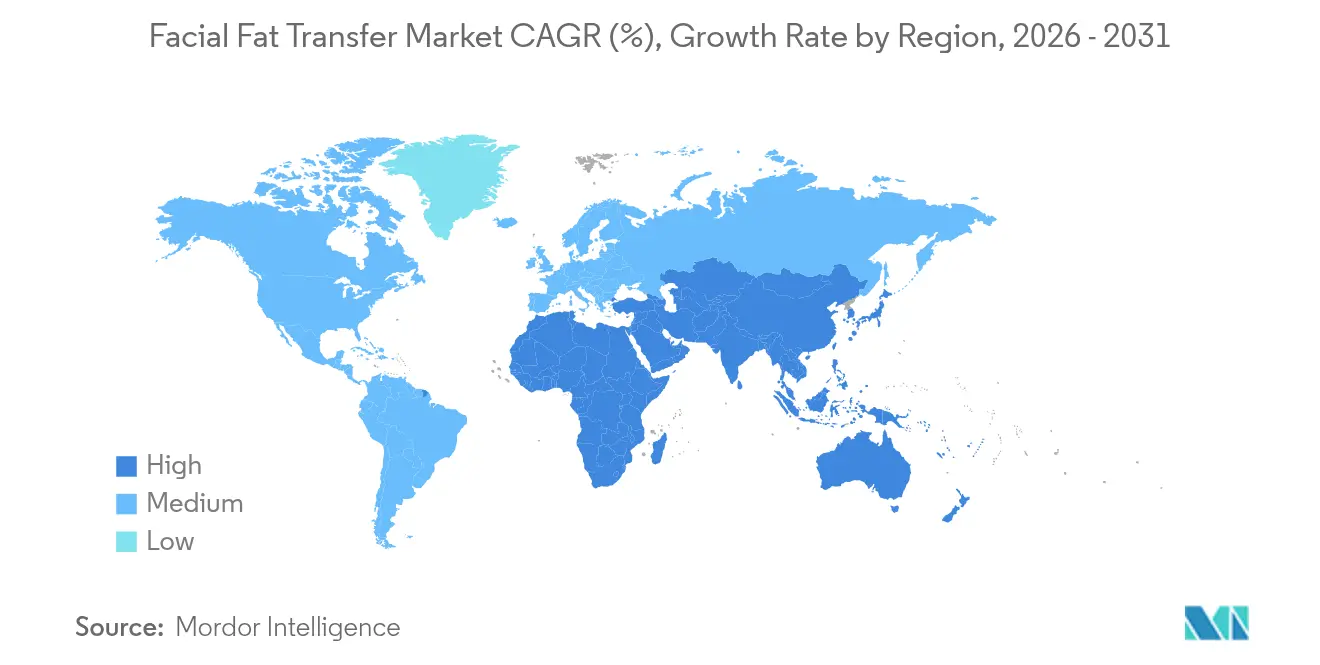
- By geography, North America accounted for 39.25% share of the facial fat transfer market size in 2025; Asia-Pacific is advancing at a 13.95% CAGR through 2031.
Note: Market size and forecast figures in this report are generated using Mordor Intelligence’s proprietary estimation framework, updated with the latest available data and insights as of 2026.
Market Trends and Insights
Drivers Impact Analysis of Facial Fat Transfer Market*
| Driver | (~) % Impact on CAGR Forecast | Geographic Relevance | Impact Timeline |
|---|---|---|---|
| Increasing Number of Cosmetic Procedures | +2.1% | Global, with concentration in North America & Asia-Pacific | Medium term (2-4 years) |
| Growing Ageing Population | +1.8% | Global, particularly North America & Europe | Long term (≥ 4 years) |
| Rising Preference for Autologous Fillers Over Synthetic Alternatives | +1.5% | Global, with early adoption in developed markets | Medium term (2-4 years) |
| Advances in Cell-Assisted Lipotransfer Boosting Graft Retention | +1.4% | North America & EU, expanding to Asia-Pacific | Short term (≤ 2 years) |
| Demand for Implant Removal & "Natural" Aesthetics Post-BIA-ALCL Scare | +1.2% | North America & Europe | Short term (≤ 2 years) |
| Surge in Male Facial Sculpting Influenced by AI-Driven Virtual Consult Apps | +0.9% | Global, with concentration in urban markets | Medium term (2-4 years) |
| Source: Mordor Intelligence | |||
Increasing Number of Cosmetic Procedures
Elective aesthetic volumes climbed as injectable treatments grew 7% annually between 2022 and 2024, setting a strong baseline for the facial fat transfer market.[1]American Med Spa Association, “2025 Medical Spa State of the Industry Report,” amspa.org Medical spas captured 40-55% of all U.S. and U.K. aesthetic visits after their site count rose from 8,841 to 10,488 in two years, widening patient access and lowering procedural thresholds. Younger adults now request early-stage contouring to delay future aging signs, which funnels demand toward long-lasting autologous volumizers. Surgeons, therefore, position fat grafting as a cost-effective, lifetime solution when compared with repeat filler injections. The trend supports steady capacity expansion across outpatient suites where facial fat transfer market procedures slot easily into half-day schedules.
Growing Ageing Population
Facial volume loss accelerates past age 40, and the ≥50 demographic is expanding rapidly in North America and Europe. Older patients prefer permanent, biocompatible correction, allowing autologous fat grafting to outperform temporary fillers in perceived value. Clinical data show simultaneous gains in volume, skin texture, and trophic factors, addressing multiple senescence markers in one session. Hospitals integrate fat grafting into combined facelifts, while spas entice older clients by bundling maintenance regimens such as laser resurfacing. The sizable mature cohort, therefore, underpins a predictable revenue stream throughout the facial fat transfer market.
Rising Preference for Autologous Fillers Over Synthetic Alternatives
Safety headlines surrounding breast implants–associated anaplastic large-cell lymphoma (BIA-ALCL) and filler-related adverse events drive patients toward natural tissue fillers.[2]Journal of Cosmetic Dermatology, “Long-Term Outcomes of Autologous Versus Synthetic Facial Fillers,” onlinelibrary.wiley.com Fat grafting eliminates immunogenic risk, and once-and-done economics appeal to pragmatic consumers: a USD 2,500 procedure can replace serial HA injections that total more than USD 10,000 over a decade. As influencer culture champions “untouched” beauty, clinics market cell-based contouring that harmonizes with individual anatomy. These perceptions further ignite momentum across the facial fat transfer market.
Advances in Cell-Assisted Lipotransfer Boosting Graft Retention
Meta-analyses record 60% graft survival with CAL, versus 45% via conventional methods, translating to fewer touch-ups and better predictability. Closed-loop processors, platelet-rich fibrin additives, and gentle centrifugation all reduce trauma to adipocytes. Randomized trials demonstrate a 19% retention uplift in facial zones, while patient satisfaction climbs above 55% when enriched grafts are used.[3]Frontiers in Surgery, “Platelet-Rich Fibrin Combined With Fat Grafts,” frontiersin.org Surgeons publicize these results to justify premium pricing, and device makers race to supply compliant systems. Early adopters gain differentiation, cementing CAL as a standard in the facial fat transfer market.
Restraints Impact Analysis of Facial Fat Transfer Market*
| Restraint | (~) % Impact on CAGR Forecast | Geographic Relevance | Impact Timeline |
|---|---|---|---|
| Presence of Alternative Dermal Fillers with Shorter Downtime | -1.3% | Global, particularly in convenience-focused markets | Short term (≤ 2 years) |
| Unpredictable Fat-Graft Resorption Rates | -0.9% | Global, with higher impact in developing markets | Medium term (2-4 years) |
| Regulatory Scrutiny on Stem-Cell-Enhanced Grafts | -0.7% | North America & EU, expanding globally | Long term (≥ 4 years) |
| Rising Incidence of Vision-Threatening Embolic Complications Publicised Online | -0.6% | Global, with heightened awareness in developed markets | Short term (≤ 2 years) |
| Source: Mordor Intelligence | |||
Presence of Alternative Dermal Fillers with Shorter Downtime
Hyaluronic acid fillers deliver lunch-hour improvements and entail no bruising downtime, stealing impulsive consumers from the facial fat transfer market. Contemporary HA gels last up to 24 months, inching closer to permanence, and manufacturers leverage loyalty programs to lock in repeat purchases. However, cost modeling still favors autologous tissue for patients planning a decade of maintenance. Clinics now segment consultations by lifestyle, steering time-starved individuals to fillers while educating long-horizon clients on fat graft durability. This nuanced positioning limits, but does not eliminate, the restraint on market growth.
Unpredictable Fat-Graft Resorption Rates
Fat retention can range from 20-80%, forcing surgeons to overfill or plan staged sessions. Donor age, BMI, and harvest site cause survival variability, dampening universal consensus on best practices. Younger thighs show higher stem-cell density, while older abdomen fat may underperform, complicating uniform treatment algorithms. Emerging protocol standardization and advanced cannulas mitigate the risk, yet a residual learning curve persists, slowing adoption in newer clinics within the facial fat transfer market.
*Our forecasts treat driver/restraint impacts as directional, not additive. The impact forecasts reflect baseline growth, mix effects, and variable interactions.
Facial Fat Transfer Market Segment Analysis
By Donor Site:
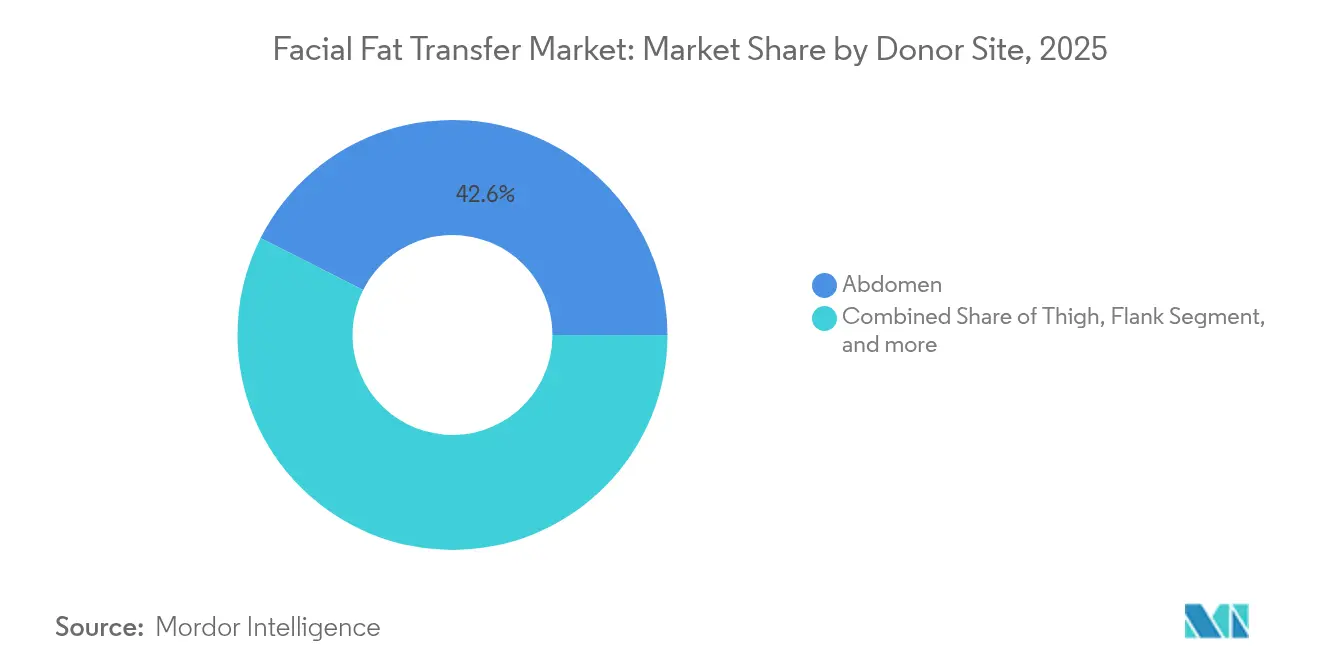
Thigh Emerges as Superior ChoiceIn 2025, the abdomen accounted for 42.56% of the facial fat transfer market, reflecting surgeons’ familiarity and procedural convenience. The thigh segment, although smaller, is forecast to grow at 12.13% CAGR through 2031, underscoring evidence that medial thigh adipocytes deliver higher viability and stem-cell counts. Randomized trials recorded a mean final fat layer of 6.03 mm from thigh harvests compared with 4.99 mm from abdominal tissue; 76.9% of thigh grafts achieved “excellent” quality scores. Younger patients show particularly robust cell profiles in thigh fat, prompting a procedural shift that widens surgeon skill sets and equipment needs.
Evidence-driven adoption will gradually rebalance donor patterns, yet abdominal harvesting retains relevance for high-volume cases that exceed thigh reserves. Flank and buttock sites complete full-face rejuvenations, while arm extractions satisfy touch-ups. Technique refinements, low-pressure aspiration, micro-cannulas, and closed filtration—optimize cellular survival regardless of site, supporting consistent outcomes across the facial fat transfer market.



By Application:
Post-Oncologic Reconstruction AcceleratesFacial rejuvenation held 35.62% of the facial fat transfer market size in 2025, maintaining core status among elective procedures. Yet post-oncologic reconstruction is expanding at a 15.02% CAGR, propelled by broad acceptance of fat grafting for symmetry restoration after head-and-neck cancer resections. A 119-patient cohort logged only 6% minor complications and saw no recurrence within grafted areas, reinforcing oncologic safety. Fat’s regenerative capacity also softens irradiated tissue and improves scar pliability, creating multifunctional value beyond volume replacement.
Lipoatrophy correction and scar revision sustain moderate momentum, while dermatologic defect repair represents an emerging frontier as surgeons pair fat with regenerative matrices. Integrative protocols combine dermal fat grafts for nasolabial folds and parotidectomy depressions, expanding procedural indications. This diverse application mix secures a resilient revenue base for the facial fat transfer market.
By End User:
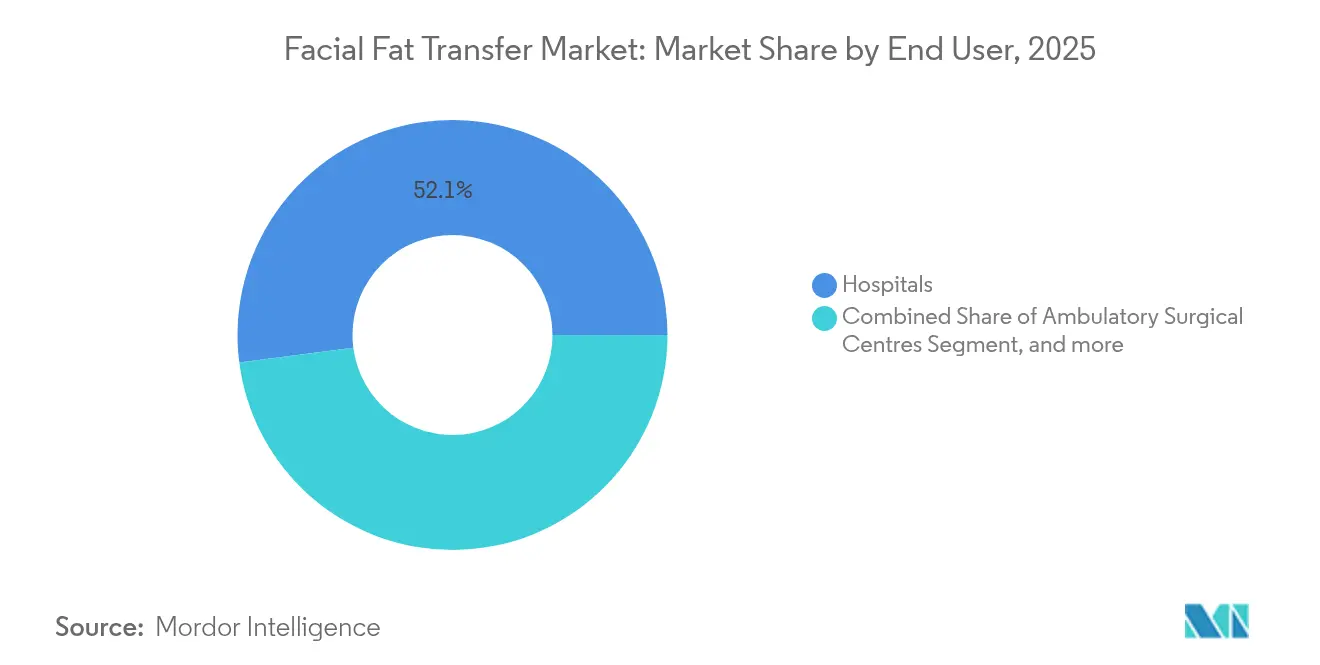
Medical Spas Drive Market ExpansionHospitals dominated with 52.05% revenue in 2025, but medical spas are projected to grow 15.41% CAGR to 2031, reflecting changing consumer service preferences. Spa counts rose 18.5% between 2022 and 2024, and average annual revenue climbed to USD 1.40 million as menus added advanced injectables and minor grafting under local anesthesia. Repeat-visit rates hover at 73%, enabling spas to market sequential treatments and loyalty plans that enhance lifetime value.
Ambulatory surgery centers bridge hospital rigor and spa ambience, particularly for full-face CAL that benefits from brief monitored recovery. Regulatory scrutiny may tighten procedural scope in spa settings, yet accreditation pathways and physician oversight are evolving. Collectively, these outpatient channels expand patient touchpoints, enlarging the facial fat transfer industry footprint while hospitals retain complex oncologic and combination surgeries.
Geography Analysis
North America Facial Fat Transfer Market
North America controlled 39.25% of the facial fat transfer market share in 2025 on the strength of early innovation adoption, deep specialist networks, and insurance support for reconstructive indications. The United States hosts over 10,000 medical spas and numerous fellowship programs that refine grafting protocols, while Canada and Mexico leverage cross-border tourism for competitive pricing. FDA guidance on adipose-derived stem cells imposes strict compliance, yet once systems secure clearance, trust accelerates patient uptake across the region.
APAC Facial Fat Transfer Market
Asia-Pacific posts the fastest trajectory with a 13.95% CAGR to 2031 as China, Japan, South Korea, and India invest in aesthetic infrastructure. Urban professionals allocate more disposable income to appearance-oriented services, and regional experts develop pan-facial contouring methods tailored for Asian skeletal and soft-tissue patterns. Satisfaction rates reach 96% in young Asian cohorts, validating culturally aligned techniques. Government-backed digital health tools and AI-driven consultation apps further normalize elective surgery, broadening the facial fat transfer market in the region.
EMEA and South America Facial Fat Transfer Market
Europe sustains steady growth under cohesive regulatory frameworks that stress evidence-based medicine. Surgeons integrate fat grafting into multidisciplinary cancer aftercare, and cross-border procedure access eases patient choice within the Schengen Area. Middle East & Africa and South America represent emerging clusters where rising affluence and medical tourism offset limited domestic specialist numbers. Investment in training and equipment is ongoing, positioning these regions for future share gains in the global facial fat transfer market.

Regulatory Landscape
Regulatory oversight for facial fat transfer spans medical devices used to harvest, process, and deliver adipose tissue, and may extend to human cells and tissue-based products (HCT/Ps) in some contexts. In the United States, FDA oversight commonly routes fat processing devices through Class II 510(k) pathways, with CBER involvement for devices that process autologous cells and tissues; sponsors must align intended use with minimal manipulation and homologous use under 21 CFR Part 1271 to avoid triggering drug or biologics frameworks. In Europe, Regulation (EU) 2017/745 (EU MDR) governs aesthetic devices used in facial filling workflows, with Annex XVI categories and MDCG guidance shaping borderline classification, clinical evaluation, QMS audits, and labeling requirements that favor closed processing steps and validated biocompatibility documentation.
Competitive Landscape
The market for facial fat transfer is moderately competitive, with the presence of global companies. Companies are taking initiatives to develop products related to facial fat transfer, which is expected to fuel the market's growth. AbbVie’s Allergan Aesthetics melds its injectable heritage with training programs that transition filler users to autologous grafting modules. Device developers refine closed-system harvesters and low-speed centrifuges that attain superior cell viability, creating defensible intellectual property.
Regulatory acumen has become a strategic weapon. A 2024 Ninth Circuit ruling confirmed stromal vascular fraction as a drug, pressuring stem-cell startups to seek biologics licenses. Companies with compliant pathways gain a first-mover advantage, while allograft adipose matrices are under review as potential off-the-shelf solutions that bypass patient harvesting. Consolidation is likely among medical spa chains whose outlet count already exceeds 10,000 in the U.S.; scale allows central purchasing of equipment, uniform protocols, and cohesive marketing, fortifying position within the facial fat transfer market.
Strategic partnerships surface between hardware makers and digital-health platforms that integrate 3-D imaging, AI volumetric planning, and outcome tracking. Such ecosystems raise switching costs for practices and embed suppliers deeply into clinical workflows. Collectively, these moves signal a gradual shift from artisanal techniques toward systematized, data-driven facial fat transfer industry practices.
Facial Fat Transfer Industry Leaders
Human Med AG
AbbVie (Allergan Aesthetics)
Medikan International
Plus Therapeutics, Inc. (Cytori Therapeutics Inc.)
Alma Lasers (Sisram)
- *Disclaimer: Major Players sorted in no particular order
Facial Fat Transfer Market Companies Covered in this Report
- AbbVie (Allergan Aesthetics)
- Alma Lasers (Sisram)
- Anthony Products Inc.
- Cytori Therapeutics Inc. (Plus Therapeutics, Inc.)
- DMS Biotech
- Human Med
- Medinordic
- Medikan International
- MicroAire
- Ranfac
- Lipogems International
- Tulip Medical Products
- BTL
- InMode Ltd.
- Cynosure
- Rion Aesthetics
- Tiss’You Biotech
- Revolve (AirX)
- Palomar Technologies
- Suneva Medical

Market Opportunities and Future Outlook
Standardization and throughput needs across hospitals, ambulatory surgical centers, and high-volume aesthetic clinics create whitespace for single-use, closed-loop adipose processing and filtration systems that reduce variability in graft preparation and limit reprocessing burdens. A concrete signal is the US FDA 510(k) Class II clearance in February 2026 for Bimini Health Techs Puregraft SYNC adipose filtration system, which reinforces that regulated, disposable processing consumables can move through established device pathways and add recurring revenue per procedure.
On the demand side, practitioners report more facial volume-loss cases associated with medical weight loss, which adds volume-restoration cases alongside core facial rejuvenation. The American Academy of Facial Plastic and Reconstructive Surgery (AAFPRS) reported a 50% increase in average fat grafting procedures per surgeon over 2024-2025, supporting opportunities in training, protocol-driven CAL workflows, and outcome tracking that reduce resorption variability while maintaining compliance amid scrutiny of stem-cell-enhanced approaches.
Recent Industry Developments in Facial Fat Transfer Market
- May 2026: Human Med AG launched the body-jet neo system to support water-jet assisted liposuction and fat grafting workflows. The launch expands the installed base of dedicated harvest and processing platforms used for lipofilling, supporting vendor pull-through for procedure kits and accessories.
- February 2026: Bimini Health Techs received US FDA 510(k) clearance for the Puregraft SYNC adipose filtration system. The 510(k) clearance expands the availability of sealed filtration modules for autologous fat graft workflows. It reinforces the role of disposable processing consumables in regulated device pathways and supports adoption across surgery centers.
- September 2024: The US Ninth Circuit ruled that stromal vascular fraction derived from fat tissue is classified as a drug under the Federal Food, Drug, and Cosmetic Act. The decision tightened the compliance backdrop for stem-cell-enhanced graft offerings and increased the relative advantage of device-led, minimally manipulated fat transfer workflows.


Facial Fat Transfer Market Report Scope and Research Methodology
Market Definition and Coverage
This market covers revenue generated from facial fat transfer procedures where a patient's own fat is harvested, processed, and injected into facial areas for aesthetic or reconstructive results, as delivered by clinical providers and surgical settings.
Scope exclusions: It excludes non-surgical facial injectables that do not use autologous fat, and it does not count unrelated consumables that are not directly tied to a completed fat transfer procedure.
Segments Covered in This Report
- By Donor Site
- Abdomen
- Thigh
- Flank
- Buttocks
- Arms
- Other Small-volume Sites
- By Application
- Facial Rejuvenation
- Volume Restoration in Facial Lipoatrophy
- Acne & Trauma Scar Revision
- Post-oncologic Reconstruction
- Dermatological Defects & Burns
- By End User
- Hospitals
- Ambulatory Surgical Centres & Specialty Clinics
- Medical Spas & Aesthetic Centres
- By Geography
- North America
- United States
- Canada
- Mexico
- Europe
- Germany
- United Kingdom
- France
- Italy
- Spain
- Rest of Europe
- Asia-Pacific
- China
- Japan
- India
- Australia
- South Korea
- Rest of Asia-Pacific
- Middle East & Africa
- GCC
- South Africa
- Rest of Middle East & Africa
- South America
- Brazil
- Argentina
- Rest of South America
- North America
Data Sources, Market Sizing, and Validation
Desk Research
Desk research starts by mapping the demand pool for facial aesthetic procedures and then narrowing it to fat transfer specific adoption. We rely on public procedure statistics and clinical guidance to understand where fat grafting is used, how it is coded and billed, and how treatment settings differ by country.
Typical inputs include sources such as the American Society of Plastic Surgeons, the International Society of Aesthetic Plastic Surgery, national health agencies for outpatient and surgical activity, customs and trade data for relevant medical devices where applicable, and peer reviewed clinical journals that describe technique shifts and utilization trends. We also review company filings, investor presentations, and credible press to track clinic expansion, pricing commentary, and technology changes that can affect procedure volumes. Where needed, paid subscriptions for company financials and patent databases are used to cross-check revenue ranges and innovation activity. These desk sources are illustrative only, and many other public references were used for data collection, validation, and clarification during the work.
Primary Interviews and Surveys
Primary work is used to pressure test procedure volumes, typical price bands, and how often fat transfer is chosen versus adjacent facial rejuvenation options. Interviews include surgeons, clinic operators, distributors, and industry specialists across APAC, EMEA, and the Americas, so regional practice patterns and patient mix assumptions can be corrected before totals are finalized.
Distribution of primary research fieldwork respondents
| Company type | Respondent position | Region |
|---|---|---|
| Top tier: 29% | CXOs: 14% | APAC: 38% |
| Mid tier: 56% | Functional/Unit leaders: 40% | EMEA: 36% |
| Smaller Players: 15% | Managers: 46% | Americas: 26% |
Market-Sizing & Forecasting
The core model uses a top down approach where procedure and provider activity data is converted into an addressable facial fat transfer demand pool, and then translated into revenue using country level price bands. To keep the math explainable, we build it stepwise by region, and then roll up to a global number once the local checks look reasonable.
To corroborate totals, we add selective bottom up approximations such as sampled clinic throughput, channel feedback on case volumes, and ASP times volume checks for commonly treated facial areas. Key inputs that shape the model include the number of facial aesthetic procedures performed, the share of cases that use autologous fat, average sessions per patient, typical per procedure pricing by setting (hospital versus clinic), and the pace of technique adoption that improves graft retention. When some countries have limited published procedure statistics, we fill gaps using proxy indicators like specialist density, medical tourism flow, and neighboring market adoption patterns, and then validate those assumptions in follow up calls.
For forecasting, scenario analysis is used around procedure growth and pricing progression, and the final trajectory is aligned with what experts expect for patient demand, clinic capacity, and regulatory or safety sentiment over the period.
Data Validation & Update Cycle
Validation is done by checking the model outputs against independent signals such as procedure counts, clinic expansion rates, and the direction of pricing discussed by practitioners. Any large variances are reviewed, and then we re contact sources when a number looks inconsistent with on the ground realities in a specific region.
Before sign off, multiple analyst reviews are completed so the inputs, formulas, and assumptions are consistent across countries and years. The report is refreshed annually, and interim updates are made when there are material events like major guideline changes, sharp price shifts, or sudden changes in elective procedure demand. Right before delivery, a final pass is done so clients receive the most up to date view available.
Mordor Intelligence's Facial Fat Transfer Market Sizing Compared With Other Published Estimates
Published numbers for this market can look far apart because the counted revenue pool is not always the same, even when the label sounds identical. Differences usually come from what gets included around adjacent facial injectables, how procedure pricing is averaged across settings, and whether the publisher updates volumes when elective demand changes.
The key gap drivers are typically scope boundaries and the way demand is rebuilt from procedure activity. Some estimates blend fat injection with the wider facial fillers space, or they apply a single global ASP that does not reflect the mix of hospitals versus clinics, and then the total shifts quickly. Currency timing and the year selected as the starting point also matter because elective aesthetics can swing by region, and older assumptions can stay in the model longer than users expect.
Benchmark comparison
| Source | Market Size | Gaps in Research Methodology |
|---|---|---|
| Mordor Intelligence | USD 2.77 B (2025) | |
| Global Consultancy A | USD 3.10 B (2024) | Uses an earlier base year and appears to generalize pricing and setting mix across regions, which can lift the total if hospital weighted ASPs are applied broadly. |
| Industry Publisher B | USD 2.70 B (2025) | Wider treatment framing is indicated in its structure, where dermal fillers and other non fat injectables can be grouped near the same demand pool, which can change what is counted as facial fat transfer revenue. |
The table shows a tight spread in the mid 2020s, and the remaining difference is mostly about what gets counted as the procedure revenue pool, where in Mordor Intelligence's model only autologous facial fat transfer procedure value is included and adjacent non fat injectables are kept out. With that scope held steady, the totals stay traceable to procedure activity, setting level pricing, and region specific adoption checks that can be repeated year to year.


Key Questions Answered in the Report
What is the facial fat transfer market size in 2026?
The facial fat transfer market size stands at USD 3.04 billion in 2026 and is forecast to reach USD 4.84 billion by 2031.
Which donor site is growing fastest in facial fat transfer procedures?
Medial thigh harvesting is rising at a 12.13% CAGR to 2031 because its adipocytes exhibit higher stem-cell density and graft survival.
Why is Asia-Pacific the fastest-growing region?
Rising disposable income, tailored techniques for Asian anatomy, and strong satisfaction scores push Asia-Pacific ahead at a 13.95% CAGR.
What technological advance most improves fat graft retention?
Cell-assisted lipotransfer (CAL) raises survival to 60% versus 45% for conventional methods, reducing revision frequency.
How does the Ninth Circuit ruling affect stem-cell-enhanced grafts?
By classifying stromal vascular fraction as a drug, the ruling mandates FDA approval pathways, raising compliance costs and favoring firms with regulatory expertise.
Are medical spas overtaking hospitals in facial fat transfer volume?
Hospitals still hold 52.05% share, but medical spas’ 15.41% CAGR and expanding national chains suggest a growing outpatient shift.
Page last updated on:


 Your data is secure and never sold or shared.


