
Venous Stents Market Size and Share
Market Overview
| Study Period | 2020 - 2031 |
|---|---|
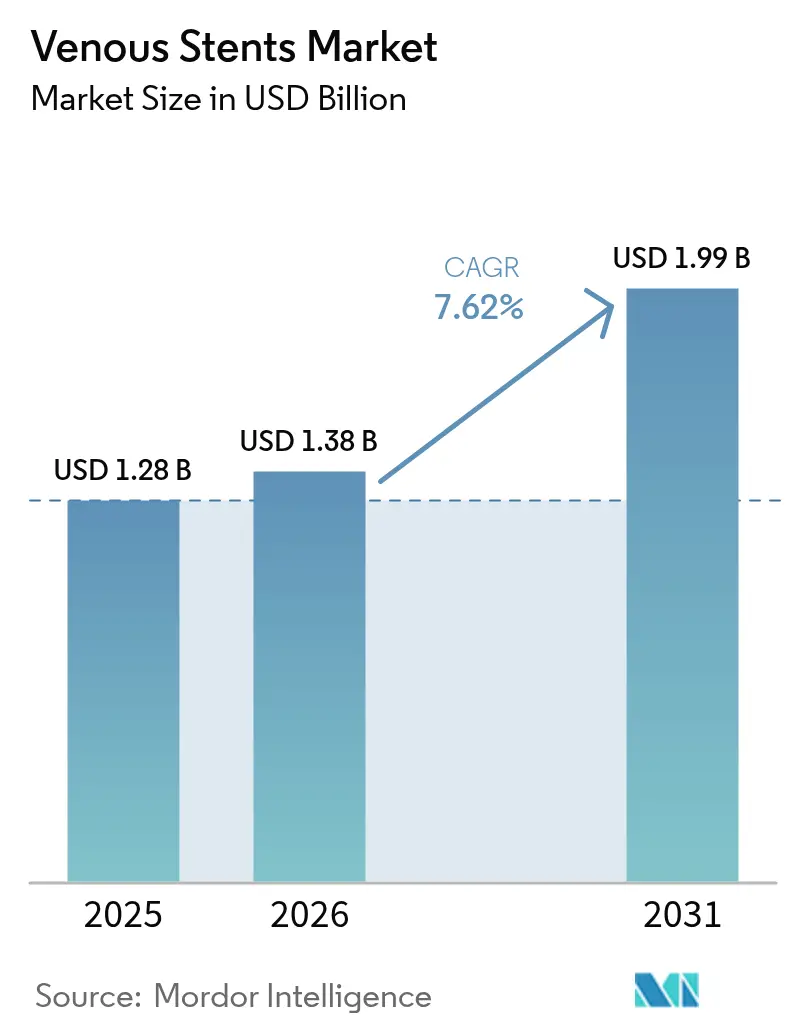
| Market Size (2026) | USD 1.38 Billion |
| Market Size (2031) | USD 1.99 Billion |
| Growth Rate (2026 - 2031) | 7.62 % |
| Fastest Growing Market | Asia-Pacific |
| Largest Market | North America |
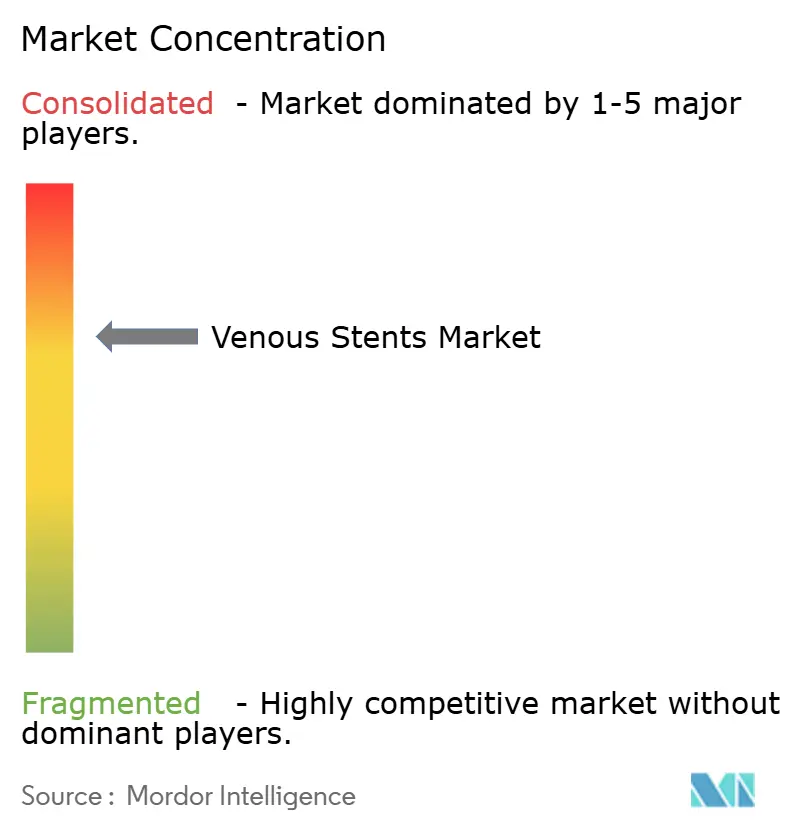
| Market Concentration | Medium |
Major Players *Disclaimer: Major Players sorted in no particular order Image © Mordor Intelligence. Reuse requires attribution under CC BY 4.0. | |
Venous Stents Market Analysis by Mordor Intelligence
The venous stents market size is expected to grow from USD 1.28 billion in 2025 to USD 1.38 billion in 2026 and is forecast to reach USD 1.99 billion by 2031 at 7.62% CAGR over 2026-2031. Robust demand comes from growing recognition that dedicated venous stents deliver better long-term patency than balloon angioplasty, especially in chronic deep vein obstruction. Market momentum is reinforced by higher disease prevalence in aging populations, steady regulatory approvals for nitinol-based devices, and payers embracing outpatient venous procedures. Clinical data showing 84.0% three-year primary patency with modern stents continues to drive physician confidence. On the supply side, manufacturers are mitigating raw-material risks through diversified nitinol sourcing while accelerating innovation in drug-eluting and polymer-coated platforms to maintain competitive differentiation.
Key Report Takeaways
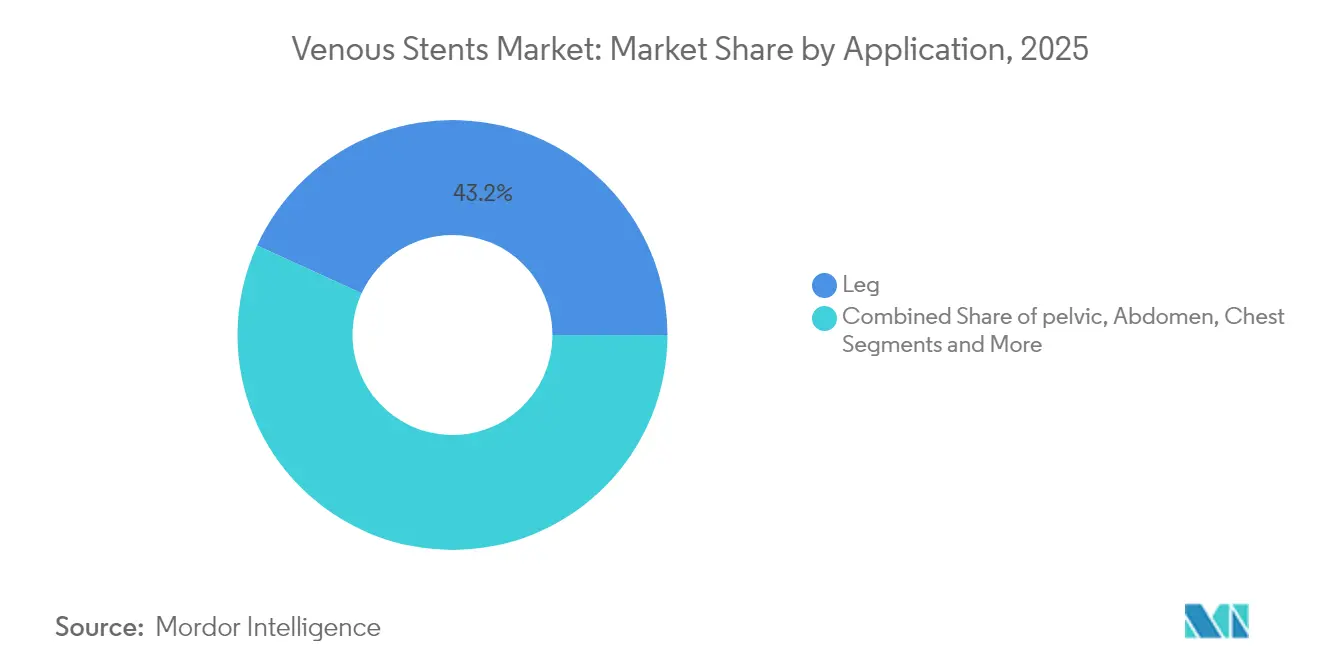
- By application, leg interventions led with 43.16% of venous stents market share in 2025, whereas pelvic procedures are forecast to grow at a 12.28% CAGR to 2031.
- By disease, chronic deep vein thrombosis accounted for 39.20% of the venous stents market size in 2025, while non-thrombotic iliac vein lesions will expand at an 11.17% CAGR through 2031.
- By stent type, self-expanding nitinol platforms held 58.95% of 2025 revenue; drug-eluting devices are expected to post the fastest 11.86% CAGR.
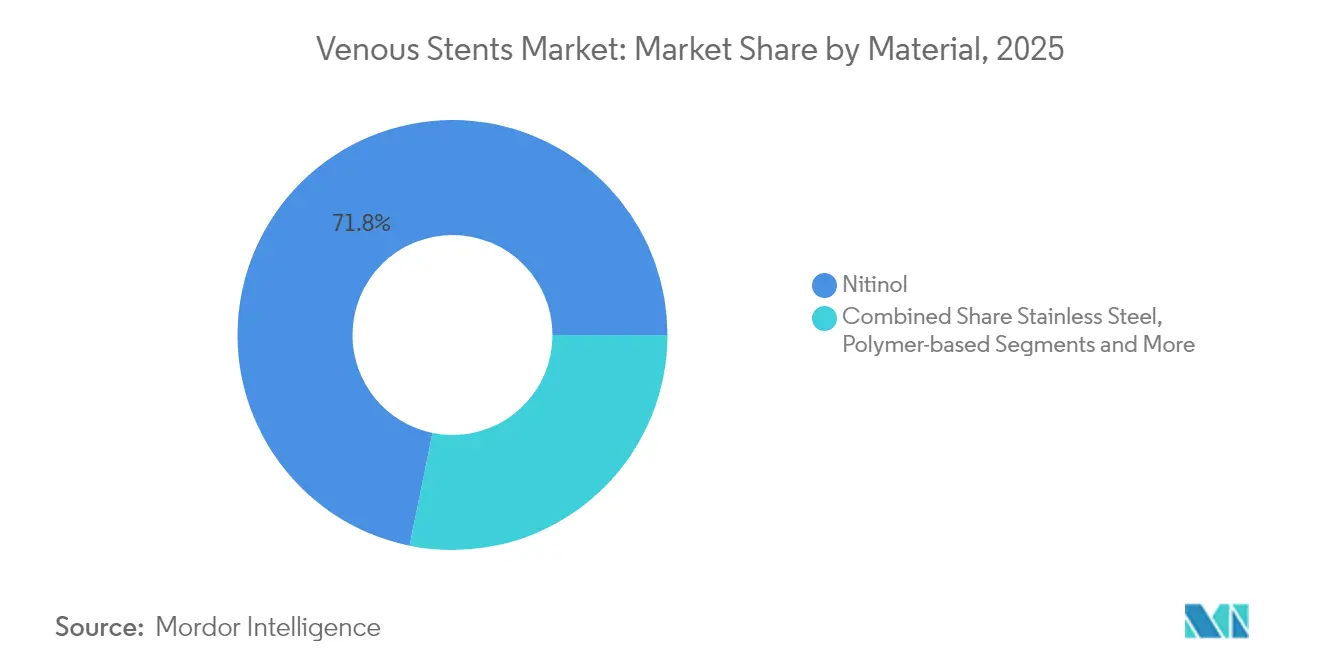
- By material, nitinol commanded 71.80% share of the venous stents market size in 2025; polymer-enhanced designs are set to rise at 11.62% CAGR.
- By end user, hospitals represented 61.55% revenue share in 2025, but ambulatory surgical centers (ASCs) show the highest 12.41% projected CAGR.
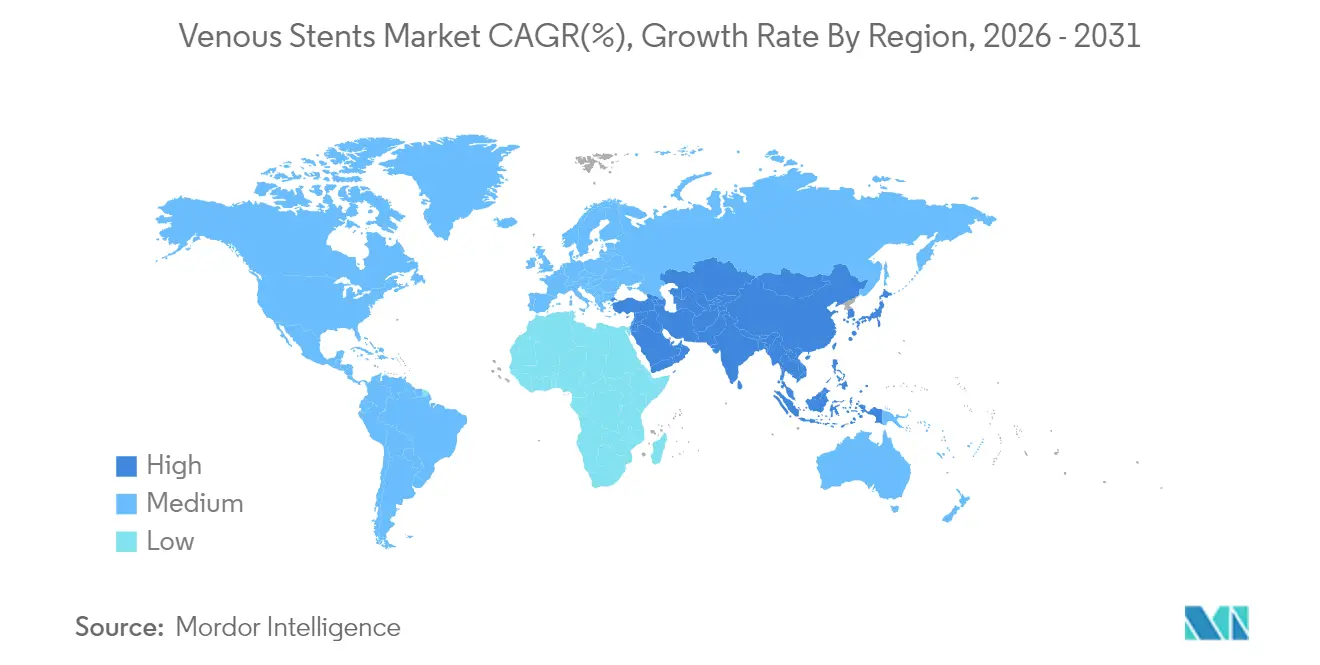
- By geography, North America led with 38.25% share in 2025, while Asia-Pacific is projected to grow at 11.24% CAGR to 2031.
Note: Market size and forecast figures in this report are generated using Mordor Intelligence’s proprietary estimation framework, updated with the latest available data and insights as of 2026.
Market Trends and Insights
Drivers Impact Analysis of Venous Stents Market*
| Driver | (~) % Impact on CAGR Forecast | Geographic Relevance | Impact Timeline |
|---|---|---|---|
| Rising prevalence of chronic venous disease | +1.2% | North America, Europe, APAC | Long term (≥ 4 years) |
| Ageing population boosting interventions | +0.9% | High-income economies | Long term (≥ 4 years) |
| Dedicated nitinol venous stents approvals | +1.4% | North America, Europe | Medium term (2-4 years) |
| Favourable outpatient reimbursement | +1.1% | United States, selected EU states | Medium term (2-4 years) |
| IVUS-guided sizing improving patency | +0.8% | Advanced healthcare systems | Short term (≤ 2 years) |
| Surge in ambulatory vascular centres | +1.0% | United States, expanding in APAC | Medium term (2-4 years) |
| Source: Mordor Intelligence | |||
Rising Prevalence of Chronic Symptomatic Venous Diseases
Post-thrombotic syndrome affects up to 50% of patients after deep vein thrombosis, and earlier detection is funneling more candidates toward intervention[1]Raghu Kolluri, “Consensus Statement on the Management of Nonthrombotic Iliac Vein Lesions,” Circulation: Cardiovascular Interventions, ahajournals.org . The VERNACULAR study reported 84.0% primary patency at 36 months for modern stents, underscoring their value in difficult cases. Growing awareness of May-Thurner syndrome among younger adults is widening the treated population. These epidemiologic shifts are most evident in markets with robust vascular specialization and aging demographics. As a result, the venous stents market is poised to benefit from sustained procedure growth over the forecast horizon.
Ageing Population Boosting Venous Interventions
Populations aged 65+ experience higher chronic venous insufficiency, prompting guideline updates that advocate earlier stenting when conservative therapy fails.[2]Joakim Nordanstig, “ESVS 2024 Clinical Practice Guidelines,” esvs.org Geriatric patients often present with multimorbidity, so devices designed for shorter procedure times and lower anticoagulation needs are gaining favor. Japan and Western Europe exemplify how super-aged societies accelerate adoption of minimally invasive venous treatments. These macro-demographics give the venous stents market a durable, long-term growth underpinning.
Dedicated Nitinol Venous Stents Gaining Regulatory Approvals
FDA clearance of purpose-built platforms such as the Abre stent, which achieved 81.6% three-year patency with no fracture events, validates superior design tailored to venous anatomy. Europe is now harmonizing approval criteria around quality-of-life endpoints, further smoothing pathways for new entrants. Clearer regulatory definitions distinguish venous from arterial devices, prompting companies to fund specialized R&D and physician training programs. These developments expand the venous stents market as a distinct therapeutic category.
Favourable Reimbursement for Outpatient Venous Procedures
Medicare and several private insurers now reimburse same-day venous stenting performed in ASCs, lowering total episode costs while preserving outcomes. Bundled payments that include imaging, stent placement and surveillance support integrated care pathways. Clinicians are incentivized to adopt standardized protocols, helping drive procedural migration from inpatient to outpatient settings. This economic tailwind is particularly strong in the United States and certain EU markets, amplifying overall market demand.
Restraints Impact Analysis of Venous Stents Market*
| Restraint | (~) % Impact on CAGR Forecast | Geographic Relevance | Impact Timeline |
|---|---|---|---|
| High procedure cost & limited awareness | -0.7% | Emerging markets, cost-sensitive systems | Medium term (2-4 years) |
| In-stent restenosis or re-occlusion risk | -0.5% | Global | Long term (≥ 4 years) |
| Nitinol supply-chain disruptions | -0.9% | Worldwide, notably Asia-based processors | Short term (≤ 2 years) |
| Early product recalls dampening confidence | -0.4% | North America, Europe | Short term (≤ 2 years) |
| Source: Mordor Intelligence | |||
High Procedure Cost & Limited Patient Awareness
Total treatment cost can exceed USD 15,000 in systems without strong coverage, limiting access in lower-income regions. Many patients remain unaware that minimally invasive venous therapies exist, and community clinics often lack the imaging needed for diagnosis. Education campaigns aimed at primary care and the public are critical to expanding the venous stents market. Without them, underdiagnosis will continue to suppress demand despite clinical efficacy.
In-Stent Restenosis / Re-Occlusion Risk
Re-stenosis, although less frequent with modern designs, still poses a concern for clinicians managing complex anatomy. Follow-up imaging requirements add cost and can deter patients in price-sensitive markets. Development of drug-eluting and polymer-coated stents seeks to mitigate this risk, but long-term data remain a prerequisite for widespread adoption.
*Our forecasts treat driver/restraint impacts as directional, not additive. The impact forecasts reflect baseline growth, mix effects, and variable interactions.
Venous Stents Market Segment Analysis
By Application:
Pelvic Interventions Drive GrowthLeg interventions generated the largest revenue in 2025, capturing 43.16% of the venous stents market size because post-thrombotic iliofemoral obstruction remains the most common indication. Pelvic procedures, fueled by heightened recognition of May-Thurner syndrome, will outpace all other segments at a 12.28% CAGR. TOPOS trial data showing 90% 12-month patency for oblique nitinol stents in common iliac compression underpin this momentum.Emergence of dedicated protocols for chronic pelvic pain is channeling younger patients toward intervention, expanding total addressable volume.
Rising use of IVUS and venography in office-based labs elevates diagnostic accuracy for pelvic lesions, improving patient selection and outcomes. ASCs leverage shorter recovery times to attract these cases, supporting outpatient expansion within the venous stents market. Meanwhile, abdominal IVC and renal vein work remains niche, and chest interventions for superior vena cava syndrome are largely confined to tertiary centers. Collectively, these trends diversify procedural mix and reinforce long-term market vitality.



By Disease:
Non-Thrombotic Lesions Gain MomentumChronic deep vein thrombosis retained 39.20% venous stents market share in 2025, but non-thrombotic iliac vein lesions will log an 11.17% CAGR through 2031 as clinicians diagnose compression earlier. Abre stent data revealing 97.1% three-year patency in NIVL patients bolsters confidence. Post-thrombotic syndrome, with its collateral burden, still commands large volumes, yet improved algorithms segregate thrombotic from non-thrombotic cases more effectively.
Expanding indications now include venous claudication and chronic pelvic pain, broadening the candidate pool. Acute DVT cases increasingly see adjunctive stenting following thrombectomy to maintain flow. Future growth will depend on payer recognition of these new indications and continued performance of dedicated devices across lesion types.
By Stent Type:
Drug-Eluting Platforms EmergeSelf-expanding nitinol devices delivered 58.95% revenue in 2025, reflecting proven reliability and ease of deployment. Drug-eluting designs, however, will post the leading 11.86% CAGR as trials confirm lower neointimal proliferation. Polymer advancements enable sustained paclitaxel delivery tailored to low-pressure venous flow, pushing adoption further. Covered stents occupy a specific niche in rupture-prone or highly calcified anatomy, while balloon-expandable products gradually decline in favor.
The venous stents market is entering a precision-therapy phase in which combination treatments pair pharmacology with mechanical scaffolds. Manufacturers capable of demonstrating long-term superiority through head-to-head studies will capture share as value-based procurement gains ground.
By Material:
Polymer Innovation AcceleratesNitinol continues to dominate with 71.80% venous stents market share given unmatched super-elasticity. Yet polymer-enhanced constructs will grow 11.62% annually, aiming to curb thrombogenicity and deliver drugs efficiently. Elgiloy and cobalt-chromium solutions serve smaller sub-segments demanding radiopacity or controlled expansion. Stainless steel’s proportion will keep shrinking as newer alloys prove safer and more adaptable.
Material science breakthroughs enable thinner struts that preserve radial strength, aiding deliverability through tortuous venous anatomy. Radiopaque markers integrated into polymer coatings improve intra-procedural visualization, reducing fluoroscopy time and contrast load. Together, these advances sustain a robust innovation pipeline and deepen competitive differentiation.
By End-User:
ASC Growth Transforms Care DeliveryHospitals managed 61.55% of global revenue in 2025, but the ASC channel is expanding at 12.41% CAGR as outpatient models gain payer endorsement. Conscious sedation protocols and smaller access profiles shorten recovery, making same-day discharge realistic for most uncomplicated cases. Specialty vein clinics, often physician-owned, bundle imaging, intervention and surveillance, offering a streamlined patient experience that appeals to cost-conscious insurers.
Regulatory frameworks in the United States provide facility fee parity that supports this shift. Other regions are watching closely, and as reimbursement aligns, the venous stents market will see a more balanced distribution between inpatient and outpatient venues. Device makers now tailor training and support specifically for ASC staff to accelerate adoption.
Geography Analysis
North America Venous Stents Market
North America retained 38.25% of 2025 revenue thanks to mature reimbursement, extensive ASC networks and rapid uptake of newly approved stents. Dedicated registries and post-market studies reinforce safety, encouraging early use in complex disease. Multidisciplinary vascular teams integrate stenting into comprehensive care pathways, supporting procedure volumes across both hospital and outpatient settings.
Europe Venous Stents Market
Europe contributes substantial scientific output and follows standardized treatment algorithms laid out by the 2024 ESVS guidelines. Country-level reimbursement disparities, however, create uneven adoption. Germany and the United Kingdom spearhead clinical research, influencing neighboring markets. Brexit-related regulatory divergence introduces some approval uncertainty, yet demographic drivers and robust evidence maintain steady growth.
APAC Venous Stents Market
Asia-Pacific will post the fastest 11.24% CAGR as infrastructure improves and awareness rises. China’s insurance reforms and Japan’s aging demographic are key catalysts, though limited specialist density restrains some local uptake. International manufacturers are investing in physician education and localized production to navigate complex regulatory pathways. India and Southeast Asia represent longer-term opportunities once procedural capacity broadens.

Regulatory Landscape
US regulatory pathways for dedicated venous stents remain high-scrutiny for implantable vascular devices, with FDA oversight of labeling and lifecycle changes via supplements when evidence changes. In February 2026, Philips Image Guided Therapy Corporation received FDA approval for a PMA supplement (P230021/S003) for the Duo Venous Stent System to update the instructions for use incorporating final results from the VIVID clinical study, underscoring the importance of post-approval evidence and labeling control for venous indications.
Value Chain Analysis
The venous stent value chain begins with specialty inputs such as medical-grade nitinol, engineered polymers, coating chemistries for surface modification, radiopaque markers, and catheter delivery components. Component manufacturing relies on laser cutting, electropolishing, heat setting, and cleanroom assembly, with validation-heavy testing and change-control documentation shaping regulatory submissions and lifecycle management.
Competitive Landscape
The venous stents market exhibits moderate concentration. Medtronic, Boston Scientific and Cook Medical leverage sizable R&D budgets and portfolio breadth to anchor share, buttressed by long-term trial data. Mid-cap specialists pursue differentiation through drug-eluting coatings and bioresorbable scaffolds, targeting physician segments focused on complex anatomy. Competitive focus is shifting from basic radial strength toward drug delivery performance, deployment precision and visibility enhancements.
Strategic collaborations between manufacturers and key opinion leaders generate real-world evidence that shapes reimbursement and guideline updates. Supply-chain resilience now features in competitive positioning following nitinol volatility. Boston Scientific’s double-digit 2025 venous revenue growth underscores the upside for firms with dedicated programs.
Looking ahead, market entrants emphasizing combination therapy and digital follow-up tools could disrupt incumbents, particularly in underserved pediatric or rare-anatomy niches. Nonetheless, incumbents’ regulatory expertise and global service networks remain significant barriers to rapid displacement.
Venous Stents Industry Leaders
Gore Medical
Cook Medical
Boston Scientific Corporation
Becton, Dickinson and Company
Medtronic Plc
- *Disclaimer: Major Players sorted in no particular order
Venous Stents Market Companies Covered in this Report
- Abbott Laboratories
- Beckton Dickinson
- Bentley InnoMed GmbH
- Boston Scientific
- Cook Group
- Cordis
- W. L. Gore & Associates
- plus medica GmbH & Co. KG
- Medtronic
- MicroPort
- Optimed Medizinische Instrumente GmbH
- Koninklijke Philips
- Sinomed
- Terumo Corp.
- Zinas Medical
- Zylox-Tonbridge
- Merit Medical Systems

Market Opportunities and Future Outlook
Opportunity is expanding around purpose-built deep venous indications and broader geographic availability of dedicated platforms, reducing reliance on off-label arterial devices for complex venous anatomy. In January 2026, Gore and Associates announced US FDA approval for the GORE VIABAHN FORTEGRA Venous Stent for deep venous disease in the IVC, iliac, and iliofemoral veins, and in June 2026 announced CE Mark (MDR) approval for the same system in Europe for symptomatic IVC and iliofemoral venous outflow obstruction. These approvals widen the labeled addressable pool in high-volume regions and sharpen competitive differentiation around deep venous and iliocaval disease pathways.
Recent Industry Developments in Venous Stents Market
- June 2026: The GORE VIABAHN FORTEGRA Venous Stent received CE Mark (MDR) approval, enabling broader commercialization in Europe for deep venous indications. This regulatory clearance expands the labeled addressable population for the platform beyond the US. European adoption expands as hospital networks and vascular clinics integrate this dedicated deep venous solution into existing ASC and hospital pathways.
- March 2026: The River stent received US FDA Humanitarian Device Exemption (HDE) approval for severe refractory idiopathic intracranial hypertension. The approval marks regulatory acceptance of venous stenting in specialized intracranial venous pathology. This adds an indication-specific segment to the venous stent landscape.
- June 2024: Philips announced US FDA PMA approval and commercial launch of the Duo Venous Stent System for treatment of symptomatic venous outflow obstruction in the iliofemoral veins. The platform provided a regulatory-backed label and a dedicated venous device, reinforcing the shift toward purpose-built venous devices supported by clinical evidence and training.


Venous Stents Market Report Scope and Research Methodology
Market Definition and Coverage
This market covers implantable venous stents that are placed in veins to reopen or maintain blood flow where narrowing or blockage is present, and the values reflect device revenues at the point of sale into the care setting.
Scope exclusions: Excluded from this sizing are coronary stents, peripheral arterial stents, non-vascular stents, and bioresorbable scaffold stents that are not indicated for venous use.
Segments Covered in This Report
- By Application
- Leg (Ilio-femoral)
- Pelvic
- Abdomen (IVC / Renal)
- Chest (SVC)
- Others
- By Disease
- Chronic Deep Vein Thrombosis
- Post-Thrombotic Syndrome
- Non-Thrombotic Iliac Vein Lesion / May-Thurner
- Acute DVT
- Others
- By Stent Type
- Self-expanding Nitinol Stents
- Balloon-expandable Stents
- Covered Stents
- Drug-eluting Stents
- Bioresorbable Scaffolds
- Others
- By Material
- Nitinol
- Elgiloy / Co-Cr Alloy
- Stainless Steel
- Polymer-based
- Others
- By End-user
- Hospitals
- Ambulatory Surgical Centres
- Specialty Vein Clinics
- Others
- By Geography
- North America
- United States
- Canada
- Mexico
- Europe
- Germany
- United Kingdom
- France
- Italy
- Spain
- Rest of Europe
- Asia-Pacific
- China
- Japan
- India
- Australia
- South Korea
- Rest of Asia-Pacific
- Middle East and Africa
- GCC
- South Africa
- Rest of Middle East and Africa
- South America
- Brazil
- Argentina
- Rest of South America
- North America
Data Sources, Market Sizing, and Validation
Desk Research
Desk research was used to set the clinical and utilization context before sizing, so our model inputs stay tied to real treatment pathways for venous obstruction. We relied on public sources such as the US FDA device databases for device and indication context, the US National Library of Medicine for clinical studies, CDC health statistics for disease context, and OECD health data for procedure setting signals across countries.
To make the revenue side more consistent, we also reviewed annual reports, investor presentations, and credible medical device news coverage to track product launches and regional exposure patterns. In parallel, we used paid subscriptions for company financials and intelligence, plus a patent database to cross-check innovation focus and timing. These sources are illustrative only, and many other public materials were reviewed to collect data, validate assumptions, and clarify open points.
Primary Interviews and Surveys
Primary work was done through expert interviews and structured surveys with clinicians, hospital procurement staff, distributors, and device-side commercial teams, so pricing and adoption assumptions could be checked against how cases are actually handled. Because this is a global market, discussions were spread across the Americas, EMEA, and APAC to capture differences in procedure mix, reimbursement comfort, and the pace of new venous stent uptake.
Distribution of primary research fieldwork respondents
| Company type | Respondent position | Region |
|---|---|---|
| Top tier: 38% | CXOs: 15% | APAC: 46% |
| Mid tier: 43% | Functional/Unit leaders: 40% | EMEA: 36% |
| Smaller Players: 19% | Managers: 45% | Americas: 18% |
Market-Sizing & Forecasting
For the core sizing, a top-down build was first created by reconstructing the demand pool from venous disease treated volumes and mapping it to typical stent usage per case, which are then translated into value using country level pricing ranges. Once the first cut was ready, we corroborated it using selective bottom-up approximations, including supplier revenue cues, channel feedback, and sampled average selling price times implied unit volumes. Totals were then adjusted where the two views did not reconcile.
Inputs used in the model were kept practical and repeatable, including estimated venous intervention volumes (especially for chronic obstruction and post-thrombotic cases), the share of cases eligible for stenting, typical number of stents per procedure, mix between self-expanding and balloon-expandable systems, and regional price bands after normalizing to USD. Where smaller countries had thin public signals, proxy utilization from similar reimbursement and care settings was applied, then checked again during interviews.
Forecasts were generated using scenario analysis around adoption and pricing, since regulatory clearances, physician comfort, and site-of-care shifts can change the curve in steps instead of a straight line. Assumptions on penetration and price movement were reviewed with primary respondents, and the final path was kept consistent with observed procedure setting trends and device replacement cycles.
Data Validation & Update Cycle
Validation was done by triangulating model outputs against independent signals, including procedure setting direction, regional demand patterns, and reported business exposure clues from public documents. Outliers were flagged through variance checks across countries and across time, then resolved through a second analyst review of inputs, formulas, and conversion factors before sign-off.
If a large mismatch surfaced, or if a material event changed utilization expectations, respondents were re-contacted to re-test the specific assumption rather than reworking the whole model. Reports are refreshed annually, with interim updates when meaningful regulatory, reimbursement, or supply changes occur, and a final pre-delivery pass is completed so clients receive the latest updated view.
Mordor Intelligence's Venous Stents Market Size Compared With Other Published Estimates
Published numbers for venous stents do not always line up, even when the topic appears similar, because the counted products, timing, and pricing steps can differ. The year used as the anchor, whether figures are reported as manufacturer revenues or broader sales values, and how procedure demand is translated into units are common starting points for those gaps.
Coronary and peripheral arterial stents sit outside Mordor Intelligence's scope here, and that product boundary alone can shift totals when other sources discuss stents more broadly or do not state device indication limits clearly. Differences also come from how quickly average selling prices are assumed to fall as volumes expand, whether local currency is converted at a single spot rate versus an average year rate, and whether adoption scenarios are validated with practicing clinicians and hospital buyers across regions.
Benchmark comparison
| Source | Market Size | Gaps in Research Methodology |
|---|---|---|
| Mordor Intelligence | USD 1.38 B (2026) | |
| Global Consultancy A | USD 1.13 B (2026) | Uses a different base build from a 2025 anchor and carries forward a narrower near-term adoption curve, which can undercount procedures transitioning into outpatient settings and delay volume ramp assumptions. |
| Research Publisher B | USD 1.19 B (2024) | Reported year is earlier and the forecast window starts later, so price and penetration are not aligned to the same timing, and the scope description is higher level, which makes inclusion checks by indication and use setting harder. |
Overall, the spread is mainly explained by scope clarity, anchor year choice, and how procedure demand and pricing are converted into value. By keeping the inputs tied to treated case volumes, stent usage per case, and region-specific price bands, the estimate stays traceable to practical steps that can be retested when new clinical adoption signals emerge.


Key Questions Answered in the Report
What is the current size of the venous stents market?
The market is valued at USD 1.38 billion in 2026 and is set to grow at an 7.62% CAGR to reach USD 1.99 billion by 2031.
Which application segment is expanding the fastest?
Pelvic venous interventions, driven by rising recognition of May-Thurner syndrome, are expected to grow at 12.28% CAGR through 2031.
Which is the fastest growing region in Global Venous Stents Market?
Asia-Pacific is estimated to grow at the highest CAGR over the forecast period (2026-2031).
How significant is North America in the venous stents market?
North America holds 38.25% revenue share, supported by favorable reimbursement and extensive ASC infrastructure.
Why are ambulatory surgical centers gaining market share?
ASCs offer same-day discharge, lower costs, and high patient satisfaction, leading to a projected 12.41% CAGR in this setting.
What is driving interest in drug-eluting venous stents?
Clinical evidence indicates reduced restenosis and improved long-term patency, fostering a 11.86% CAGR for these devices.
How are supply-chain risks being addressed?
Manufacturers are diversifying nitinol sourcing and investing in domestic processing to mitigate geopolitical uncertainties.
Page last updated on:


 Your data is secure and never sold or shared.


