Market Overview
| Study Period | 2019 - 2031 |
|---|---|
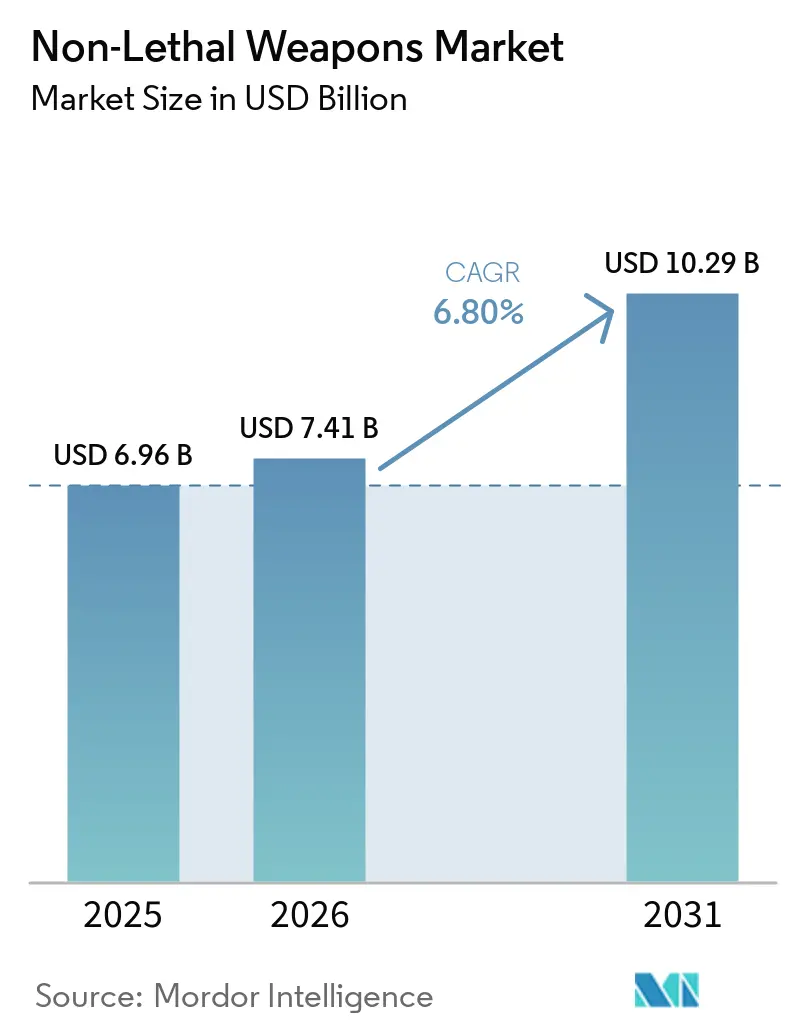
| Market Size (2026) | USD 7.41 Billion |
| Market Size (2031) | USD 10.29 Billion |
| Growth Rate (2026 - 2031) | 6.80% CAGR |
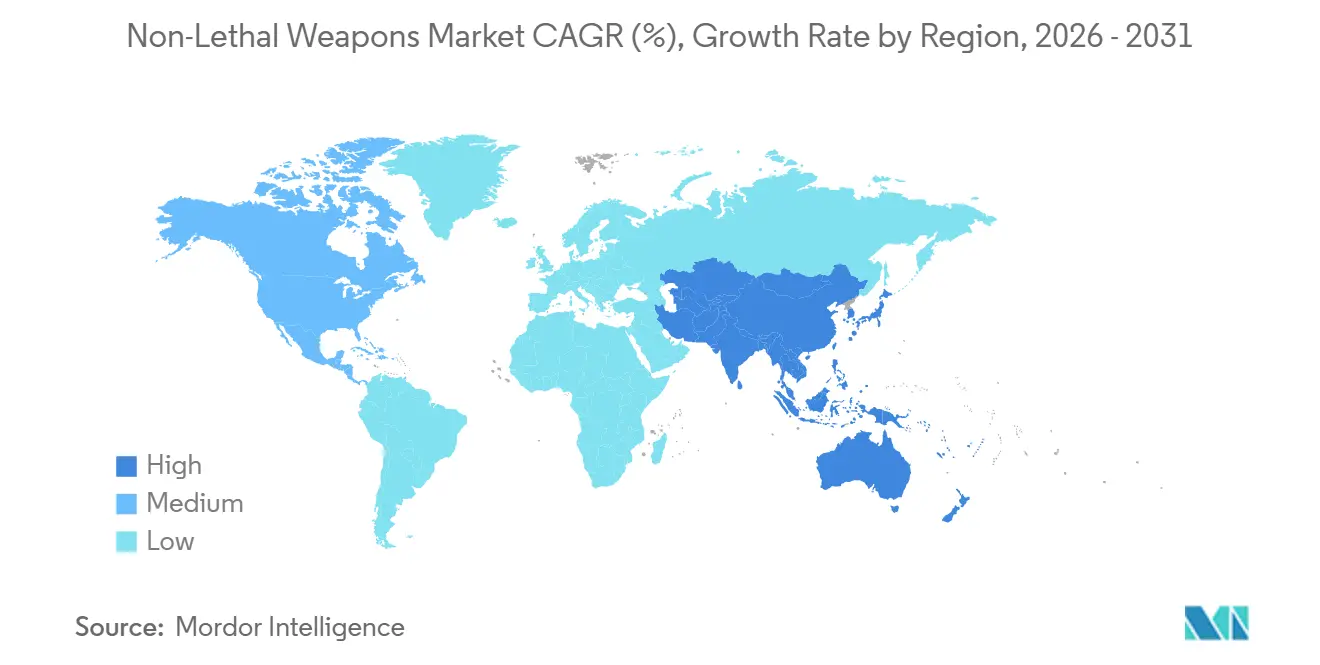
| Fastest Growing Market | Asia Pacific |
| Largest Market | North America |
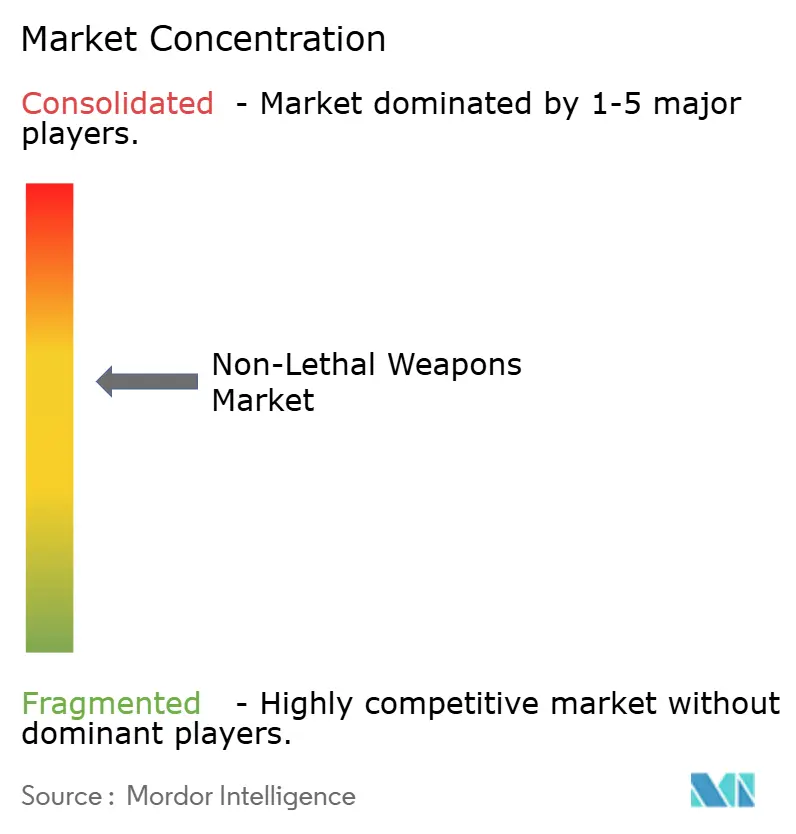
| Market Concentration | Medium |
Major Players *Disclaimer: Major Players sorted in no particular order Image © Mordor Intelligence. Reuse requires attribution under CC BY 4.0. | |
Non-Lethal Weapons Market Analysis by Mordor Intelligence
The non-lethal weapons market size is expected to grow from USD 6.96 billion in 2025 to USD 7.41 billion in 2026 and is forecasted to reach USD 10.29 billion by 2031 at an 6.80% CAGR over 2026-2031. Civil liability concerns and increasing insurance premiums are driving the shift from lethal to less-lethal force options. Agencies now require the integration of conducted-energy weapons with body-worn cameras and cloud-based evidence management systems, ensuring that discharge events are automatically uploaded for supervisory review, reducing the likelihood of claims disputes. These digital evidence systems are influencing bid specifications, favoring vendors that offer integrated hardware and software solutions that minimize training requirements and simplify audit processes.
Advancements in directed-energy, acoustic-hailing, and smart munition technologies are expanding operational capabilities. Beam-based incapacitation enables precise standoff engagement, while GPS-enabled projectiles and adaptive audio warnings deliver scalable effects that minimize the risk of collateral injuries. Procurement agencies are increasingly consolidating vendor lists to streamline maintenance and certification processes, creating higher entry barriers for companies without diverse product portfolios or ISO-compliant quality standards. Ongoing police reform mandates, repeated waves of civil protests, and the adoption of dual-use technologies by defense and homeland security agencies are driving investments in proportional-force technologies.[1]Axon Enterprise, “Investor Relations,” AXON.COM
Key Report Takeaways
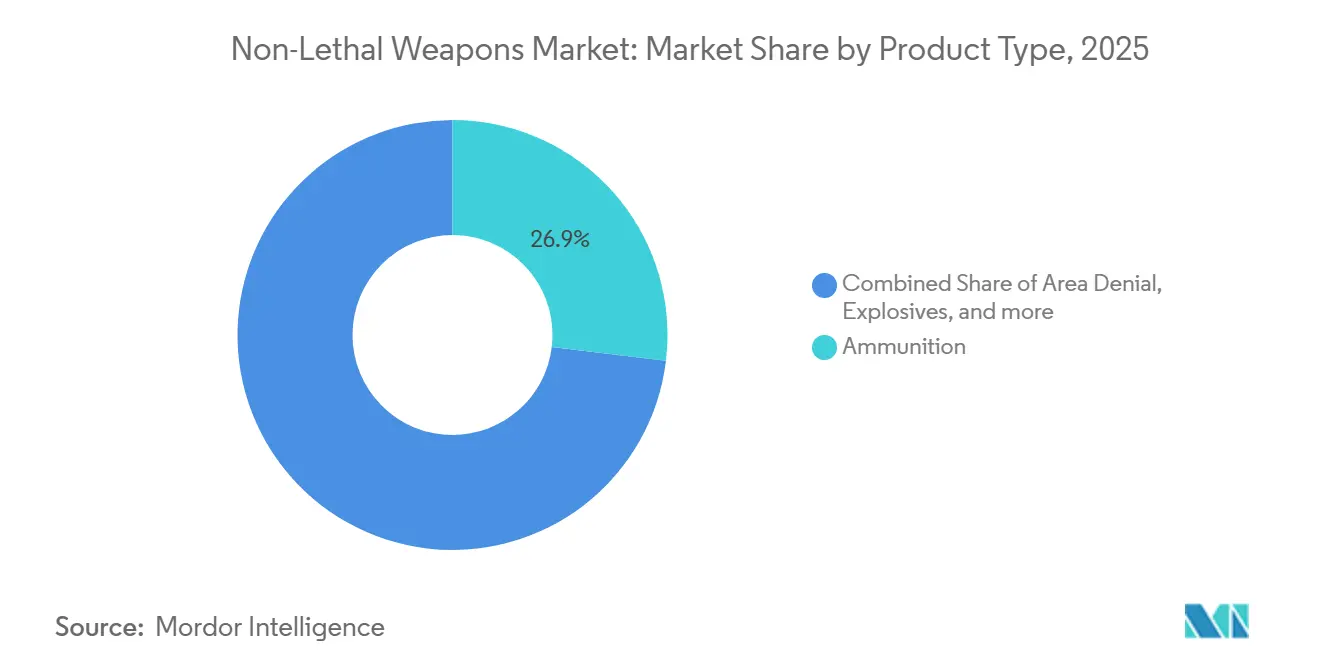
- By product type, ammunition led the non-lethal weapons market with 26.91% share in 2025, while directed-energy systems are forecast to expand at a 12.43% CAGR through 2031.
- By end user, law enforcement accounted for 64.90% of the non-lethal weapons market size in 2025, while military applications are advancing at a 7.12% CAGR through 2031.
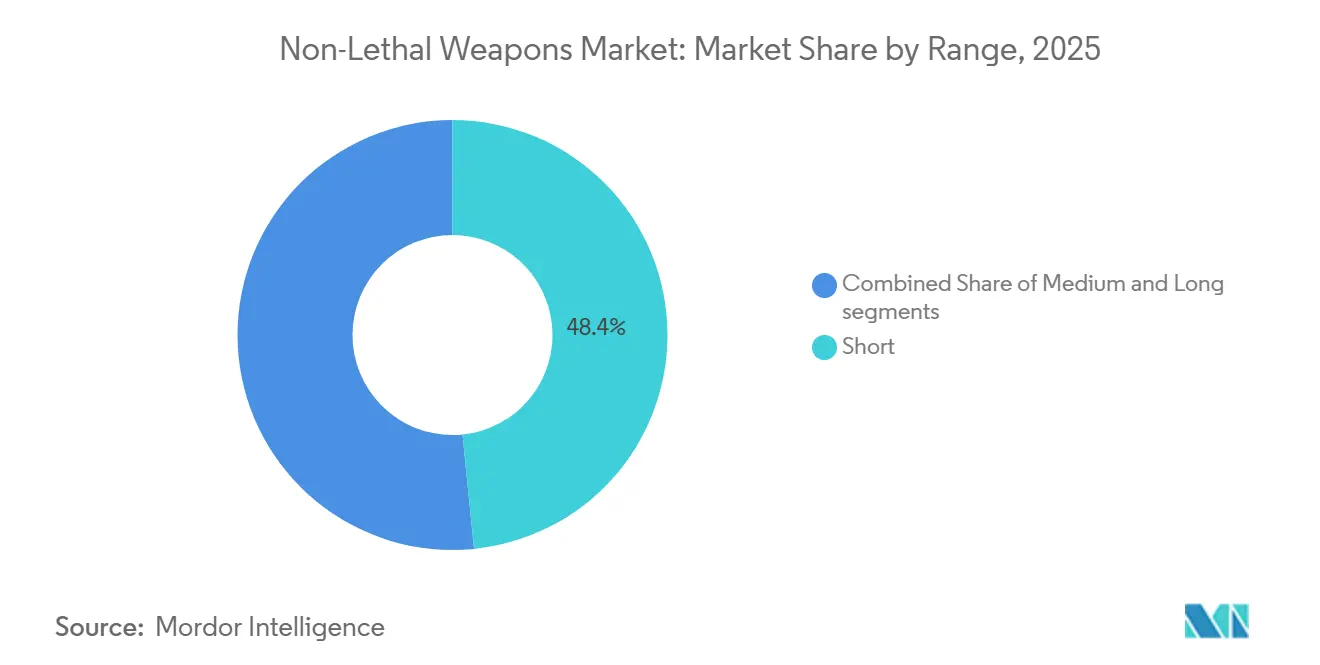
- By range, short-range solutions accounted for 48.40% of revenue share in 2025; long-range platforms are projected to grow at an 8.31% CAGR through 2031.
- By application, crowd control retained a 38.58% share of 2025 revenue, whereas border security requirements are registering the fastest 7.46% CAGR through 2031.
- By geography, North America accounted for 36.95% of revenue share in 2025; Asia-Pacific is projected to grow at a 7.17% CAGR through 2031.
Note: Market size and forecast figures in this report are generated using Mordor Intelligence’s proprietary estimation framework, updated with the latest available data and insights as of January 2026.
Global Non-Lethal Weapons Market Trends and Insights
Drivers Impact Analysis*
| Driver | (%) Impact on CAGR Forecast | Geographic Relevance | Impact Timeline |
|---|---|---|---|
| Law-enforcement modernization and de-escalation mandates | +1.20% | North America and Europe, spillover to Asia-Pacific | Medium term (2-4 years) |
| Rising civil unrest and crowd-management demand | +1.50% | Global, concentrated in North America, Europe, South America, Middle East | Short term (≤ 2 years) |
| Dual-use adoption in defense, homeland security, and border operations | +1.30% | Global, led by North America, Asia-Pacific, Middle East | Medium term (2-4 years) |
| Technology advances: directed energy, acoustic hailing, smart munitions | +1.80% | North America and Europe, early adoption in Asia-Pacific | Long term (≥ 4 years) |
| Litigation and insurance pressures favoring less-lethal force options | +0.90% | North America and Europe | Short term (≤ 2 years) |
| Evidence ecosystem integration (bodycams, auto-reporting) accelerates CEW procurement | +1.10% | North America, expanding to Europe and Asia-Pacific | Medium term (2-4 years) |
| Source: Mordor Intelligence | |||
Law-Enforcement Modernization and De-Escalation Mandates
Police reform statutes in the US and the European Union (EU) now link federal or bloc funding to demonstrated use of proportional-force capabilities. This has prompted agencies to expand their inventories to include conducted-energy weapons, impact rounds, and chemical irritants. Training programs now prioritize verbal engagement as the initial response, followed by staged less-lethal measures, leading to a reallocation of budgets from firearms training to certification on these new tools. Larger departments are increasingly adopting integrated platforms that record every trigger pull and upload footage for supervisory review, a feature that remains financially challenging for smaller rural agencies. The ongoing mandate cycle is anticipated to drive new procurement opportunities through 2028, after which replacement programs are expected to take precedence. This policy-driven demand serves as a key growth driver for the non-lethal weapons market.
Rising Civil Unrest and Crowd-Management Demand
Global demonstrations surged during 2024-2025, ranging from pension protests in France to economic marches in Chile, prompting police forces to reevaluate their crowd-control equipment. Urban density restricts tactical maneuverability, leading commanders to prioritize long-range acoustic devices and pepper-spray drones to disperse crowds without direct physical engagement. Procurement agencies increased stockpiles of rubber bullets, tear-gas canisters, and water cannons after earlier unrest led to supply shortages. However, public health advocates have raised concerns about potential respiratory and auditory harm, leading some city councils to impose restrictions on deployment hours. Despite this scrutiny, recurring protests continue to drive demand in the non-lethal weapons market, with a focus on rapid-delivery contracts.
Dual-Use Adoption in Defense, Homeland Security, and Border Operations
Border surges, peacekeeping rotations, and urban-warfare doctrines require proportional force to minimize diplomatic repercussions. In 2025, the US Department of Defense (DoD) allocated funding for additional Active Denial System units for perimeter defense, while Customs and Border Protection procured new bean-bag rounds and pepper-spray projectiles for use in migrant-processing zones.[2]U.S. Customs and Border Protection, “Procurement Contracts,” CBP.GOV NATO partners are testing acoustic hailing equipment for shipboarding operations and riot control. While defense procurement processes are lengthy, they result in substantial multi-year contracts once technical requirements are met, providing consistent revenue streams for approved vendors. The overlap between military and policing applications expands the non-lethal weapons market beyond conventional law enforcement budgets.
Technology Advances: Directed Energy, Acoustic-Hailing, Smart Munitions
Millimeter-wave beams, high-intensity sound bursts, and GPS-guided irritant rounds represent advancements beyond traditional blunt-impact projectiles. Field trials for Active Denial prototypes were completed in 2024, and law enforcement versions are currently being evaluated for perimeter security applications. Genasys' long-range acoustic devices now feature multilingual voice warnings and variable-frequency deterrent tones, with an operational range exceeding 1 km on border vehicles. Flash-bang grenades equipped with electronic fuses and self-diagnostic capabilities minimize misfires and accidental injuries. While these technologies require significant capital investment, they enable suppliers to maintain premium margins and reinforce their position in the non-lethal weapons market.
Restraints Impact Analysis*
| Restraint | (%) Impact on CAGR Forecast | Geographic Relevance | Impact Timeline |
|---|---|---|---|
| Human-rights, liability, and regulatory constraints on specific NLW classes | -0.80% | Global, concentrated in Europe, North America, select Asia-Pacific markets | Medium term (2-4 years) |
| Effectiveness variability and training gaps across agencies | -0.60% | Global, acute in smaller municipalities and developing markets | Short term (≤ 2 years) |
| Environmental and chemical restrictions on irritants and carriers | -0.50% | Europe, North America, select Asia-Pacific markets | Long term (≥ 4 years) |
| Public pushback on acoustic/energy devices over health impacts | -0.40% | North America, Europe | Medium term (2-4 years) |
| Source: Mordor Intelligence | |||
Human-Rights, Liability, and Regulatory Constraints on Specific NLW Classes
Amnesty International reported eye and chest injuries caused by rubber bullets during demonstrations in 2024, leading to calls for comprehensive bans on kinetic impact munitions. The European Committee for the Prevention of Torture has proposed injury-threshold testing as a prerequisite for introducing any new less-lethal weapon models into service within member states. In 2025, US municipalities faced multi-million-dollar settlements stemming from the misuse of tasers and projectiles, prompting insurers to raise premiums or exclude coverage altogether. As a result, vendors must navigate a complex landscape of approval laboratories and disclosure regulations, which increase costs and delay product launch timelines. This heightened regulatory oversight has constrained the short-term growth potential for certain segments of the non-lethal weapons market.
Effectiveness Variability and Training Gaps Across Agencies
Conducted-energy weapons are less effective against thick winter clothing, while sponge rounds deviate from their trajectory beyond 20 meters, increasing the risk to bystanders. According to the Police Executive Research Forum, only 40% of US municipal police forces completed annual re-certification for less-lethal weapons in 2025, compared to 85% compliance with firearms re-certification. Budget constraints often lead departments to rotate equipment without sufficient training, reducing officer confidence and increasing reliance on firearms. These inconsistencies contribute to public skepticism and legal challenges, which further hinder new acquisitions. Addressing these issues through scenario-based simulators and regular training programs is critical for the non-lethal weapons market to fulfill its safety objectives.
*Our forecasts treat driver/restraint impacts as directional, not additive. The impact forecasts reflect baseline growth, mix effects, and variable interactions.
Segment Analysis
By Product Type: Directed Energy Leads Innovation Surge
Ammunition accounted for 26.91% of the non-lethal weapons market share in 2025. However, directed-energy platforms are projected to grow at a CAGR of 12.43% through 2031, marking the fastest growth among all product categories. Legacy rubber and plastic rounds continue to dominate daily riot control operations due to their compatibility with widely deployed 40 mm and 12-gauge launchers. Nonetheless, law enforcement agencies increasingly view beam systems as a strategic upgrade, as these systems eliminate the need for projectile resupply and reduce the risk of accidental harm to bystanders. Electroshock weapons remain a key segment, supported by Axon's TASER product line, which integrates real-time firing logs with cloud-based video storage, meeting oversight boards' demands for comprehensive evidence trails.
The adoption of directed-energy systems is accelerating as defense ministries approve vehicle-mounted Active Denial units for applications such as base perimeter security and maritime interdiction. Smart munitions are also gaining traction, with innovations like GPS-enabled tear-gas canisters and self-diagnosing flash-bangs addressing the accuracy and reliability issues of earlier designs. Additionally, new market entrants, such as Byrna, are introducing CO₂-powered handheld launchers that do not require firearms licenses, thereby expanding access for civilians and smaller agencies. As a result, product portfolios are diverging into two distinct categories: low-cost kinetic solutions and premium electronic or beam-based options, each catering to specific user needs within the broader non-lethal weapons market.


By End User: Military Adoption Accelerates
Law enforcement organizations accounted for 64.90% of the projected 2025 revenue. However, the military segment is expected to achieve a 7.12% CAGR through 2031, driven by the growing need for scalable forces under the urban operations doctrine. The non-lethal weapons market allocated to infantry and gendarmerie units expands during peacekeeping missions or migrant-border surges, which require proportional engagement. The US and NATO forces have integrated active-denial systems and acoustic-hailing devices into patrol vehicles. At the same time, special operations teams have standardized the use of low-flash diversionary grenades for hostage rescue operations.
Procurement challenges in the defense sector are significant, requiring ruggedization, cybersecurity enhancements, and multi-service interoperability. However, once platforms pass testing, procurement contracts typically span five- to seven-year budget cycles, ensuring stable vendor revenue. Homeland security branches increasingly blur the line between civil and military applications by adopting military-grade bean-bag and pepper-ball rounds for border patrol operations, supporting the dual-use concept. Additionally, private security and corrections sectors contribute niche demand for compact electroshock and irritant devices, which help mitigate litigation risks in confined environments, thereby diversifying the customer base.
By Range: Standoff Capabilities Drive Long-Range Growth
Short-range solutions under 30 m delivered 48.40% of 2025 turnover, but long-range systems above 100 m are on track for an 8.31% CAGR to 2031 as agencies seek to neutralize threats before physical contact.[3]Genasys Inc., “LRAD Border Systems,” GENASYS.COM Medium-range 40 mm launchers address the need for crowd dispersion; however, commanders are increasingly considering vehicle-mounted acoustic devices and millimeter-wave beams as safer initial response options.
Factors such as environmental drag, line-of-sight limitations, and public health concerns restrict the adoption of high-power acoustics and energy beams, particularly in dense urban areas where sound reflections can amplify pressure levels. Despite these challenges, border forces value technologies such as warning tones that can travel over 1 km and heat beams that can deter trespassers without resorting to lethal measures. Additionally, portable drone-mounted pepper-spray pods are extending non-lethal deterrence capabilities to rooftops and narrow alleys, enhancing operational range. These advancements emphasize range as a critical factor in the non-lethal weapons market, influencing procurement decisions in upcoming tenders.
By Application: Border Security Gains Strategic Priority
Crowd-control applications accounted for 38.58% of the non-lethal weapons market size in 2025. However, border security programs are projected to grow at a CAGR of 7.46% through 2031, the fastest among tracked applications. Sovereign agencies in regions such as the US, the EU, and the Middle East are deploying bean-bag munitions, pepper-ball drones, and acoustic-hailing towers at high-traffic border crossings to prevent lethal incidents that could lead to diplomatic tensions.
The demand for perimeter security at airports, oil terminals, and data centers is also increasing as asset owners transition from traditional measures, such as guard dogs and warning shots, to advanced solutions, such as smart flash-bangs and light-based dazzlers. These technologies deter intruders while preserving infrastructure. Additionally, personal self-defense represents a small but growing retail segment, with urban consumers purchasing compact sprays or launcher kits in areas where firearm permits are limited. Vendors are now developing modular platforms capable of swapping payloads, such as irritant powder or electro-shock cartridges. This flexibility allows a single chassis to be used by police riot squads on one day and border patrol units on another, enhancing the lifetime value of products within the non-lethal weapons market.
Geography Analysis
North America accounted for 36.95% of the projected 2025 revenue, driven by consistent procurement from US federal, state, and municipal agencies. These agencies bundle conducted-energy weapons with cloud-evidence suites and place recurring ammunition orders through the Department of Homeland Security (DHS). Canada continues to follow US use-of-force protocols, advancing nationwide taser deployments, while Mexican federal police procure sponge grenades and OC sprays for cartel-interdiction operations. The region benefits from the highest per-officer equipment budgets globally. However, growth is slowing as many large departments transition from initial purchases to cyclical upgrades, keeping the near-term CAGR below the global average.
The Asia-Pacific region is expected to grow at a 7.17% CAGR through 2031, the fastest among all regions. This growth is fueled by modernization initiatives in China, India, Japan, and South Korea, focusing on riot police equipment and border barrier technologies. In 2025, China's Ministry of Public Security bulk-ordered water-cannon vehicles and electroshock batons, deploying them in Hong Kong and Xinjiang. India's Central Reserve Police Force updated tear-gas and pepper-ball inventories for use in protest-prone areas. Meanwhile, Japan and South Korea installed long-range acoustic devices at airport perimeters and naval bases. Domestic sourcing regulations and price sensitivity continue to limit Western vendors' market penetration. However, the addressable market for non-lethal weapons in the Asia-Pacific is expanding due to increasing urban population density and cross-border tensions.
Europe, South America, and the Middle East and Africa collectively account for the remaining market share. In Europe, the European Union's strict proportional-force doctrine sustains demand for smart munitions that log impact energy. However, new REACH chemical regulations are slowing sales of CS and OC agents. In South America, Brazil leads in volume, equipping military police with rubber rounds and flash-bangs to secure stadiums ahead of the 2026 FIFA World Cup. In the Middle East, Gulf Cooperation Council states are increasing perimeter security budgets and purchasing millimeter-wave active denial trucks and acoustic-hailing towers to protect oil terminals without resorting to lethal measures. Africa remains an emerging market, with UN peacekeeping missions introducing tasers and tear-gas drones in Nigeria and the Sahel, creating long-term growth opportunities for the non-lethal weapons market.

Competitive Landscape
The supplier landscape in the non-lethal weapons market is moderately concentrated, with a few multi-product incumbents dominating the field. However, niche innovators continue to enter the market, focusing on single-category specializations. Axon Enterprise leads the electroshock segment and utilizes its Evidence.com cloud platform to secure multi-year software subscriptions, which are now growing faster than its hardware revenue. Safariland holds a strong position in chemical sprays and impact rounds, supported by extensive US distribution networks. Meanwhile, Rheinmetall and FN HERSTAL leverage their artillery expertise to produce durable 40 mm less-lethal launchers for European gendarmerie units.
Genasys, a pioneer in acoustic communications, dominates the long-range hailing niche. In 2025, border-patrol contracts included fixed-tower units equipped with AI-driven language libraries to automate instructions for migrants. Byrna Technologies capitalizes on regulatory gaps by selling CO₂ ball-launchers directly to consumers and smaller police forces in regions with restrictive firearms licensing, creating a rapidly expanding self-defense micro-segment. Start-ups focusing on millimeter-wave crowd-dispersal technologies or drone-mounted irritant pods are attracting venture capital but face challenges with power sources and public acceptance, hindering mass adoption.
Merger and acquisition (M&A) activity is gaining momentum as established players aim to expand their portfolios to secure "single-vendor" contracts that bundle tasers, cameras, munitions, and software services. In 2025, Axon acquired a body-camera AI analytics firm, while Safariland purchased a flash-bang specialist to enhance its product offerings. Defense primes are exploring joint ventures rather than outright acquisitions to maintain security-clearance chains. The non-lethal weapons market is increasingly favoring ecosystem-oriented players with compliance laboratories, SaaS platforms, and global training capabilities. This trend is putting pressure on pure-play projectile manufacturers to pivot toward partnership networks to remain competitive.
Non-Lethal Weapons Industry Leaders
Axon Enterprise, Inc.
Safariland, LLC
Rheinmetall AG
Combined Systems, Inc.
Genasys Inc.
- *Disclaimer: Major Players sorted in no particular order

Recent Industry Developments
- February 2026: The Philippine National Police - Police Regional Office Bangsamoro Autonomous Region (PRO BARMM) has invited bids for the supply and delivery of a large number of non-lethal weapons for FY2026. The evaluation process will adhere to the "lowest calculated responsive bid" criteria, ensuring the equipment complies with the PNP's operational standards for crowd control and tactical operations while maintaining cost efficiency.
- October 2025: China unveiled a new weapon, the "blackout bomb," crafted to disrupt enemy power grids without inflicting physical damage. This move highlights China's commitment to broadening its suite of non-kinetic warfare capabilities.
- April 2025: At Milipol India 2025, TRETA Tactical Solutions unveiled the Theoram Mark-1, its latest non-lethal defense innovation. This compact pistol meets the needs of both law enforcement and civilian self-defense. Theoram Mark-1 fires proprietary chemical irritant projectiles, ensuring effective deterrence while significantly reducing the risk of permanent harm. TRETA's focus on rapid deployment and incapacitation without lethality meets the rising demand for safer alternatives to conventional firearms, especially in riot control, perimeter security, and personal protection.


Global Non-Lethal Weapons Market Report Scope
The non-lethal weapons industry encompasses the sales of less-lethal force technologies deployed across law enforcement, military, and civilian self-defense applications. The market report offers an overview of procurement trends among law enforcement agencies, defense spending on non-lethal capabilities, civil unrest incidents driving demand for crowd management, regulatory developments affecting product deployment, and technology advancements in directed energy, electroshock, and smart munitions systems.
The non-lethal weapons market report is segmented by product type, end user, range, application, and geography. By product type, the market is segmented into area denial, ammunition, explosives, gases and sprays, directed energy weapons, and electroshock weapons. Area denial is further segmented into anti-vehicle and anti-personnel systems. Ammunition is further segmented into rubber bullets, wax bullets, plastic bullets, bean bag rounds, and sponge grenades. Explosives are further segmented by flash bang grenades and sting grenades. Gases and sprays are further segmented into water cannons, scent-based weapons, tear gas, and pepper spray. By end user, the market is segmented into law enforcement and military. By range, the market is segmented into short (less than 30 m), medium (30 to 100 m), and long (greater than 100 m). By application, the market is segmented into crowd control, border security, personal self-defense, and perimeter security. The report also covers the market sizes and forecasts for the non-lethal weapons market in major countries across different regions. For each segment, the market size is provided in terms of value (USD).
By Product Type
| Area Denial | Anti-vehicle |
| Anti-personnel | |
| Ammunition | Rubber Bullets |
| Wax Bullets | |
| Plastic Bullets | |
| Bean Bag Rounds | |
| Sponge Grenade | |
| Explosives | Flash Bang Grenades |
| Sting Grenades | |
| Gases and Sprays | Water Cannons |
| Scent-based Weapons | |
| Tear Gas | |
| Pepper Spray | |
| Directed Energy Weapons | |
| Electroshock Weapons |
By End User
| Law Enforcement |
| Military |
By Range
| Short (Less than 30 m) |
| Medium (30 to 100 m) |
| Long (Greater than 100 m) |
By Application
| Crowd Control |
| Border Security |
| Personal Self-Defense |
| Perimeter Security |
By Geography
| North America | United States | |
| Canada | ||
| Mexico | ||
| Europe | United Kingdom | |
| France | ||
| Germany | ||
| Italy | ||
| Rest of Europe | ||
| Asia-Pacific | China | |
| India | ||
| Japan | ||
| South Korea | ||
| Rest of Asia-Pacific | ||
| South America | Brazil | |
| Rest of South America | ||
| Middle East and Africa | Middle East | Saudi Arabia |
| United Arab Emirates | ||
| Rest of Middle East | ||
| Africa | South Africa | |
| Rest of Africa | ||
| By Product Type | Area Denial | Anti-vehicle | |
| Anti-personnel | |||
| Ammunition | Rubber Bullets | ||
| Wax Bullets | |||
| Plastic Bullets | |||
| Bean Bag Rounds | |||
| Sponge Grenade | |||
| Explosives | Flash Bang Grenades | ||
| Sting Grenades | |||
| Gases and Sprays | Water Cannons | ||
| Scent-based Weapons | |||
| Tear Gas | |||
| Pepper Spray | |||
| Directed Energy Weapons | |||
| Electroshock Weapons | |||
| By End User | Law Enforcement | ||
| Military | |||
| By Range | Short (Less than 30 m) | ||
| Medium (30 to 100 m) | |||
| Long (Greater than 100 m) | |||
| By Application | Crowd Control | ||
| Border Security | |||
| Personal Self-Defense | |||
| Perimeter Security | |||
| By Geography | North America | United States | |
| Canada | |||
| Mexico | |||
| Europe | United Kingdom | ||
| France | |||
| Germany | |||
| Italy | |||
| Rest of Europe | |||
| Asia-Pacific | China | ||
| India | |||
| Japan | |||
| South Korea | |||
| Rest of Asia-Pacific | |||
| South America | Brazil | ||
| Rest of South America | |||
| Middle East and Africa | Middle East | Saudi Arabia | |
| United Arab Emirates | |||
| Rest of Middle East | |||
| Africa | South Africa | ||
| Rest of Africa | |||


Key Questions Answered in the Report
How fast are global non-lethal weapons revenues growing through 2031?
Sales are on track to climb from USD 7.41 billion in 2026 to USD 10.29 billion by 2031, a 6.80% CAGR driven by police-reform mandates, crowd-control demand, and dual-use defense adoption.
Which product category is expanding the quickest?
Directed-energy platforms, such as millimeter-wave Active Denial Systems, are forecasted to post the highest 12.43% CAGR as agencies seek precise, reload-free standoff options.
Where is procurement momentum strongest geographically?
Asia-Pacific leads with a projected 7.17% CAGR as China, India, Japan, and South Korea modernize riot-control and border-security inventories.
What end-user segment is accelerating beyond historical norms?
Military and homeland-security organizations are advancing at a 7.12% CAGR as urban-operations doctrine embeds scalable force modules alongside lethal weaponry.
Which application is set to outpace traditional crowd-control demand?
Border-security programs are projected to grow 7.46% annually, reflecting global migration pressures and the need for proportional deterrence at land and maritime crossings.
How concentrated is supplier power today?
The top five vendors control about 55% of global revenue, indicating a moderate concentration that still allows room for niche innovators.
Page last updated on:


