
Market Overview
| Study Period | 2021 - 2031 |
|---|---|
| Forecast Data Period | 2026 - 2031 |
| Base Year Market Size (2025) | 3.59 gigawatt |
| Market Volume (2026) | 4.51 gigawatt |
| Market Volume (2031) | 14.07 gigawatt |
| Growth Rate (2026 - 2031) | 25.58 % |
| Market Concentration | Medium |
Major Players *Disclaimer: Major Players sorted in no particular order Image © Mordor Intelligence. Reuse requires attribution under CC BY 4.0. | |
Nigeria Renewable Energy Market Analysis by Mordor Intelligence
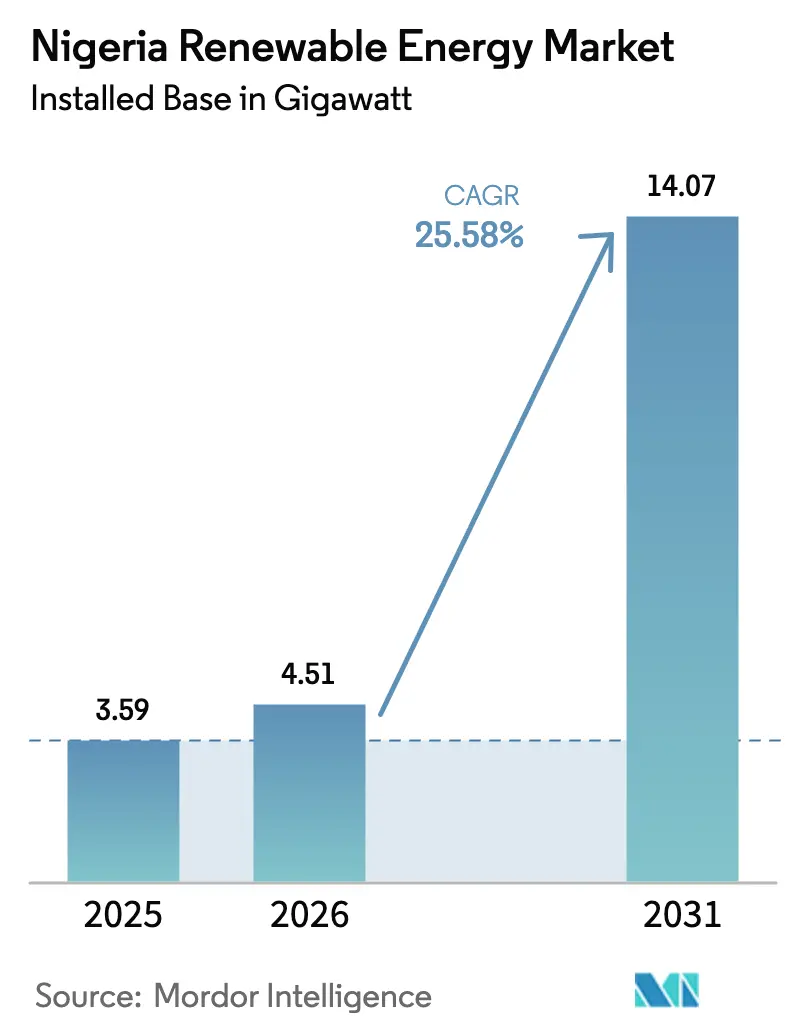
The Nigeria Renewable Energy Market size was valued at 3.59 gigawatt in 2025 and estimated to grow from 4.51 gigawatt in 2026 to reach 14.07 gigawatt by 2031, at a CAGR of 25.58% during the forecast period (2026-2031).
Rising policy certainty, concessional climate finance, and rapid declines in technology costs are steering the transition away from diesel backup and toward diversified renewable portfolios. Grid unreliability, which triggers frequent nationwide blackouts, makes distributed solar and wind solutions attractive to households and businesses seeking a dependable energy source. Utility-scale developers benefit from the 2023 Electricity Act, which decentralizes market oversight and allows states to define feed-in tariffs tailored to local resource endowments. Parallel reforms in tariff adjustment and foreign-exchange access are strengthening bankability for both domestic and international investors. Global strategic players are deepening local partnerships, while regional developers are scaling mini-grids and embedded generation to serve unserved rural clusters, reflecting widespread confidence in Nigeria’s decarbonization roadmap.
Key Report Takeaways
- By technology, hydropower led with 86.90% Nigeria's renewable energy market share in 2025, while wind installations are forecast to surge at a 87.24% CAGR between 2026-2031.
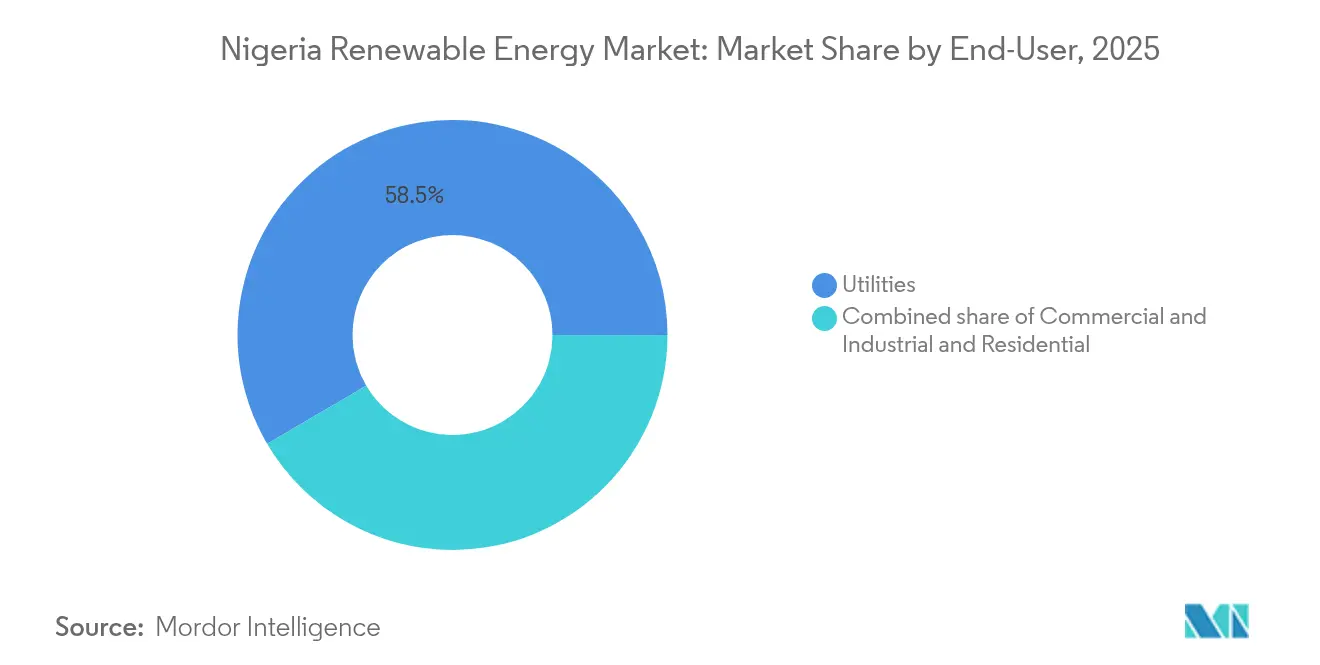
- By end-user, the utilities segment held 58.45% of the Nigeria renewable energy market size in 2025; commercial and industrial demand is projected to expand at a 30.1% CAGR to 2031.
Note: Market size and forecast figures in this report are generated using Mordor Intelligence’s proprietary estimation framework, updated with the latest available data and insights as of 2026.
Nigeria Renewable Energy Market Trends and Insights
Drivers Impact Analysis*
| Driver | (~) % Impact on CAGR Forecast | Geographic Relevance | Impact Timeline |
|---|---|---|---|
| Favourable government FIT & tax-holiday regime | 4.20% | National, with early gains in Lagos, Kano, Rivers | Medium term (2-4 years) |
| Rapid decline in solar-PV module prices | 6.10% | National, strongest in northern states | Short term (≤ 2 years) |
| Rural electrification mini-grid incentives | 3.80% | Rural areas, northern and middle-belt states | Medium term (2-4 years) |
| Corporate PPA demand from C&I customers | 5.30% | Lagos, Kano, Port Harcourt industrial corridors | Short term (≤ 2 years) |
| Climate-finance inflows via Nigeria ETM-PTF | 2.90% | National, priority to underserved regions | Long term (≥ 4 years) |
| Nigeria Energy Transition Plan 2060 targets | 3.40% | National, coordinated federal-state implementation | Long term (≥ 4 years) |
| Source: Mordor Intelligence | |||
Favourable Government FIT & Tax-Holiday Regime
Feed-in tariffs and seven-year tax holidays tilt project economics in favor of renewables, cutting levelized costs below those of diesel and gas when adjusted for foreign exchange risk. State-level FITs empower governors to attract industry, while Lagos’ 2024 electricity law halves average permitting time. Investors view the dual-layer incentive as an effective hedge against the high cost of capital, but tariff indexation to inflation and exchange rates remains essential for long-term certainty. Developers report faster financial close when power‐offtake agreements are paired with state guarantees. The sustainability of the FIT scheme depends on cost-reflective retail tariffs; however, current frameworks aim to shield low-income customers from sudden price hikes.
Rapid Decline in Solar-PV Module Prices
Global module prices fell near 15% per year through 2024, slashing Nigerian project capex and enabling grid-parity LCOEs in sun-rich northern Sahelian states.[1]Fraunhofer Institute, “PV Module Price Index 2025,” fraunhofer.de Diesel displacement economics are even stronger for C&I users, who face fuel costs above USD 0.30/kWh. Developers secure multi-year supply contracts to lock in low prices and blunt trade-policy risk. An extensive solar resource of 4.5-6.5 kWh/m²/day delivers capacity factors 40-60% higher than those of many EU sites, amplifying the cost benefits. Pay-as-you-go financing spreads adoption among small firms and households, shortening payback periods to three to five years.
Corporate PPA Demand from C&I Customers
Manufacturers in Lagos, Kano, and Port Harcourt procure power directly from on-site renewables to avoid grid outages and volatile diesel prices. Typical PPAs span 20 years at fixed tariffs below USD 0.15/kWh, ensuring cost predictability. Global firms satisfy sustainability mandates, while local exporters leverage reliable electricity as a competitive edge. NERC’s updated mini-grid rules allow third-party producers to interconnect multiple factories, improving scale. Banks expand green-loan products, attracted by stable corporate cash flows and ESG targets.
Rural Electrification Mini-Grid Incentives
Performance-based grants under the USD 750 million DARES program cover up-front capital gaps, making mini-grids viable in low-income communities. Hybrid solar-battery systems typically serve 100-1,000 connections, with tariffs tiered for productive-use loads, such as milling or refrigeration. Subsidies for basic consumption promote affordability, while private operators achieve collection rates of 85-95% through mobile payments. Standardized designs and bulk procurement lower hardware costs. Community equity stakes improve social acceptance and reduce vandalism risk.
Restraints Impact Analysis*
| Restraint | (~) % Impact on CAGR Forecast | Geographic Relevance | Impact Timeline |
|---|---|---|---|
| Grid instability & high T&D losses | -3.70% | National, acute in northern distribution networks | Short term (≤ 2 years) |
| FX shortages & import duties on RE equipment | -4.10% | National, equipment-dependent projects | Medium term (2-4 years) |
| Land-acquisition & community conflicts | -2.30% | Rural areas, customary land tenure regions | Medium term (2-4 years) |
| Policy discontinuity during election cycles | -1.90% | National, federal and state policy coordination | Short term (≤ 2 years) |
| Source: Mordor Intelligence | |||
Grid Instability & High T&D Losses
Technical losses above 20% and recurring system collapses undermine confidence in utility-scale rollouts. Payment shortfalls resulted in only 21% of wholesale invoices being settled in 2024, straining developer cash flows. Industrial customers are pivoting to self-generation, indirectly stimulating the Nigerian renewable energy market. National grid modernization aims to deploy SCADA and automate switching, yet most upgrades are slated for completion after 2027. Battery storage co-located with renewables now provides lucrative ancillary-service revenues that partly offset curtailment risk.
FX Shortages & Import Duties on Renewable-Energy Equipment
Dual exchange-rate windows and import duties of 10-35% can raise equipment costs by more than 20% relative to regional averages.[2]Bizcommunity, “Currency Crunch Hits Nigerian Energy Projects,” bizcommunity.com Delays in dollar allocation elongate construction schedules and inflate interest expenses. Local-content rules demand partial onshore assembly, though domestic capacity is limited. Developers often resort to offshore escrow accounts and syndicated hedge instruments to lock in foreign exchange rates. Bulk procurement by state agencies offers modest relief but remains insufficient for gigawatt-scale projects.
*Our forecasts treat driver/restraint impacts as directional, not additive. The impact forecasts reflect baseline growth, mix effects, and variable interactions.
Segment Analysis
By Technology: Hydro Dominance Faces Wind Disruption
Hydropower's 86.90% share of Nigeria's renewable energy market in 2025 is largely attributed to legacy dams, such as the 700 MW Zungeru complex. The share will decline as wind capacity accelerates at a 87.24% CAGR on favorable northern wind corridors with ≥35% capacity factors. Investors perceive lower siting risks for wind energy relative to large dams, spurring state-backed power purchase agreements. Solar adoption intensifies in the commercial and industrial (C&I) space, where daytime load profiles align with output, reducing diesel runtime. Bioenergy utilizes abundant crop residues from middle-belt farms, supplying captive power to agro-processing mills. Geothermal prospects around the Jos Plateau await a detailed appraisal; initial studies have highlighted 74 MW of recoverable heat, but commercial exploitation hinges on drilling incentives.
Capacity additions point to a diversified generation mix that enhances resilience. Wind developers prioritize community equity stakes to mitigate land disputes. Utility-scale solar gains traction due to 2024 duty exemptions on inverters and batteries. Bioenergy projects align with circular economy goals by monetizing agricultural waste, while nascent ocean energy pilots monitor wave regimes along the 853 km coastline. The evolution of the technology mix, therefore, hinges on proven bankability and established supply chains, rather than resource scarcity.




By End-User: C&I Segment Drives Market Evolution
The utilities segment accounted for 58.45% of the Nigeria renewable energy market size in 2025, but liquidity challenges and load shedding erode its dominance. Manufacturing plants now sign hybrid PPA packages that pair 1-20 MW solar arrays with battery storage, resulting in electricity cost savings of 20-30%. Distribution companies must procure 10% of their embedded generation, half of which must come from renewables, under a 2024 NERC directive that reshapes sales strategies.
Growth in the C&I segment raises installation quality standards and elevates after-sales services. Banks bundle equipment finance with FX hedges, widening access for mid-tier firms. Residential uptake clusters in urban centers where rooftop solar offsets blackouts, aided by mobile-money pay-as-you-go models. Utilities debate whether to compete or collaborate with distributed solutions; some pilot revenue-sharing arrangements with independent power producers that inject surplus energy into the feeders. Regulatory clarity around wheeling charges and PPA enforcement remains crucial for sustained market confidence.
Geography Analysis
Northern states, from Kano to Maiduguri, attract the most utility-scale wind and solar projects due to their superior irradiation of 5.5-6.5 kWh/m²/day and open land banks. Transmission corridors such as the 330 kV backbone simplify evacuation, while governor-led FITs accelerate site acquisition. Lagos leverages its 2024 electricity law to streamline distributed generation licensing, making the commercial capital a hub for commercial and industrial (C&I) installations with three- to five-year paybacks. Local banks co-finance projects to expand their ESG loan portfolios.
Middle-belt states like Plateau, Benue, and Nasarawa combine mid-range solar resource with plentiful agricultural residues, nurturing a cluster of bioenergy mini-grids that power rice and cassava mills. International donors subsidize last-mile connections, boosting rural productivity. Niger Delta states, Rivers, Delta, and Akwa Ibom, integrate renewable systems into petrochemical complexes and export terminals, lowering operational carbon footprints and capturing flare-gas credits.
Cross-border trade under the West African Power Pool enables Nigerian surplus renewable energy to reach Niger and Benin when grid upgrades are mature. State-level incentives create a mosaic of regulations, compelling developers to navigate different permitting timelines. Investor sentiment remains strongest where state energy boards issue clear interconnection guidelines and offer land banking support.
Regulatory Landscape
Nigeria's renewable power regulation is anchored by the Electricity Act 2023, which decentralizes market oversight by enabling states to regulate and license electricity activities within their territories, while the Nigerian Electricity Regulatory Commission (NERC) retains authority over interstate trading, grid coordination, and market-wide rules. This dual-layer framework underpins state-led instruments such as feed-in tariffs and streamlined permitting (including state electricity laws such as Lagos' 2024 framework referenced in the report context), shaping where utility-scale and distributed renewable projects can reach bankability faster.
In 2026, NERC updated key rules for distributed renewables, including the Mini-Grid Regulations 2026 (covering isolated mini-grids up to 5 MW and interconnected mini-grids up to 10 MW) and Net Billing Regulations 2026, which set a standardized credit-based approach for eligible distributed generators to export surplus energy into distribution networks. In parallel, NERC, the Standards Organisation of Nigeria (SON), and the Renewable Energy Association of Nigeria (REAN) have been strengthening collaboration on standards and quality control for imported solar products, reinforcing compliance expectations across developers, EPCs, and equipment suppliers.
Competitive Landscape
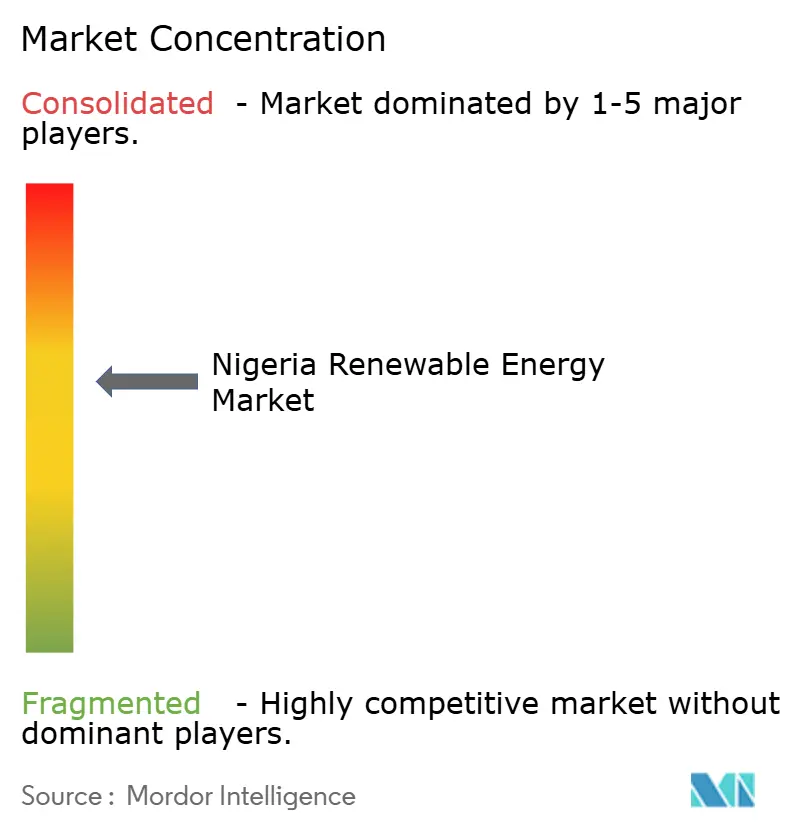
The Nigerian renewable energy market remains moderately fragmented, as global majors, regional independents, and state-affiliated firms vie for market share. TotalEnergies, Engie, and Scatec leverage global portfolios to secure long-tenor debt from DFIs, while local champions Daystar Power and Starsight Energy win C&I clients through fast deployment and operational flexibility.[4]OGPE Africa, “Top 20 Renewable IPPs in Nigeria 2025,” ogpeafrica.com North South Power Company maintains a strong hydro base and diversifies into wind.
Competitive intensity pushes EPC margins down, favoring vertically integrated players that spread risk across development, construction, and O&M. Equipment suppliers such as JinkoSolar and Siemens Energy battle price compression from Chinese rivals. NERC’s embedded generation regime encourages new service models, energy-as-a-service, storage-as-a-service, and OPEX-based solar leasing, allowing entrants to differentiate on financing rather than hardware.
Project pipelines are increasingly bundling storage for grid ancillary services, creating whitespace for battery integrators. Community mini-grid developers consolidate their portfolios to reach scale thresholds that are attractive to private-equity funds. Joint ventures between Nigerian states and foreign IPPs emerge to pool land, permits, and capital, reducing unilateral project risk. As execution track records lengthen, consolidation is expected via mergers and strategic alliances that reward operational excellence.
Nigeria Renewable Energy Industry Leaders
North South Power Co. Ltd
Mainstream Energy Solutions Ltd
Starsight Energy
TotalEnergies SE
Engie SA
- *Disclaimer: Major Players sorted in no particular order

Market Opportunities and Future Outlook
Distributed generation and behind-the-meter systems present clear whitespace in Nigeria where reliability-driven demand aligns with enabling rules and programs. The Net Billing Regulations 2026 create a defined route for eligible customers with renewable installations from 50 kWp to 5 MWp to export surplus electricity for credit on distribution networks, supporting commercial and industrial and high-consumption residential prosumers that already use solar plus storage to displace diesel. The mini-grid segment is also being pulled forward by active public programs, including the DARES initiative (USD 750 million) designed to scale decentralized access, which supports private mini-grid developers and their EPC, metering, and O&M ecosystems.
Local supply-chain buildout is emerging as a second opportunity area because FX constraints and import duties remain material project frictions in the report context. NASENI and the Rural Electrification Agency (REA) have signed an MoU to promote renewable energy deployment with a focus on local manufacturing of PV modules, inverters, and storage batteries, and REA-linked manufacturing partnership activity has also been announced around a 1 GW solar module facility. On the utility side, refurbishment and expansion of existing hydro assets provides near-term capacity and grid support, highlighted by Mainstream Energy Solutions' ongoing 220 MW expansion at Kainji, which also points to demand for turbine upgrades, balance-of-plant works, and transmission substation interfaces alongside variable renewables and storage deployments.
Recent Industry Developments
- July 2026: Rural Electrification Agency (REA) unveils 23 solar mini-grid projects across rural communities in Nigeria, providing electricity to approximately 50,000 people and 20,000 households. The rollout expands distributed generation capacity in rural areas, boosting off-grid market activity and investor interest. The initiative broadens REA's deployment footprint and strengthens local access to reliable power through rapid mini-grid expansion.
- July 2026: Rural Electrification Agency (REA) commences development of 42 renewable energy projects in Kebbi and Adamawa States, including 39 mini-grid projects in Adamawa and a 3.5MW solar project in Kebbi under the Distributed Access through Renewable Energy Scale-up (DARES) programme. The program adds substantial new capacity for rural electrification and diversifies the energy mix with utility-like mini-grids in multiple states. This accelerates distributed energy deployment and reinforces programme governance for scale-up investments.
- July 2026: Rural Electrification Agency (REA) performs groundbreaking on four solar hybrid mini-grid projects in Rivers State with a combined capacity of 11.9MWp under the DARES programme. The projects advance hybrid solar solutions that blend generation with storage to improve reliability and resilience in rural communities. This milestone strengthens the DARES portfolio and demonstrates a scalable model for rapid rural electrification.


Research Methodology Framework and Report Scope
Market Definition and Coverage
This market covers renewable electricity capacity in Nigeria and is measured as installed capacity added and available, expressed in gigawatts across key renewable power technologies serving grid and behind-the-meter demand.
Scope exclusions: We exclude conventional thermal generation, transmission and distribution network spend, and purely fossil-based captive power assets even if they sit inside industrial sites.
Segmentation Overview
- By Technology
- Solar Energy (PV and CSP)
- Wind Energy (Onshore and Offshore)
- Hydropower (Small, Large, PSH)
- Bioenergy
- Geothermal
- Ocean Energy (Tidal and Wave)
- By End-User
- Utilities
- Commercial and Industrial
- Residential
Data Sources, Market Sizing, and Validation
Desk Research
Desk research was used to set the factual backbone of the model, especially for the installed base, the project pipeline, and Nigeria-specific operating context. We relied on public sources such as IRENA capacity statistics, World Bank and IMF macro series for inflation and exchange rates, the International Energy Agency for energy balances where relevant, and national policy and market documents published by the Federal Ministry of Power and the Nigerian Electricity Regulatory Commission.
To keep assumptions realistic, we also reviewed sources like project tender notices, developer press releases, reputable media coverage, and company filings or investor materials when they were available in the public domain. Select paid subscriptions for company financials and intelligence, import and export shipment visibility, and patent databases were used selectively to fill gaps around supplier activity and technology direction. The sources listed here are illustrative only, and many other references were used to collect, cross-check, and clarify data points during the work.
Primary Interviews and Surveys
Interviews and surveys in Nigeria cover developers, distributors, utilities, financiers, and industrial or residential users. Respondents help test additions, system sizes, commissioning delays, replacement demand, and assumptions from desk research. Responses are triangulated, and experts are re-contacted when evidence conflicts. This process helps address gaps in small distributed assets.
Distribution of primary research fieldwork respondents
| Company type | Respondent position |
|---|---|
| Top tier: 28% | CXOs: 20% |
| Mid tier: 47% | Functional/Unit leaders: 27% |
| Smaller Players: 25% | Managers: 53% |
Market-Sizing & Forecasting
The sizing is built mainly through a top-down reconstruction of Nigeria renewable capacity by technology, where publicly reported installed capacity and announced additions are converted into a consistent annual capacity view. After that, results are checked using selective bottom-up approximations, such as rolling up a sample of project additions by type and applying typical size and timing patterns gathered from channel checks.
Key model inputs include historical installed capacity by technology, the live project pipeline and its expected commissioning dates, grid connection readiness, policy and tariff signals that affect bankability, and equipment availability indicators tied to import flows for major components. Capacity factor assumptions were handled carefully because they change the link between nameplate capacity and real-world output, which then impacts how much new capacity is needed to meet demand. Where project-level information was incomplete, we used ranges for size and timing and then narrowed them using interview feedback and observed execution trends.
Forecasting was done using scenario analysis supported by the most repeated variables raised in expert discussions, including financing conditions, permitting speed, and grid evacuation constraints. A central case was used for the published numbers, and the final curve was adjusted only after the scenario outcomes matched practical build rates seen in similar Nigerian project types.
Data Validation & Update Cycle
Checks were applied at multiple steps so the final totals do not depend on a single dataset or one assumption. We compared outputs against independent signals like year-on-year capacity change patterns, known commissioning milestones, and consistency between pipeline claims and observed procurement activity, and then outliers were reviewed before sign-off.
The model is reviewed internally across analysts, with re-contact triggers used when a major project slips, a policy shift changes incentives, or grid constraints tighten in a way that moves expected additions. Reports are refreshed annually, and interim updates are made when material events occur. Before delivery, a final pass is completed so clients receive the latest updated view based on the most recent information available.
Mordor Intelligence's Nigeria Renewable Energy Market Estimate Compared With Other Published Estimates
Published market sizes can look far apart even when they talk about the same country, because the unit of measurement and the boundary of what is counted can change quietly. In Nigeria renewable energy, the gap is often driven by whether figures are reported in gigawatts of installed capacity versus revenue, whether announced projects are treated as built, and how distributed systems are handled.
Grid-connected capacity statistics, renewable project commissioning records, and pipeline-to-completion checks are the evidence points that keep Mordor Intelligence aligned to capacity additions that are likely to be operational, rather than counting early announcements as installed capacity. Differences also come from base year selection, the way capacity retirements and rehabilitation are treated for hydro assets, and how currency timing is used when a publisher converts local project cost into a value number.
Benchmark comparison
| Source | Market Size | Gaps in Research Methodology |
|---|---|---|
| Mordor Intelligence | USD 0.00 B (2025) | |
| Industry Association A | USD 0.00 B (2024) | Uses capacity-linked revenue proxies and blends electricity generation and equipment value, which can inflate the total compared with a pure installed capacity accounting. |
| Regional Consultancy B | USD 0.00 B (2026) | Treats announced and licensed projects as commissioned in the forecast start year and applies optimistic commissioning timing, which tends to pull future capacity forward. |
The spread across sources becomes easier to explain once you separate capacity from value and then apply consistent rules on what counts as operational. Our approach stays traceable because each technology total can be followed back to installed base, expected additions, and a practical completion filter that can be repeated when new projects are announced or delayed.


Key Questions Answered in the Report
What is the projected capacity of the Nigeria renewable energy market by 2031?
The total installed capacity is forecast to reach 14.07 GW by 2031, supported by a 25.58% CAGR during 2026-2031.
Which segment will grow fastest within Nigeria's renewables mix?
Wind energy is expected to post the quickest expansion with a 87.24% CAGR through 2031.
Why are commercial and industrial consumers adopting on-site renewables in Nigeria?
They aim to avoid grid outages and cut electricity costs, achieving savings of 20-30% versus diesel self-generation.
How do feed-in tariffs support investment in Nigerian renewables?
FITs, together with seven-year tax holidays, reduce levelized costs and improve bankability for both utility-scale and distributed projects.
What key risk slows large renewable projects in Nigeria?
Foreign-exchange shortages and import duties can raise capex by more than 20% and delay equipment delivery.
Which policy underpins universal electricity access by 2031?
The National Integrated Electricity Policy and Strategic Implementation Plan, issued in February 2025, charts distributed renewable deployment toward full access.
Page last updated on:




