Market Overview
| Study Period | 2021 - 2031 |
|---|---|
| Forecast Data Period | 2026 - 2031 |
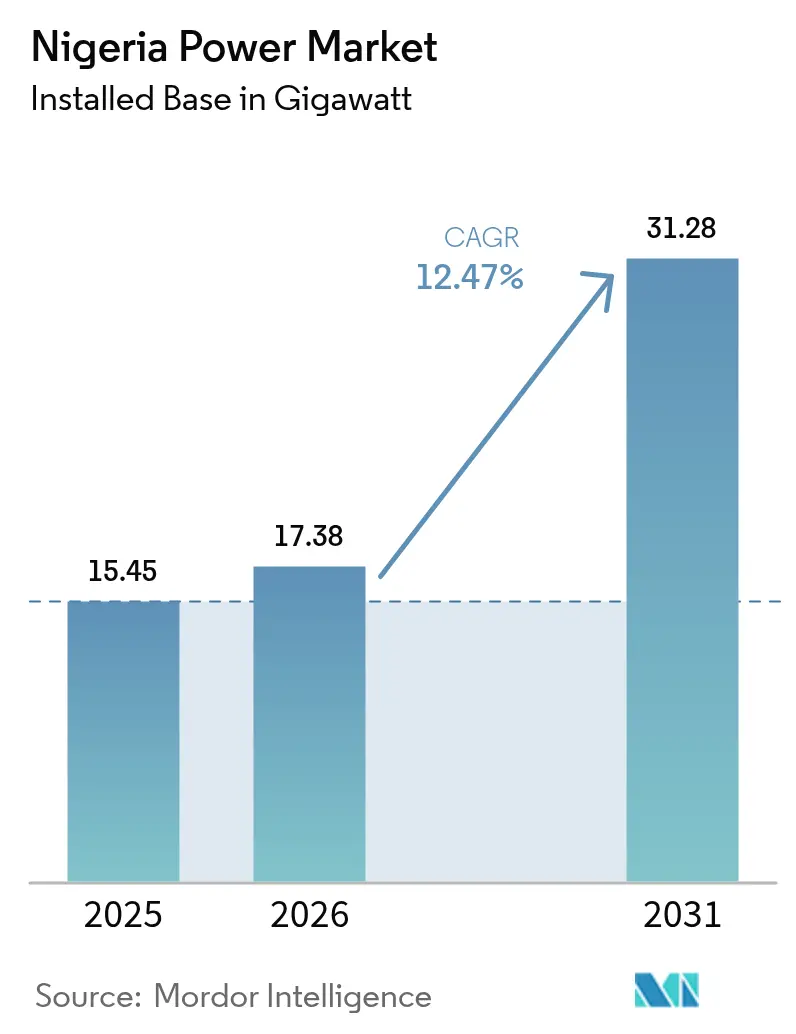
| Base Year Market Size (2025) | 15.45 gigawatt |
| Market Volume (2026) | 17.38 gigawatt |
| Market Volume (2031) | 31.28 gigawatt |
| Growth Rate (2026 - 2031) | 12.47% CAGR |
| Market Concentration | Medium |
Major Players *Disclaimer: Major Players sorted in no particular order Image © Mordor Intelligence. Reuse requires attribution under CC BY 4.0. | |
Nigeria Power Market Analysis by Mordor Intelligence
The Nigeria Power Market size is expected to grow from 15.45 gigawatt in 2025 to 17.38 gigawatt in 2026 and is forecast to reach 31.28 gigawatt by 2031 at 12.47% CAGR over 2026-2031.
The expansion reflects renewed policy momentum behind the federal 30-30-30 roadmap, state-level licensing reforms, and accelerating investment in both utility-scale and distributed assets. Thermal capacity still dominates because abundant domestic gas keeps generation costs below diesel, yet solar, wind, and hydro projects are scaling quickly as foreign investment, concessional finance, and pay-as-you-go business models close long-standing affordability gaps. Liquidity constraints, high technical and commercial losses, and currency depreciation remain clear hurdles, but targeted subsidies, smart-meter rollouts, and a foreign-exchange hedging window are beginning to improve cost recovery. Infrastructure vandalism continues to curb wheeling capacity, prompting utilities to deploy community engagement programs and round-the-clock surveillance. At the same time, private developers are concentrating on embedded and state-licensed projects that avoid the stressed national grid, ensuring that fresh capacity additions feed directly into bankable offtake arrangements. The convergence of these supply-side and regulatory shifts sets the stage for a deeper and more diverse Nigeria power market over the next five years.[1]Federal Ministry of Power, “Nigeria Electrification Roadmap,” power.gov.ng
Key Report Takeaways
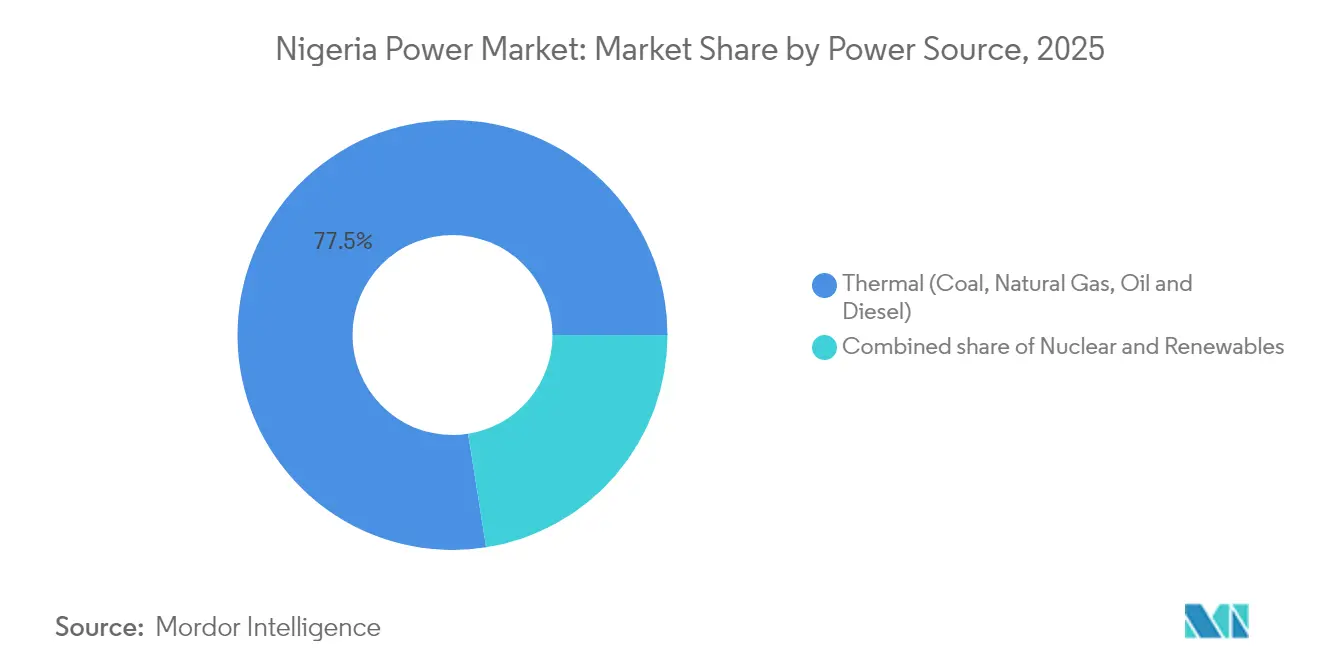
- By power source, thermal generation held 77.50% of the Nigeria power market share in 2025, while renewables are projected to advance at a 25.02% CAGR through 2031.
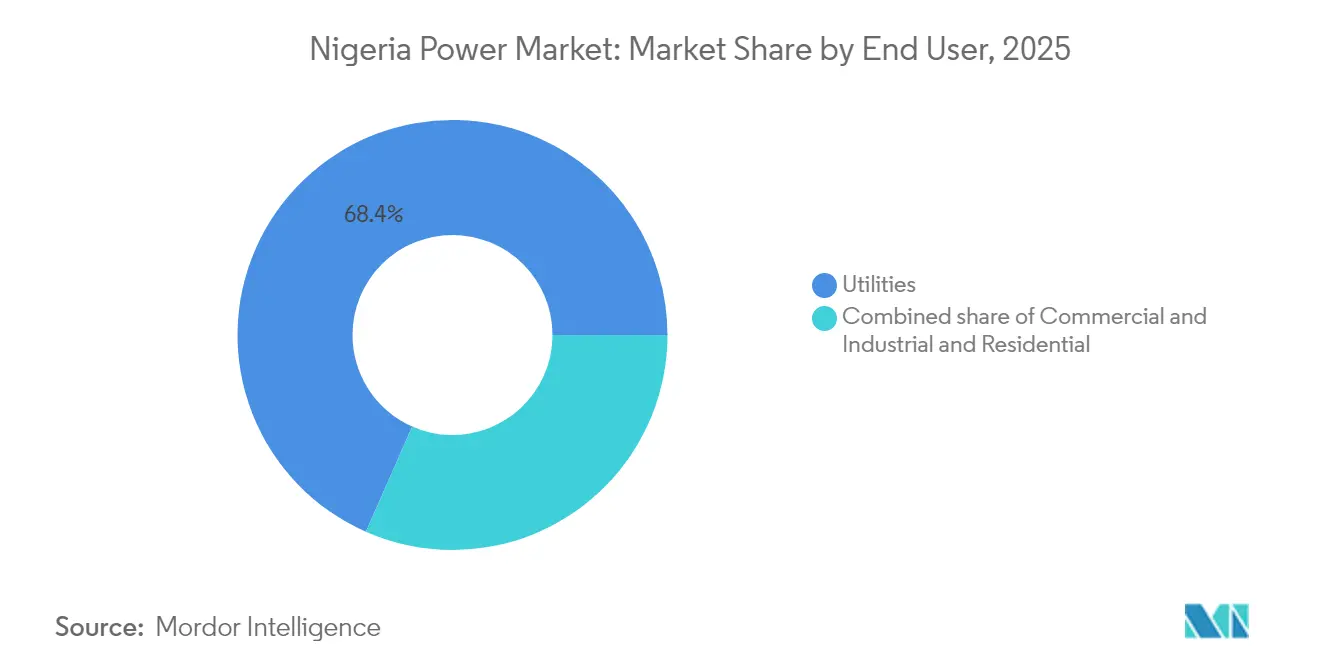
- By end user, utilities accounted for 68.40% of the Nigeria power market size in 2025, whereas commercial and industrial demand is forecast to expand at a 16.82% CAGR to 2031.
Note: Market size and forecast figures in this report are generated using Mordor Intelligence’s proprietary estimation framework, updated with the latest available data and insights as of 2026.
Nigeria Power Market Trends and Insights
Drivers Impact Analysis*
| Driver | (~) % Impact on CAGR Forecast | Geographic Relevance | Impact Timeline |
|---|---|---|---|
| Rising electricity demand from population and GDP growth | 2.50% | National with urban concentration in Lagos, Kano, Port Harcourt | Medium term (2-4 years) |
| Federal roadmap to 30 GW by 2030 with 30% renewables | 3.00% | National, renewable gains in northern solar belt and southern hydro corridors | Long term (≥ 4 years) |
| Gas-to-power dominance supported by abundant proven reserves | 2.00% | National, pipeline infrastructure in Niger Delta and southwest | Medium term (2-4 years) |
| Electrification of off-grid telecom towers and MSMEs | 1.30% | National, rural and peri-urban areas with weak grid penetration | Short term (≤ 2 years) |
| OEM-led pay-as-you-go solar home systems scale-up | 1.00% | Northern states and rural southeast | Short term (≤ 2 years) |
| State-level regulatory devolution boosting sub-national IPP pipelines | 1.70% | Lagos, Rivers, Kano states | Medium term (2-4 years) |
| Source: Mordor Intelligence | |||
Rising Electricity Demand From Population and GDP Growth
Nigeria’s population passed 223 million in 2024 and continues to grow at 2.5% each year, while GDP returned to 3.3% growth in the second quarter of 2024.[2]National Bureau of Statistics, “Population Projection 2024,” nbs.gov.ng Rapid urbanization is clustering demand in Lagos, Kano, and Port Harcourt, where newly built estates and industrial parks seek a 24-hour supply that the national grid cannot yet guarantee. Only 55% of households had grid access in mid-2024, leaving 100 million people reliant on diesel or stand-alone solar power. Commercial and industrial consumption rose 8.2% year on year, outpacing the residential segment because manufacturers and telecom operators expanded on-site generation to escape outages that averaged 18 hours per week. The World Bank calculates that unreliable electricity costs businesses 5.2% of national GDP, reinforcing the business case for both captive plants and battery storage solutions.
Federal Roadmap to 30 GW by 2030 With 30% Renewables
The Ministry of Power’s 30-30-30 target has mobilized USD 2.1 billion in renewable commitments since 2024 and pushed regulators to approve 1,850 MW of utility-scale solar and wind in a single year. The Electricity Act of 2023 handed licensing power to states, enabling Lagos to publish a 4 GW private electricity framework that allows intra-state wheeling, bilateral contracts, and retail competition. The Rural Electrification Agency installed 850 solar mini-grids in 2024, lifting off-grid access for another 1.2 million people.[3]Rural Electrification Agency, “Mini-Grid Deployment Update 2024,” rea.gov.ng Grid modernization is progressing as the Transmission Company of Nigeria implements a USD 1.7 billion SCADA platform, now 60% complete, which will support real-time dispatch once fully operational. Combined, these initiatives underpin the most ambitious capacity build-out in West Africa.
Gas-to-Power Dominance Supported by Abundant Proven Reserves
Nigeria controls 209.5 trillion cubic feet of proven gas reserves, and 1.8 billion cubic feet per day already reach power plants through domestic pipelines.[4]Nigerian National Petroleum Corporation, “AKK Pipeline Progress Report,” nnpcgroup.com Completion of the 614-kilometer Ajaokuta-Kaduna-Kano line in 2025 will raise northern supply by another 2.2 billion cubic feet per day, allowing diesel generators to be retired from many industrial sites. Geregu Power has agreed with Siemens Energy on a 765 MW combined-cycle expansion that lifts plant efficiency to 52% and cuts gas use per megawatt-hour by 27%. Regulated gas prices at USD 2.50 per million British thermal units still suppress upstream investment, but ongoing tariff reviews signal gradual liberalization. As more efficient turbines come online, gas will remain the least-cost dispatch option even under carbon-pricing scenarios.
Electrification of Off-Grid Telecom Towers and MSMEs
Nigeria’s 35,000 telecom towers consumed 2.5 TWh of diesel-generated power in 2024, equal to 17% of total grid output. MTN and Airtel plan to retrofit 8,000 of those towers with solar-battery hybrids by 2026, a move that would displace 400 million liters of diesel each year and slash operating costs by 35%. Micro, small, and medium enterprises account for 48% of GDP but receive only 12% of grid electricity, paying USD 0.40 per kilowatt-hour for diesel compared with USD 0.14 on the grid’s highest tariff band. The Energizing Economies Initiative added 320 solar mini-grids to industrial clusters in 2024, offering 24-hour supply at tariffs below USD 0.25 per kilowatt-hour. Rising adoption of productive-use appliances such as grain mills and refrigeration units is lifting system sizes sold under pay-as-you-go contracts and unlocking new revenue streams for vendors.
Restraints Impact Analysis*
| Restraint | (~) % Impact on CAGR Forecast | Geographic Relevance | Impact Timeline |
|---|---|---|---|
| Chronic T&D losses exceeding 28% of output | -2.20% | National, highest in northern and southeastern franchises | Medium term (2-4 years) |
| Liquidity crunch with NGN 4 trillion GENCO / DISCO receivables | -1.70% | National, concentrated in Abuja, Kano, Kaduna, Benin zones | Short term (≤ 2 years) |
| Vandalism of gas and transmission assets | -1.00% | Niger Delta pipelines and northern corridors | Short term (≤ 2 years) |
| FX volatility inflating imported equipment costs | -1.30% | Nationwide for all developers and utilities | Medium term (2-4 years) |
| Source: Mordor Intelligence | |||
Chronic T&D Losses Exceeding 28% of Output
Aggregate technical, commercial, and collection losses reached 36.36% in the first quarter of 2024, forcing distribution firms to rely on NGN 450 billion in subsidies during the first half of the year. Two-thirds of distribution transformers have exceeded their 25-year design life, a key driver of technical losses. Only 42% of registered customers had functional meters by mid-2024, perpetuating estimated billing and weakening revenue collection. The World Bank’s USD 500 million Distribution Sector Recovery Program aims to cut losses to 28% by 2027 through 1.43 million smart meters and 4,800 transformer upgrades. Collection efficiency remains uneven, ranging from 78% in Ikeja Electric to 41% in Yola Electricity, underscoring the importance of advanced metering infrastructure and stricter enforcement.
Liquidity Crunch With NGN 4 Trillion GENCO / DISCO Receivables
By the end of 2024, power generators and distributors carried NGN 4 trillion in unpaid receivables, limiting their ability to buy fuel, service debt, and maintain networks. The Nigerian Bulk Electricity Trading Company owed GENCOs NGN 1.8 trillion, prompting several gas-fired plants to cut output below 50% due to fuel shortages. Distribution firms owed NGN 2.2 trillion back to the bulk trader, reflecting tariff shortfalls and low collection efficiency. Federal subsidies covered only 11% of the deficit during the first half of 2024, leaving the rest on company balance sheets. InfraCredit stepped in to refinance NGN 314 billion of distribution debt with 15-year local-currency bonds that lowered interest rates from 18% to 12%, creating a template for further balance-sheet repair.
*Our forecasts treat driver/restraint impacts as directional, not additive. The impact forecasts reflect baseline growth, mix effects, and variable interactions.
Segment Analysis
By Power Source: Gas Anchors Thermal Dominance While Solar Scales
Thermal technology supplied 77.50% of installed capacity in 2025, making it the backbone of the Nigeria power market. Natural gas plants contributed more than 90% of thermal generation thanks to abundant reserves, flexible operating profiles, and fuel prices held at USD 2.50 per million British thermal units. The Nigeria power market size for gas plants is poised to expand further when the Ajaokuta-Kaduna-Kano pipeline adds 2.2 billion cubic feet per day of feedstock in 2025. Geregu’s 765 MW combined-cycle upgrade will push plant efficiency to 52% and lower variable costs, a move likely to influence other operators that still run open-cycle turbines. Coal remains marginal, supplying only 3% of thermal output because compliance costs and community opposition deter expansion.
Renewable energy is on a sharp ascent with a 25.02% CAGR through 2031, positioning the segment as the fastest-growing part of the Nigeria power market. Solar capacity stood at 850 MW in 2024, split between 320 MW utility scale and 530 MW distributed systems, and licensing approvals issued in 2024 point to a near-term pipeline above 1.8 GW. Hydroelectric dams contributed 12% of generation but face dry-season volatility, making solar and wind particularly attractive for diversification. The Nigeria power market share held by renewables will rise once licensed wind projects in Plateau and Adamawa States come online, once rehabilitation raises capacity factors at Kainji and Jebba dams. Early-stage nuclear projects, if advanced, could claim 8% of capacity by 2030, but they are unlikely to influence dispatch until site preparation and financing milestones are cleared.


By End User: Commercial and Industrial Segment Outpaces Utilities
Utilities covered 68.40% of 2025 demand, confirming their role as the primary offtake class in the Nigeria power market. Distribution remains legally privatized yet operationally fragile because legacy losses, subsidy dependence, and vandalism still undermine service reliability. Residential customers accounted for 27.05% of demand, but their meter penetration was only 42% as of mid-2024, which constrains tariff collection and depresses cash flow. Smart-meter rollouts funded under the Distribution Sector Recovery Program aim to cut estimated billing from 58% to 30% by 2027, providing a clearer revenue base for utilities.
The commercial and industrial class consumed 4.31 TWh in 2025, and its demand will rise at a 16.82% CAGR through 2031, outpacing all other segments. Mobile network operators, data centers, and cement producers already run sizable captive plants to ensure 24-hour power. MTN and Airtel together plan to shift 8,000 towers to solar-battery hybrids by 2026, a move that will deepen the Nigeria power market size allocated to distributed assets. Dangote Cement’s 450 MW on-site portfolio further illustrates how large users bypass the grid to maintain production continuity. State-level frameworks such as Lagos’ private electricity market now allow large industrial buyers to contract directly with generators, a trend that will tilt additional megawatts away from the standard utility channel.
Geography Analysis
Gas-to-power infrastructure remains concentrated in the southwest and the Niger Delta, yet emerging pipelines will soon unlock latent demand in the north. Once the Ajaokuta-Kaduna-Kano line is commissioned, Kano and Kaduna are expected to receive an incremental 2.2 billion cubic feet per day, anchoring new capacity that will feed export-oriented agro-processing clusters. Separate trunk lines connecting to Sokoto and Katsina are in feasibility stages, signaling further geographic rebalancing.
Lagos State maintains the most sophisticated regulatory environment following its 2024 electricity law. Twelve independent power producer applications worth 1,850 MW are under review, a volume that asserts Lagos as the primary reform test bed. The framework permits intra-state wheeling and retail competition, allowing large consumers in Lekki, Apapa, and Ikeja industrial zones to secure dedicated supply from new gas and solar plants. Other coastal states, such as Rivers and Cross River, are drafting similar statutes, yet they must still complete tariff methodologies and interconnection codes before licenses can be issued.
Northern states carry the highest share of households without grid access, often below 40%, but they also receive the greatest share of World Bank and Rural Electrification Agency mini-grid subsidies. Kaduna, Kano, and Katsina hosted 420 of the 850 solar mini-grids installed in 2024, with system sizes skewing upward toward 150-watt kits to accommodate refrigeration and light manufacturing. Federal hydro assets at Kainji, Jebba, and Shiroro support base load for Abuja and surrounding states, but vandalism on transmission towers has curtailed wheeling capacity and necessitated community engagement programs to safeguard lines.
Competitive Landscape
The Nigeria power market shows moderate concentration because the leading five generators control 55% of available capacity, while eleven private distribution franchises each serve exclusive territories. Geregu, Transcorp, and Azura-Edo collectively contribute 2,200 MW of gas capacity and benefit from long-term supply contracts with Shell Nigeria Gas and the Nigerian Gas Marketing Company. Geregu’s combined-cycle upgrade with Siemens Energy will raise plant efficiency to 52%, widening its variable-cost advantage over open-cycle competitors and setting a new technical benchmark.
Azura-Edo remains the reference case for project finance after assembling USD 900 million in debt backed by World Bank and African Development Bank guarantees at sub-8% interest, an achievement that many new developers hope to replicate. Shell’s 2024 purchase of Daystar Power added a 3.3 GW pipeline of hybrid solar-grid projects aimed at commercial and industrial customers, giving the company a platform to monetize its domestic gas volumes without relying on the stressed transmission grid. At the distribution end, InfraCredit’s NGN 314 billion bond refinancing has bought franchises time to invest in smart meters and transformer upgrades, but performance-based regulation still ties their earnings to loss-reduction milestones.
Technology modernization is now the main competitive differentiator. The Transmission Company of Nigeria’s USD 1.7 billion SCADA rollout reached 60% completion in 2024 and is expected to cut dispatch inefficiencies once fully operational. Embedded generation guidelines released in 2024 allow commercial and industrial users to install up to 5 MW without the local disco’s consent, opening a pathway for solar and gas micro-grids that will chip away at utility revenue. As states adopt individual regulations and private wires, competitive dynamics will increasingly hinge on the ability to secure bankable offtake contracts, hedge currency risk, and protect physical assets from vandalism.
Nigeria Power Industry Leaders
Mainstream Energy Solutions Limited
Egbin Power Plc
Transcorp Power Ltd
Azura-Edo Power Ltd
Geregu Power Plc
- *Disclaimer: Major Players sorted in no particular order

Recent Industry Developments
- April 2025: The Nigeria Atomic Energy Commission signed a memorandum with Korea Hydro & Nuclear Power to advance nuclear development, targeting an 8% share of generation by 2030.
- July 2024: Nigerian Electricity Regulatory Commission increased Band A tariffs to NGN 209.5 per kilowatt-hour, improving cost recovery for 1.2 million premium customers.
- March 2024: Transcorp Power raised NGN 45 billion in an IPO to finance a 200 MW expansion at the Ughelli gas plant.
- March 2024: World Bank approved USD 500 million under the Distribution Sector Recovery Program to install 1.43 million smart meters and rehabilitate 4,800 transformers.


Nigeria Power Market Report Scope
Power generation is the generation of electricity through various primary sources such as coal, hydro, solar, thermal, etc. In utilities, it is a step prior to its delivery to its end users. Then, the process is followed by transmission and distribution. Under this, the power generated is distributed via high-voltage lines (transmission lines) and low-voltage lines (distribution lines) as per the end user's requirement.
The Nigerian power market is segmented By Power Source (Thermal (Coal, Natural Gas, Oil and Diesel), Nuclear, Renewables (Solar, Wind, Hydro, Geothermal, Biomass & Waste, Tidal), By End User (Utilities, Commercial and Industrial, Residential). For each segment, the market sizing and forecasts have been done based on revenue (USD).
By Power Source
| Thermal (Coal, Natural Gas, Oil and Diesel) |
| Nuclear |
| Renewables (Solar, Wind, Hydro, Geothermal, Biomass & Waste, Tidal) |
By End User
| Utilities |
| Commercial and Industrial |
| Residential |
By T&D Voltage Level (Qualitative Analysis only)
| High-Voltage Transmission (Above 230 kV) |
| Sub-Transmission (69 to 161 kV) |
| Medium-Voltage Distribution (13.2 to 34.5 kV) |
| Low-Voltage Distribution (Up to 1 kV) |
| By Power Source | Thermal (Coal, Natural Gas, Oil and Diesel) |
| Nuclear | |
| Renewables (Solar, Wind, Hydro, Geothermal, Biomass & Waste, Tidal) | |
| By End User | Utilities |
| Commercial and Industrial | |
| Residential | |
| By T&D Voltage Level (Qualitative Analysis only) | High-Voltage Transmission (Above 230 kV) |
| Sub-Transmission (69 to 161 kV) | |
| Medium-Voltage Distribution (13.2 to 34.5 kV) | |
| Low-Voltage Distribution (Up to 1 kV) |


Key Questions Answered in the Report
What is the current installed capacity of the Nigeria power market?
Total installed capacity reached 17.38 GW in 2026 and is projected to rise to 31.28 GW by 2031.
How fast is renewable energy growing in Nigeria?
Renewables are forecast to grow at a 25.02% CAGR through 2031, the quickest rate among all generation sources.
Why do many businesses in Nigeria rely on captive power?
Grid outages averaged 18 hours per week in 2024, prompting manufacturers, telecom operators, and data centers to install on-site gas or solar generation for reliable supply.
What impact will the Ajaokuta-Kaduna-Kano pipeline have on power generation?
Commissioning in 2025 will deliver 2.2 billion cubic feet of gas each day to northern plants, lowering fuel costs and displacing diesel generation.
How does the new Lagos State electricity law change market dynamics?
The 2024 law permits intra-state wheeling and retail competition, enabling large customers to buy power directly from independent producers without passing through a distribution company.
What are the key barriers to further growth of the Nigeria power market?
High technical and commercial losses, liquidity shortfalls amounting to NGN 4 trillion in receivables, asset vandalism, and foreign-exchange volatility continue to challenge developers and utilities.
Page last updated on:


