
Market Overview
| Study Period | 2021 - 2031 |
|---|---|
| Forecast Data Period | 2026 - 2031 |
| Base Year Market Size (2025) | 0.22 gigawatt |
| Market Volume (2026) | 0.3 gigawatt |
| Market Volume (2031) | 1.48 gigawatt |
| Growth Rate (2026 - 2031) | 37.42 % |
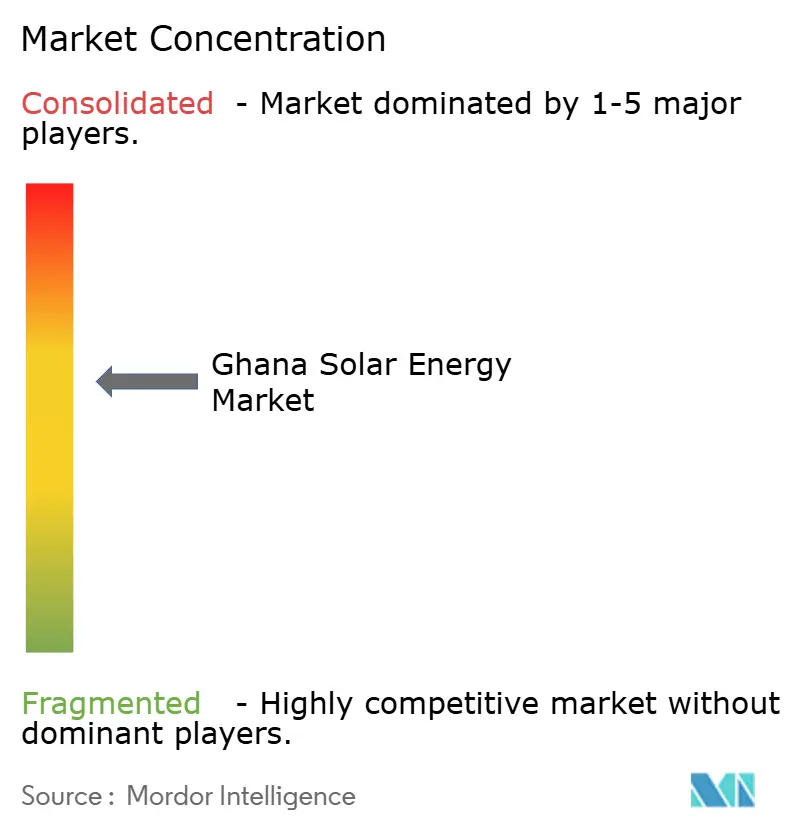
| Market Concentration | Medium |
Major Players *Disclaimer: Major Players sorted in no particular order Image © Mordor Intelligence. Reuse requires attribution under CC BY 4.0. | |
Ghana Solar Energy Market Analysis by Mordor Intelligence
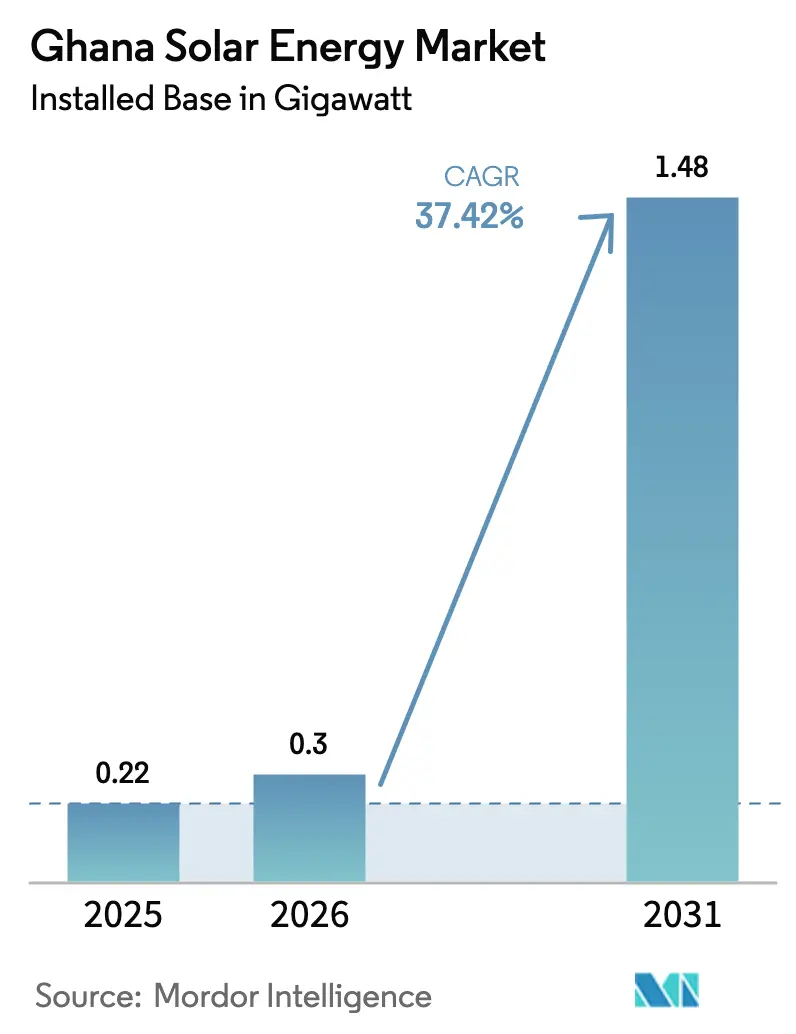
Ghana Solar Energy Market size in 2026 is estimated at 0.3 gigawatt, growing from 2025 value of 0.22 gigawatt with 2031 projections showing 1.48 gigawatt, growing at 37.42% CAGR over 2026-2031.
Falling photovoltaic (PV) module prices, a four-year government target to add 2 GW of new solar capacity, and expanded access to concessional finance have collectively pushed solar levelized costs below thermal alternatives even without subsidies.(1)International Finance Corporation, “Dawa Solar Project Disclosure,” ifc.orgUtility-scale developers benefit from duty and value-added-tax waivers on imported equipment, while commercial-industrial (C&I) customers are accelerating adoption to hedge against frequent grid outages and rising tariffs. Off-grid solutions, mini-grids, and solar-home systems are advancing fastest as rural electrification agencies target the remaining 11% of households without grid access. Execution risks, however, persist around grid-absorption limits, cedi depreciation, and a moratorium on new power-purchase agreements that favors well-capitalized sponsors with development-finance-institution backing.
Key Report Takeaways
- By technology, solar photovoltaic commanded 100.00% of the Ghana solar energy market share in 2025, and the segment is projected to sustain a 37.42% CAGR through 2031.
- By grid type, on-grid installations captured 72.10% of the Ghana solar energy market share in 2025, while off-grid systems are poised to grow at a 39.85% CAGR to 2031.
- By end-user, utility-scale plants accounted for 77.30% of the Ghana solar energy market size in 2025, whereas commercial-industrial arrays are advancing at a 39.24% CAGR through 2031.
Note: Market size and forecast figures in this report are generated using Mordor Intelligence’s proprietary estimation framework, updated with the latest available data and insights as of 2026.
Ghana Solar Energy Market Trends and Insights
Drivers Impact Analysis*
| Driver | (~) % Impact on CAGR Forecast | Geographic Relevance | Impact Timeline |
|---|---|---|---|
| Falling PV module prices and tax exemptions | +12.50% | National, with concentration in Greater Accra, Ashanti, and Northern regions | Short term (≤ 2 years) |
| Concessional financing from World Bank and IFC | +10.80% | National, prioritizing utility-scale projects in Bono East and Upper West | Medium term (2-4 years) |
| Rural electrification through mini-grids and solar home systems | +8.20% | Northern, Upper East, Upper West, and Volta Lake communities | Long term (≥ 4 years) |
| Source: Mordor Intelligence | |||
Falling PV Module Prices and Tax Exemptions
Global factory-gate module prices dropped to USD 0.10–0.12 per watt in 2024, down 60% from 2022 as Chinese oversupply hit export channels. Ghana’s Exemptions Act 2022 (Act 1083) keeps import duties at 0%–5%, cutting landed system costs 15%–20% compared with pre-2022 levels.(2)Ghana Revenue Authority, “Exemptions Act 2022,” gra.gov.ghLower capex has reduced payback periods for C&I rooftop arrays in Tema and Kumasi from seven to under five years. More than 100 IEC-aligned PV standards adopted by the Ghana Standards Authority in 2024 have shortened lender due diligence cycles, improving bankability. The upside is partially offset by a 14% year-to-date slide in the cedi that inflates local-currency equipment costs and highlights the importance of hedging and local-content strategies.
Concessional Financing from World Bank and IFC
Development-finance institutions committed over USD 400 million to Ghanaian solar deals between 2024 and early 2025, including a USD 130 million IFC facility for the 200 MW Dawa Solar Park and a USD 250 million World Bank energy-sector efficiency loan that bundles transmission upgrades. Interest rates are 300–500 basis points below domestic benchmarks of 28%–32%, lifting internal rates of return for utility-scale projects. AfDB’s USD 85 million Scaling-up Renewable Energy Program is underwriting 35 mini-grids and 12,000 net-metered systems, while AFD’s SUNREF Ghana line channels subordinated debt through local banks to broaden SME access. The Green Climate Fund injected USD 16.2 million into Ecobank’s Affirmative Solar Action Program for 10 MW of distributed installations on public facilities.(3)Green Climate Fund, “Affirmative Solar Action Program,” greenclimate.fund
Rural Electrification Through Mini-Grids and Solar-Home Systems
The 2025 national plan targets 35 solar mini-grids and 381 solar-powered public facilities to lift electrification from 89.03% to 90%. Mini-grid levelized costs have fallen to USD 0.38 per kWh, versus diesel costs of USD 0.55 per kWh in remote communities. Pay-as-you-go providers such as PEG Africa use mobile-money platforms and remote-shutoff functionality to reduce default risk and securitize receivables. AfDB financing covers 12,000 stand-alone systems, reflecting a hybrid rural strategy that pairs grid extension, mini-grids, and solar-home systems for capital efficiency. Persistent land-acquisition delays and the absence of a cost-reflective feed-in tariff still constrain private-sector participation.
Restraints Impact Analysis*
| Restraint | (~) % Impact on CAGR Forecast | Geographic Relevance | Impact Timeline |
|---|---|---|---|
| Grid congestion and limited transmission capacity | -5.30% | National, acute in Greater Accra and Ashanti regions | Medium term (2-4 years) |
| Cedi depreciation raising import costs | -4.10% | National, affecting all project developers | Short term (≤ 2 years) |
| Slow net-metering rollout | -3.20% | National, concentrated in urban and peri-urban distribution zones | Long term (≥ 4 years) |
| Source: Mordor Intelligence | |||
Grid Congestion and Limited Transmission Capacity
Electricity Company of Ghana (ECG) distribution losses stood at 30% in 2024, reflecting aging assets, theft, and undersized transformers. Transmission constraints in Ashanti and Northern regions force developers to cluster near coastal substations, elevating curtailment risk during off-peak demand. A 2024 moratorium on new power-purchase agreements, imposed to address USD 1.6 billion in payables, has frozen much of the utility-scale pipeline. Although the World Bank has allocated USD 80 million for grid upgrades, procurement delays may push commissioning into 2027. Net-metering rules adopted in 2023 allow export up to 1 MW, yet fewer than 500 systems had been certified by end-2024 owing to ECG’s limited metering capacity.
Cedi Depreciation Raising Import Costs
The cedi lost 14% against the U.S. dollar in the first 11 months of 2024 after a 20.6% slide in 2023, lifting interbank rates from GHS 11.97 to GHS 13.90 per USD.(4)Bank of Ghana, “Interbank FX Rates,” bog.gov.gh Solar projects import up to 80% of their hardware, exposing them to exchange-rate swings that can erode 5%–10% of modeled returns when hedging tools are unavailable or costly. The IMF’s Extended Credit Facility caps non-concessional borrowing, reducing fiscal buffers that could otherwise backstop currency risk. Domestic loans priced at 28%–32% are uneconomic for 20-year solar assets, pushing developers toward dollar-denominated debt. Depreciation also inflates O&M outlays for inverter spares and tracker parts, underscoring the value of local assembly partnerships.
*Our forecasts treat driver/restraint impacts as directional, not additive. The impact forecasts reflect baseline growth, mix effects, and variable interactions.
Segment Analysis
By Technology: Photovoltaic Dominance Unchallenged
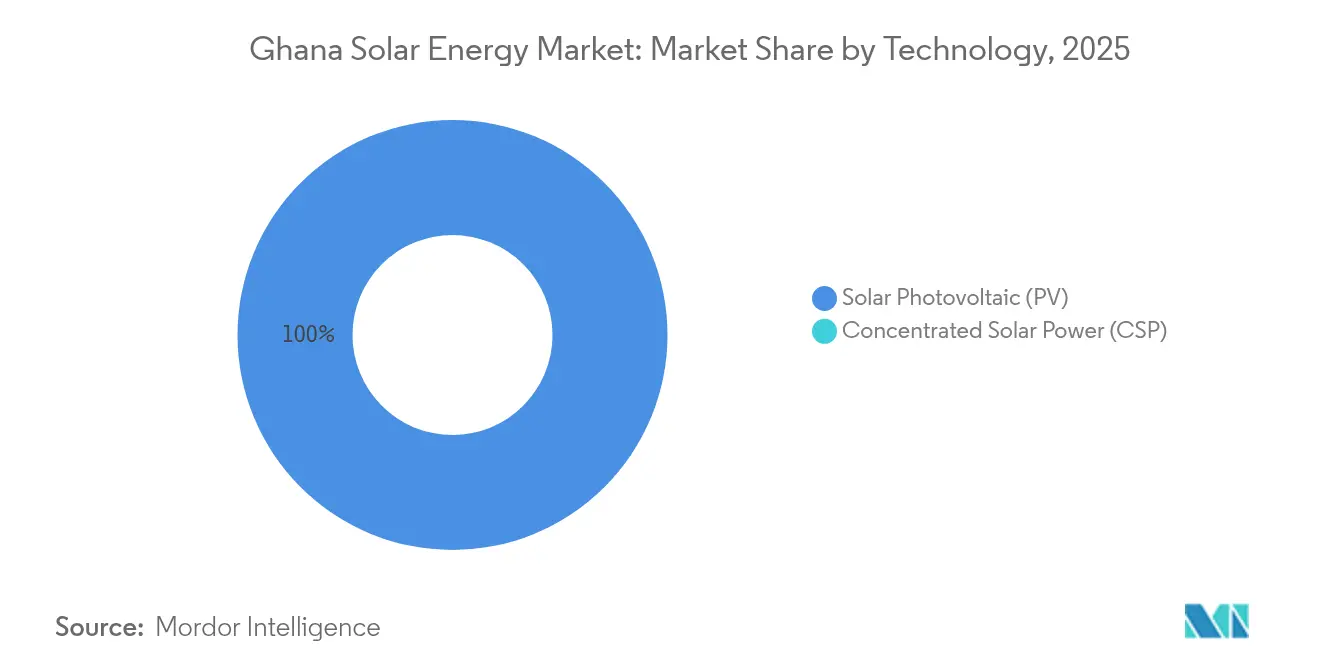
Solar PV retained 100.00% share of the Ghana solar energy market in 2025 and is projected to grow at a 37.42% CAGR to 2031. Crystalline-silicon modules, mainly monocrystalline PERC and TOPCon, accounted for more than 85% of procurement tenders, reflecting developer focus on higher efficiency and reduced land footprint. Concentrated Solar Power remains absent because Ghana’s direct-normal irradiance averages 4.5–5.5 kWh/m²/day, below the 6.0 threshold needed to justify tower or trough plants WORLDBANK.ORG. Bifacial modules, deployed at the Dawa Solar Park, raise yields 10%–15% but carry a 15%–20% price premium. Thin-film accounts for less than 5% of shipments, confined to building-integrated façades where aesthetics outweigh output.
Inverters show a split between string units for C&I rooftops and central units for utility-scale fields. Hybrid inverters with battery-management systems are gaining traction in off-grid and mini-grid schemes. Single-axis trackers can add 15%–20% energy but cost 25%–30% more than fixed-tilt racking, limiting adoption to large projects. Legislative Instrument 2449 sets minimum module efficiencies at 16% for monocrystalline and 15% for polycrystalline panels, filtering out sub-standard imports and aligning local installations with global Tier-1 quality benchmarks.



By Grid Type: Off-Grid Acceleration Outpaces On-Grid Base
On-grid installations controlled 72.10% of the Ghana solar energy market share in 2025, led by PPAs with ECG and captive C&I arrays that export surplus under net-metering guidelines. Off-grid capacity, however, is growing at a 39.85% CAGR on the back of mini-grids around Volta Lake and PAYG solar-home systems in the Northern belt. The AfDB-funded 35 mini-grids supply 24-hour electricity at USD 0.38 per kWh, cutting diesel costs nearly in half. PAYG providers peg daily repayments to mobile-money micro-transactions that align with rural income flows and reduce collection risk.
On-grid expansion is hampered by ECG’s losses and the PPA freeze. Net-metered exports remain limited because ECG lacks bidirectional meters and automated billing. Off-grid developers confront tariff-setting uncertainty, but hybrid mini-grids that mix solar, batteries, and diesel offer a balanced cost-reliability profile. The 2025 target for 35 new mini-grids and 381 solar-equipped public facilities marks a policy pivot to decentralized electrification, contingent on faster environmental permitting and land-lease approvals.
By End-User: Commercial-Industrial Surge Reshapes Demand
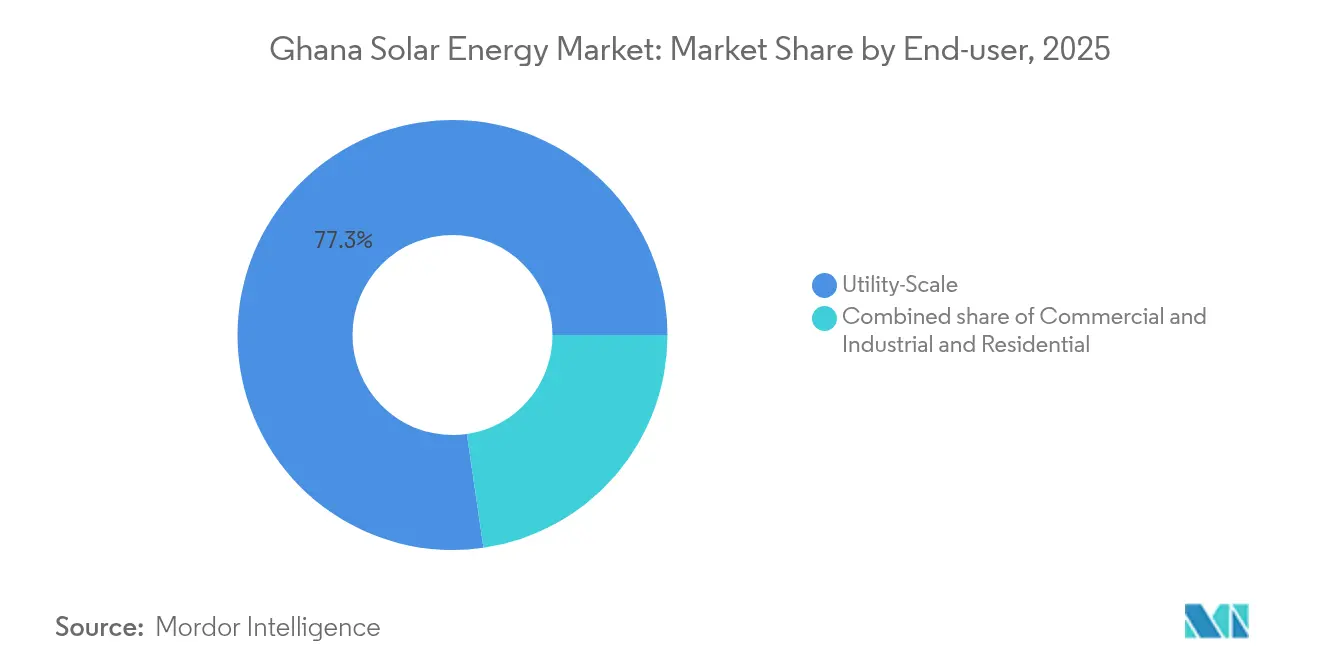
Utility-scale plants held 77.30% of installed capacity in 2025, anchored by Bui Power Authority’s 45 MW hybrid project and the 200 MW Dawa Solar Park. Yet C&I systems are expanding at 39.24% CAGR as mines, telecom towers, and food processors install behind-the-meter arrays to counter tariff inflation and brownouts. AngloGold Ashanti and Newmont plan 20% renewable penetration at Ghanaian mines by 2027, while MTN and Vodafone are retrofitting 3,000 cell towers with solar-battery hybrids. Daystar Power’s Solar-as-a-Service model has signed 27 MW of C&I contracts, proving that third-party ownership can unlock demand where balance-sheet constraints exist.
Residential uptake remains below 5% of capacity, constrained by high upfront costs and slow net-meter rollout. Utility-scale PPAs deliver USD 0.04–0.06 per kWh but carry off-taker risk due to ECG’s payables backlog. C&I payback periods of four to six years are acceptable because they eliminate diesel fuel at USD 0.30 per kWh. Africa’s largest rooftop array, a 10 MW system on a Tema logistics warehouse, illustrates how large roofs can bypass land scarcity. Residential growth should gain momentum post-2027 once consumer-finance products mature.
Geography Analysis
Greater Accra, Ashanti, and Bono East host roughly two-thirds of Ghana’s solar megawatts because they combine irradiance above 5 kWh/m²/day with proximity to load centers and substations. Greater Accra leads the Ghana solar energy market with the 200 MW Dawa Solar Park and C&I rooftops in the Tema industrial zone, where tariffs near GHS 1.20 per kWh (USD 0.09) make solar cost-competitive. Bono East is emerging as a floating-solar hub on the 400 km² Bui Reservoir, where Bui Power Authority plans to scale from 5 MW to 65 MW by 2027. Northern, Upper East, and Upper West regions, where grid access lags at 60%–70%, are earmarked for mini-grids under the 2025 rural-electrification plan.
Volta Lake islands benefit from AfDB-funded hybrids that replace gensets costing USD 0.55 per kWh. Coastal regions enjoy strong irradiance and existing transmission but face land constraints, steering developers toward rooftops and carports. Ashanti’s mining and light-manufacturing clusters drive C&I demand that offsets ECG outages. Participation in the West African Power Pool is currently limited to hydro and thermal exports, though future interconnector upgrades could facilitate renewable trading. Universal access will need an additional 500 MW of distributed solar by 2030, concentrated in the northern belt. The Renewable Energy Master Plan allocates 447.5 MW to utility-scale, 200 MW to distributed generation, and 20 MW to stand-alone systems across all 16 regions, favoring solar where it can displace diesel or defer costly grid extension.
Regulatory Landscape
Ghana’s solar sector is governed primarily by the Energy Commission (established under Act 541, 1997), which licenses renewable electricity activities and enforces technical requirements across the power value chain. The broader legal basis for renewable promotion sits under the Renewable Energy Act, 2011 (Act 832), which provides for licensing and mechanisms such as feed-in tariffs, while the Ministry of Energy’s national energy policy framework prioritizes distributed solar and off-grid applications as part of electrification and reliability objectives.
Product quality and market access are increasingly shaped by the Energy Commission’s 2022 regulations for renewable energy products, including the Renewable Energy (Standards and Labelling) (Solar Panels) Regulations, 2022 (L.I. 2449) and inverter-related requirements (L.I. 2461). The Energy Commission Net Metering Code 2023 caps individual net-metered renewable facilities at 500 kW per customer, which reinforces the current small-to-mid scale focus for behind-the-meter systems. A published enforcement roadmap allows compliant and legacy stock to operate side-by-side until July 2026, tightening procurement discipline for EPCs, distributors, and financiers while raising the premium on certified components and accredited installers.
Competitive Landscape
The Ghana solar energy market is moderately fragmented; no single firm controls more than 15% of installed capacity. State-owned Bui Power Authority leads utility-scale builds by leveraging sovereign guarantees and concessional finance, commissioning 45 MW in 2024 and planning 65 MW of floating PV by 2027. Tier-1 module suppliers Trina Solar, JinkoSolar, and REC Solar capture 80%–85% of tenders by meeting efficiency and safety rules under Legislative Instrument 2449. Local engineering-procurement-construction specialists such as Meinergy Ghana and SunPower Innovations partner with international OEMs to comply with rising local-content quotas.
Growth white spaces include: C&I PPAs for mines and telecom firms seeking tariff hedges, PAYG solar-home systems in northern districts, and hybrid mini-grids on Volta Lake islands. Daystar Power’s zero-capex model demonstrates the viability of third-party ownership for SMEs, while PEG Africa leverages mobile-money integration to scale PAYG portfolios. Technology differentiation around bifacial modules, trackers, and hybrid inverters remains capital-constrained because the market lacks performance-based incentives that reward higher yields.
Ghana Solar Energy Industry Leaders
Trina Solar Ltd
JinkoSolar Holdings Co. Ltd
SunPower Innovations
Translight Solar
Redavia Solar Power
- *Disclaimer: Major Players sorted in no particular order

Market Opportunities and Future Outlook
Near-term whitespace concentrates in distributed and hybrid configurations that reduce exposure to grid outages and distribution bottlenecks. The Energy Commission’s Net Metering Code 2023 (500 kW per customer cap) supports a more standardized path for C&I rooftop and carport deployments, while the broader policy direction emphasizes distributed solar, hybrid systems, and off-grid electrification, aligned with business continuity needs in industrial clusters such as Tema and Kumasi. Commercial platforms that bundle generation with storage and O&M under service or leasing models (including offerings marketed by Translight Solar and Redavia Solar Power) can broaden adoption among SMEs that face high cost of capital and prefer predictable monthly energy spending.
Off-grid and productive-use solar is also a visible opportunity area, supported by the national policy focus on rural electrification and decentralized supply in communities where grid extension is costly. Solar-powered agricultural processing and cold-chain applications provide a practical use case for reducing post-harvest losses, particularly when paired with hybrid systems that deliver firmness for motors and refrigeration. On the supply side, localization initiatives and large industrial-park projects indicate scope for deeper domestic assembly, QA/testing, and installer capacity building, alongside demand for IEC-aligned components that comply with Ghana’s solar-panel and inverter regulations.
Recent Industry Developments
- July 2026: Solex Energy Ltd proposed establishing a fully integrated solar manufacturing ecosystem in Ghana, including production lines for PV modules and inverters. The plan would bolster localized manufacturing capability and reduce import dependency, strengthening domestic component production and supply-chain security.
- June 2026: United Terra Enterprises PLC announced a definitive agreement to form a Ghana-based joint venture, United Terra TC Energy, to construct up to 500 MWp of solar PV and 500 MWp of ocean wave energy, supported by a 1-Gigawatt PPA with ECG. The initiative represents a large-scale utility and hybrid energy project that diversifies the energy mix and reinforces the state off-taker relationship.
- June 2026: Risen Energy signed a cooperation agreement to supply 70MW of its Hyper-ion series HJT modules for PV projects in Ghana, following a 40MW project connection in 2025. The arrangement provides MW-scale module supply for Ghana projects and strengthens supply chain resilience for 2026 to 2027.


Research Methodology Framework and Report Scope
Market Definition and Coverage
This market covers solar power additions and installed base in Ghana, tracked as capacity (GW) across grid-connected and off-grid systems used by utility, business, and household customers.
Scope exclusions: We exclude non-electric solar uses such as solar water heating and do not count purely diesel generator sales that are not paired with solar generation.
Segmentation Overview
- By Technology
- Solar Photovoltaic (PV)
- Concentrated Solar Power (CSP)
- By Grid Type
- On-Grid
- Off-Grid
- By End-User
- Utility-Scale
- Commercial and Industrial (C&I)
- Residential
- By Component (Qualitative Analysis)
- Solar Modules/Panels
- Inverters (String, Central, Micro)
- Mounting and Tracking Systems
- Balance-of-System and Electricals
- Energy Storage and Hybrid Integration
Data Sources, Market Sizing, and Validation
Desk Research
Desk research started with public energy statistics and power sector planning documents to understand how much solar is already connected, and how project pipelines are reported. Sources used include official publications such as the Energy Commission of Ghana energy statistics and planning outlooks, IRENA renewable capacity datasets, and grid and generation indicators from institutions such as the World Bank and the International Energy Agency (where Ghana series are available).
We also reviewed supporting evidence from sources such as utility and regulator announcements, procurement and tender notices, project press releases, and company filings and investor materials for capacity commissioning timelines. When needed, paid subscriptions were used only to speed up checks on company financials and news flow, plus patent and import-export shipment level signals for solar equipment movement. The desk research sources listed here are illustrative, and many other public documents and datasets were also consulted to collect data, validate assumptions, and clarify inconsistencies.
Primary Interviews and Surveys
Interviews and surveys with Ghana-based solar developers, installers, distributors, utilities, financiers, public agencies, and commercial users clarify capacity additions, commissioning dates, system prices, import lead times, financing conditions, and off-grid demand. Respondent input is used where secondary records do not show whether a project was commissioned, delayed, or still in development, and it informs the assumptions applied in the final model.
Distribution of primary research fieldwork respondents
| Company type | Respondent position |
|---|---|
| Top tier: 28% | CXOs: 14% |
| Mid tier: 52% | Functional/Unit leaders: 33% |
| Smaller Players: 20% | Managers: 53% |
Market-Sizing & Forecasting
Sizing is built using a top-down approach where Ghana power capacity and renewable capacity series are reconstructed by technology and grid connection, and then filtered into solar PV and related systems that are actually commissioned in the year. Those totals are corroborated through selective bottom-up approximations, such as rolling up tracked project capacities, distributor channel checks on typical system sizes, and sampled price-per-watt assumptions for key use cases to keep the market totals realistic.
Key inputs in the model include installed and dependable generation capacity trends, annual solar generation and grid penetration signals, utility-scale project commissioning schedules, C&I adoption drivers (tariffs, reliability needs, and payback expectations), and indicative module and inverter pricing movements that shift system sizing decisions. Where bottom-up evidence is incomplete for informal and small off-grid systems, gaps are handled through adoption rate assumptions that are reviewed with installers and adjusted against import and deployment signals.
Forecasting uses scenario analysis, because outcomes depend heavily on grid constraints, financing availability, and the timing of project energization. Assumptions are revised using expert consensus on pipeline conversion, expected permitting and land access timelines, and realistic execution capacity of the local delivery ecosystem.
Data Validation & Update Cycle
Outputs are checked in multiple steps so the final numbers align with independent signals, not just one dataset. We compare modeled capacity additions against official capacity series, project commissioning news, and demand-side indicators, and then investigate large year-to-year jumps before sign-off. Any major variance triggers a re-check of the pipeline list and a callback to primary contacts to confirm what changed.
The report is refreshed annually, and interim updates are made when material events occur, such as policy changes, large project delays, or major commissioning announcements. Before delivery, a final review pass is completed so clients receive an updated view using the latest available public statistics and validated market inputs.
Mordor Intelligence's Ghana Solar Energy Market Estimate Compared With Other Published Estimates
Published estimates for Ghana solar can look far apart because some sources measure different things, even when they use similar terms like market size. Differences usually come from whether the figure is a capacity view (MW or GW), an investment view (USD), or a blended view that mixes installed base with planned pipelines.
The largest gap drivers in Ghana are whether off-grid systems are included, how projects are counted before they are energized, and how replacement and repowering are treated in annual additions. Currency timing and price-per-watt assumptions also move USD conversions a lot, especially when imported equipment prices change quickly. In our sizing, the installed-capacity figures are only counted once commissioning is evidenced and separated by on-grid versus off-grid, which explains why the baseline differs from some pipeline-heavy totals, a modeling choice applied by Mordor Intelligence.
Benchmark comparison
| Source | Market Size | Gaps in Research Methodology |
|---|---|---|
| Mordor Intelligence | USD 0.22 B (2025) | |
| Industry Association A | USD 0.30 B (2025) | Often converts MW targets and announced projects into market size before commissioning, and may include broader off-grid devices and solar thermal counts that inflate the capacity-equivalent total. |
| Regional Consultancy B | USD 0.18 B (2025) | May focus mainly on utility-scale grid projects and use conservative execution and financing scenarios, which can undercount C&I rooftops and smaller decentralized deployments. |
The table shows that the spread is mostly created by what gets counted as delivered capacity versus what is still planned, and by whether decentralized installations are fully captured. A clear capacity-led model with explicit commissioning checks, consistent unit conversions, and repeated primary verification helps keep the estimate traceable to real build activity in Ghana.


Key Questions Answered in the Report
What was the installed solar capacity in Ghana at the end of 2026?
The Ghana solar energy market size reached 300 MW in 2026.
How fast is Ghana’s solar capacity expected to grow between 2026 and 2031?
Total capacity is projected to expand at a 37.42% CAGR, reaching 1,480 MW by 2031.
Which solar segment is growing fastest by end-user?
Commercial-industrial systems lead growth at a 39.24% CAGR as mines, telecom towers, and factories adopt behind-the-meter arrays.
What share of Ghana’s 2025 solar capacity came from on-grid projects?
On-grid plants accounted for 72.10% of installed capacity in 2025.
Why are mini-grids attractive for rural Ghana?
Hybrid solar mini-grids deliver electricity at USD 0.38 per kWh, undercutting diesel gensets by up to 50%, while supporting the government’s plan to close the rural access gap.
Which policy offers the biggest cost relief for solar imports?
The Exemptions Act 2022 waives duties and VAT on PV equipment, trimming landed costs by 15%–20%.
Page last updated on:




