Nigeria OOH And DOOH Market Size and Share
Market Overview
| Study Period | 2020 - 2031 |
|---|---|
| Forecast Data Period | 2026 - 2031 |
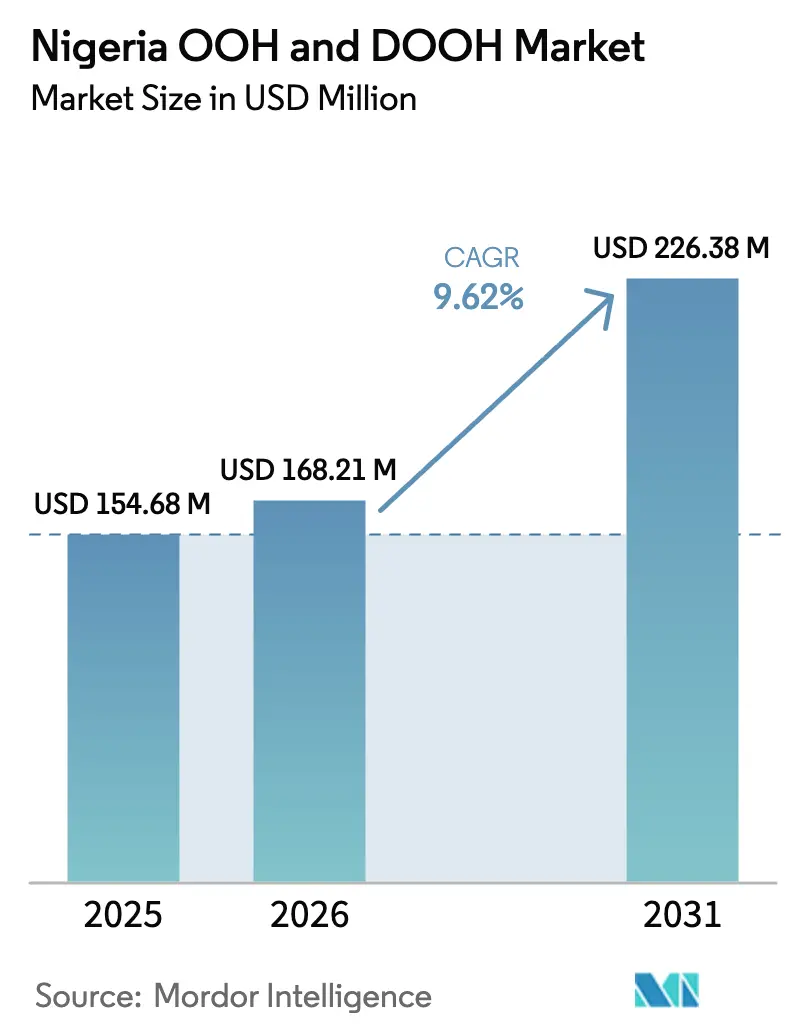
| Base Year Market Size (2025) | USD 154.68 Million |
| Market Size (2026) | USD 168.21 Million |
| Market Size (2031) | USD 226.38 Million |
| Growth Rate (2026 - 2031) | 9.62% CAGR |
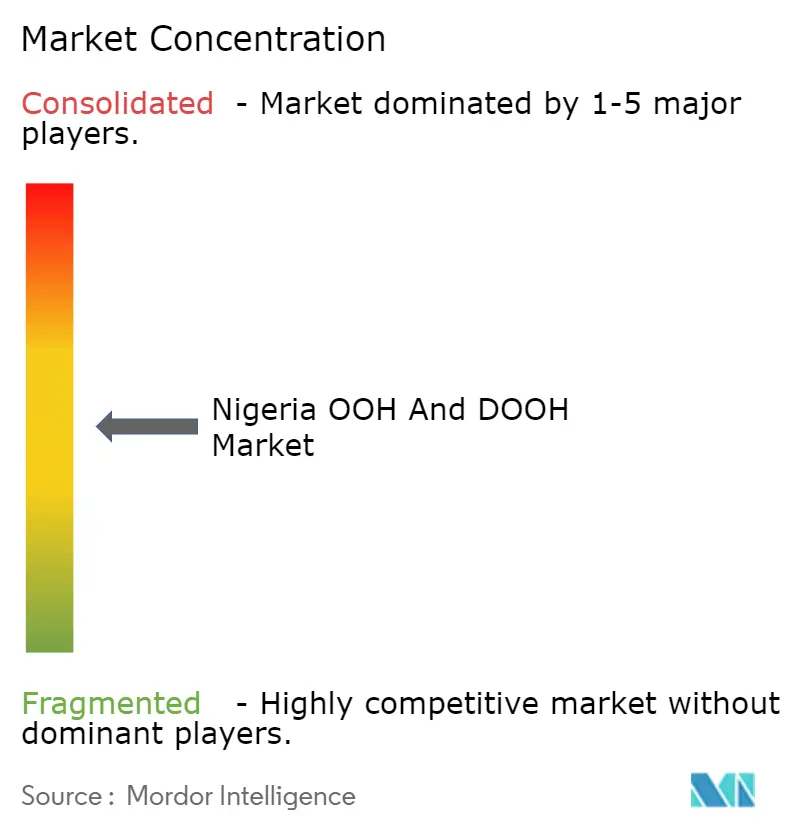
| Market Concentration | Medium |
Major Players *Disclaimer: Major Players sorted in no particular order Image © Mordor Intelligence. Reuse requires attribution under CC BY 4.0. | |
Nigeria OOH And DOOH Market Analysis by Mordor Intelligence
The Nigeria OOH and DOOH market size is projected to expand fromUSD 154.68 million in 2025 and is estimated to grow from USD 168.21 million in 2026 to reach USD 226.38 million by 2031, at a CAGR of 9.62% during the forecast period (2026-2031). Advertiser confidence is rebuilding as inflation eases, programmatic buying gains traction, and federal highway concessions unlock new right-of-way inventory. Telco-funded smart-city kiosks, declining LED panel costs, and centralized permitting in Lagos strengthen digital adoption, while solar duty waivers mitigate energy cost spikes. Transit corridors in Lagos and Abuja draw premium spend because electric-bus and light-rail rollouts create long-dwell environments, and retail landlords are turning indoor screens into fresh revenue streams as e-commerce pressures mall margins.
Key Report Takeaways
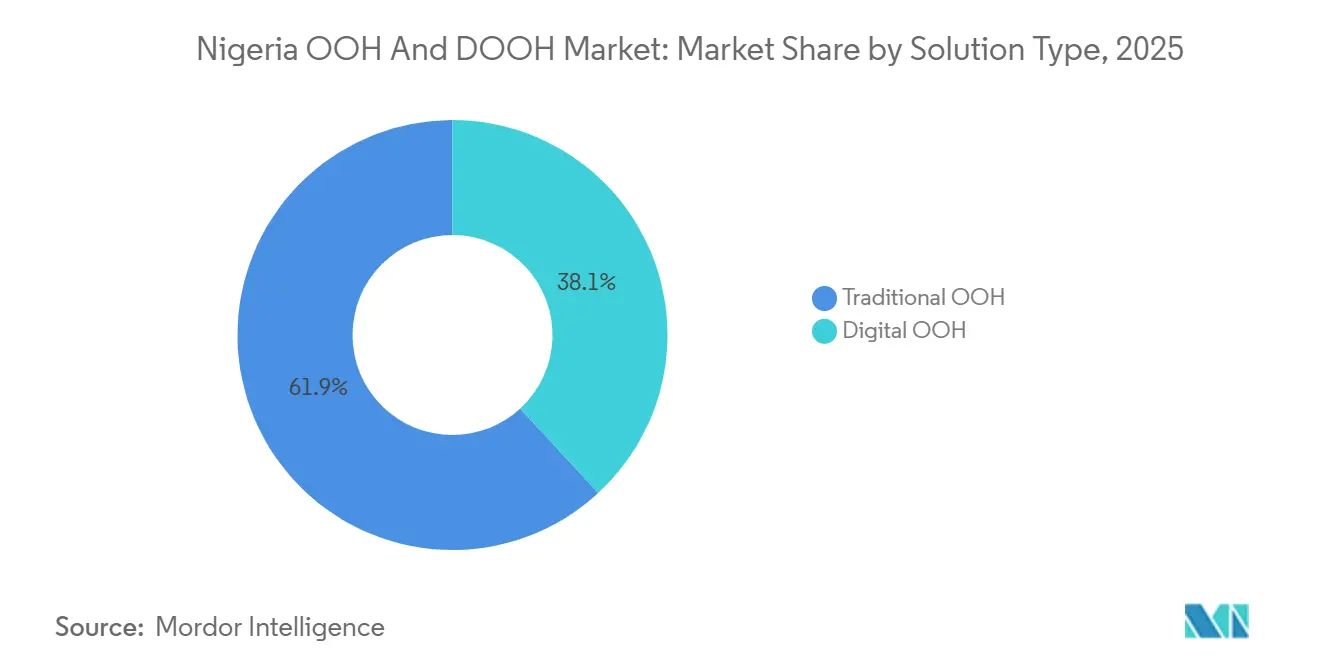
- By solution type, traditional OOH led with 61.86% of Nigeria OOH and DOOH market share in 2025, yet digital OOH is advancing at a 6.87% CAGR through 2031.
- By application, billboard formats commanded 54.96% revenue share in 2025; transit advertising is expected to progress at a 7.23% CAGR to 2031.
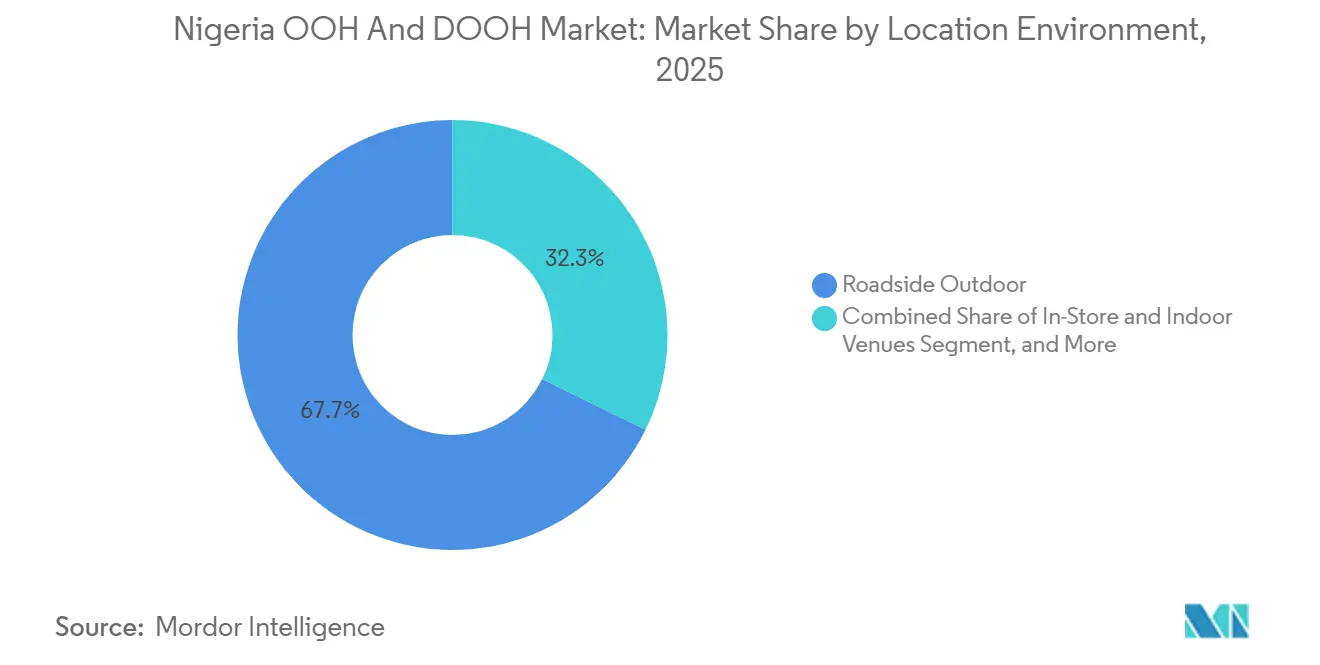
- By location environment, roadside outdoor held 67.74% of placements in 2025, whereas in-store and indoor venues are forecast to grow at an 8.41% CAGR through 2031.
- By end-user industry, retail accounted for 26.87% of 2025 spend, while media and entertainment is projected to rise at an 8.32% CAGR to 2031.
Note: Market size and forecast figures in this report are generated using Mordor Intelligence’s proprietary estimation framework, updated with the latest available data and insights as of January 2026.
Nigeria OOH And DOOH Market Trends and Insights
Drivers Impact Analysis*
| Driver | (~) % Impact on CAGR Forecast | Geographic Relevance | Impact Timeline |
|---|---|---|---|
| Urban Rail and BRT Station Build-Outs Unlocking New Premium Transit Inventory | +1.2% | Lagos, Abuja, Kano, Kaduna | Medium term (2-4 years) |
| Surge in Fintech and Sports-Betting Ad Spend as Cashless Penetration Deepens | +1.1% | National focus on Lagos, Abuja, Port Harcourt | Short term (≤ 2 years) |
| Rapid Adoption of Programmatic DOOH Exchanges Among Lagos-Abuja Media Buyers | +0.9% | Lagos and Abuja, extending to Port Harcourt | Short term (≤ 2 years) |
| LED Panel Price Decline Lowering Entry Barriers for Local Operators | +0.8% | Nationwide, fastest in Lagos and Abuja | Medium term (2-4 years) |
| Telco-Funded Smart-City Kiosks Creating Bundled Ad Real Estate | +0.7% | Lagos, Abuja and secondary cities | Medium term (2-4 years) |
| Federal Highway PPP Policy Enabling Large-Format Gantries on New Corridors | +0.6% | 30 federal corridors in all zones | Long term (≥ 4 years) |
| Source: Mordor Intelligence | |||
Urban Rail and BRT Station Build-Outs Unlocking New Premium Transit Inventory
Eight Abuja Light Rail stations and the Lagos Blue Line that carries 250,000 passengers daily are redefining commuter touchpoints. Station façades, platform screens, and nearby wall wraps now deliver long dwell-time impressions that command premium CPMs. Electric-bus fleets slated for Lagos, Abuja, Kano, and Kaduna will add fully wrapped vehicles and depot-based LED clusters. Public-private concession rules require solar streetlights and CCTV, creating built-in power and security for screens.[1]Emmanuel Agbo, “Nigeria: Abuja Light Rail Ready for Commissioning,” Premium Times, allafrica.com, Federal Ministry of Works, “HDMI Phase II,” fmw.gov.ng Advertisers value this inventory for the steady passenger rhythm and predictable sightlines that facilitate dynamic creative triggers.
Surge in Fintech and Sports-Betting Ad Spend as Cashless Penetration Deepens
Financial inclusion reached 74% of adults in 2024, and mobile-money platforms now blanket urban centers. Bet9ja’s NGN 1 billion (USD 0.75 million) jackpot promotion used stadium wraps, gantries, and bus-side LED panels to boost app downloads during the 2024-2025 football season. Flutterwave and Paystack replicate the model by pairing QR-code creative with proximity targeting near agent outlets. As disposable income rises through federal cash-transfer programs, advertisers double down on outdoor media to reach newly banked demographics and to synchronize omnichannel campaigns with match-day peaks.
Rapid Adoption of Programmatic DOOH Exchanges Among Lagos-Abuja Media Buyers
Place Exchange’s March 2025 launch added Nigerian inventory into 100,000 global screens, letting brands trade via private deals or open auction. The Out-of-Home Advertising Association of Nigeria accelerated the shift by unveiling GlobeTrotter in November 2025, a marketplace that digitizes asset discovery and booking. Automated buying trims campaign lead times from weeks to hours and supports dynamic creative served against weather, traffic, or sports triggers. Agencies are already redirecting budget from static bundles to impression-level buys that deliver confirmed playout logs and real-time analytics, raising overall market efficiency.
LED Panel Price Decline Lowering Entry Barriers for Local Operators
Average landed cost for P6 outdoor modules fell after the customs service set solar photovoltaic duty at 0% and inverter duty at 5% in May 2025.[2]Nigeria Customs Service, “Import and Export Procedure Corrected_Final,” customs.gov.ng Smaller firms can now replace static faces with 10-square-meter screens for under USD 12,000, a 40% drop from 2023. Lower capex translates into broader geographic reach and higher content rotation, stimulating fresh demand from SMEs priced out of legacy long-term contracts. Panel reliability gains also reduce maintenance downtime, further lifting inventory yield.
Restraints Impact Analysis*
| Restraint | (~) % Impact on CAGR Forecast | Geographic Relevance | Impact Timeline |
|---|---|---|---|
| Lagos State Signage and Advertisement Agency Moratorium on New Roadside Boards | -0.7% | Lagos State, spillover on national campaigns | Short term (≤ 2 years) |
| FX Shortages Raising Import Costs for LED Modules and Spares | -0.6% | Nationwide | Short term (≤ 2 years) |
| High Diesel Prices Inflating Screen-Powering OPEX for Rural Networks | -0.5% | Rural and peri-urban Nigeria | Medium term (2-4 years) |
| Fragmented Audience-Measurement Standards Limiting National CPM Deals | -0.4% | Nationwide | Medium term (2-4 years) |
| Source: Mordor Intelligence | |||
Lagos State Signage and Advertisement Agency Moratorium on New Roadside Boards
LASAA’s QR-coded permit regime, effective November 2023, now lists every authorized billboard in a public registry and empowers inspectors to dismantle non-compliant units within 30 days.[3]Lagos State Signage and Advertisement Agency, “Regulations and Rules,” lasaa.lg.gov.ng
Although the process curbs illegal structures and improves aesthetics, the agency froze approvals in several high-density corridors, capping supply in a city responsible for more than 60% of national spend. Operators must therefore chase inventory in transit hubs or indoor malls, channels that carry higher upfront costs and stricter tenancy rules.
FX Shortages Raising Import Costs for LED Modules and Spares
Persistent dollar scarcity forces media owners to source currency on the parallel market, inflating the landed price of modules under HS 85395200 by up to 30%. Import duty at 20% plus 7.5% VAT deepens pressure, while maintenance delays arise when spare power supplies or receiving cards wait months for Form M approvals. Smaller firms risk screen outages that erode advertiser trust. Even though solar equipment attracts preferential rates, panels still require foreign exchange, so expansion plans remain hostage to central bank liquidity interventions.[4]International Monetary Fund, “Nigeria: 2025 Article IV Consultation,” imf.org
*Our forecasts treat driver/restraint impacts as directional, not additive. The impact forecasts reflect baseline growth, mix effects, and variable interactions.
Segment Analysis
By Solution Type: Programmatic Momentum Tilts Spend Toward Digital
Traditional formats controlled 61.86% of Nigeria OOH and DOOH market share in 2025, but digital’s 6.87% CAGR signals an irreversible pivot. Programmatic pipes now channel demand from 52 global DSPs into Lagos and Abuja screens, compressing deal cycles and enabling real-time creative swaps. MTN Ads and Airtel Ads layer first-party mobile data onto location grids, giving brands granular audience segments unreachable through static faces. Operators retrofit classic gantries with LED tiles to capture the higher yield per square meter, yet power-cost volatility still slows rollouts outside the national grid’s Band A clusters. As compliance audits tighten, certified digital sites fetch premium rates that offset hardware depreciation.
Investment hurdles differ for Non-Programmatic-DOOH, where manual insertion orders and opaque audience estimates alienate multinational brands. The Nigeria OOH and DOOH market size attached to programmatic inventory is projected to outpace legacy direct-sale screens because automated trading assures verified playout and unifies campaign reporting. Smaller independents mitigate risk by leasing screen time to Place Exchange-linked resellers, securing cash flow without complex sales teams. In the medium term, cooperative data-sharing under the OAAN code is expected to raise buyer confidence and broaden digital penetration beyond the current 4% unit count.


By Application: Transit Corridors Capture Commuter Attention
Billboards garnered 54.96% of revenue in 2025, underscoring their reach along federal highways and urban arterials. Yet transit media is on track for a 7.23% CAGR as rail stations, BRT shelters, and electric-bus wraps turn formerly passive waypoints into digital canvases. High dwell-time settings permit video and contextual feeds that lift engagement rates. The Nigeria OOH and DOOH market size tied to transit formats benefits from concession rules that bundle advertising rights with station maintenance, giving operators secure multi-year tenures. Audience repeatability during peak rush hours also aligns with performance marketing goals, particularly for mobile apps pushing quick response codes.
Growth is tempered by fragmented ownership between state agencies and private fleet managers, complicating unified audience metrics. Nonetheless, data-enabled platforms now tap ticketing APIs to proxy reach statistics, narrowing the measurement gap. Brands combine station dominations with vehicle wraps to blanket the commuter journey, increasing frequency without oversaturating any single touchpoint. As electric buses gain scale, on-board screens will shift from static route info to ad-supported infotainment, unlocking incremental revenue streams.
By Location Environment: Indoor Venues Rise on Mall Monetization
Roadside placements still accounted for 67.74% of 2025 inventory, yet indoor venues such as Ikeja City Mall and Jabi Lake Mall are climbing at an 8.41% CAGR. Landlords license ceiling mosaics, escalator wraps, and food-court LEDs to offset rising vacancy rates, and retailers value the format for point-of-sale proximity. The Nigeria OOH and DOOH market share for mall environments is small today but expands quickly because screens connect to reliable grid power and centralized HVAC, slashing maintenance costs. Advertisers exploit shopper dwell times exceeding two hours to sequence product demos, QR activations, and contactless coupon drops.
Cinema foyers and hypermarket atriums add incremental impressions that complement roadside blasts. Digital kiosks near ATM clusters collect anonymized interaction data, feeding attribution models that validate spend. While regulatory red tape is lighter indoors, fire-safety codes and tenant association bylaws impose design constraints that slow deployment. Despite these hurdles, the superior audience quality and brand-safe context continue to pull budget into climate-controlled spaces.

By End-User Industry: Media Platforms and Betting Apps Accelerate
Retail held 26.87% of spend in 2025, but streaming platforms and betting houses are scaling at an 8.32% CAGR, mirroring Nigeria’s young, mobile-first demographic. Football season triggers omnichannel blitzes from Bet9ja and international bookmakers, with creatives synchronized across outdoor, social, and in-app banners. The Nigeria OOH and DOOH market size attributed to media and entertainment will swell as over-the-top video providers chase subscriber targets in the face of rising fiber penetration. Financial-services campaigns stay visible, promoting agency banking and instant lending to the newly banked.
Automotive and telecom brands maintain steady baseline activity, though chip shortages and spectrum auctions can swing quarterly budgets. Healthcare advertisers cluster around teaching hospitals and upscale clinics, leaning on outdoor to direct patients toward new diagnostic centers. Overall, expanding digital footprints furnish the attribution mechanics these verticals require to justify sustained investment.
Geography Analysis
Lagos remains the epicenter, absorbing more than 60% of national spend. Ikorodu Road, Third Mainland Bridge, and Lekki-Epe Expressway host LED super-structures that run synchronized campaigns governed by LASAA’s QR permit codes. JCDecaux’s LATIS system overlays traffic analytics to refine loop management, while Alpha and Jam’s 100-meter static panels next to the National Theatre create landmark dominance. Abuja follows, buoyed by eight light-rail stations and premium units around Jabi Lake Mall and the airport corridor. Port Harcourt, catalyzed by oil-service headquarters and mall redevelopments, provides the coastal growth node, whereas Kano leverages Ado-Bayero Mall and federal highway arteries to anchor the north.
Federal highway PPPs cover 30 rehabilitated corridors totaling more than 2,000 kilometers and integrate mandatory solar streetlights that ease DOOH power constraints. Concessionaires receive rights to build gantries and rest-area signage, diversifying revenue beyond toll collection and standardizing design guidelines. Secondary cities such as Ibadan and Enugu gain relevance as modern malls launch, giving national brands full-funnel reach without relying solely on Lagos. Airport advertising is poised for a leap once the five international hubs shift to private concessionaires, unlocking long-tenure packages with guaranteed passenger volumes.
Energy economics shape expansion decisions. Band A tariff hikes and diesel at NGN 1,406 (USD 1.05) per liter squeeze operating budgets outside grid-reliable zones, nudging operators toward solar-hybrid systems eligible for zero-duty imports. FX scarcity still limits module availability, but duty relief on photovoltaic equipment partially offsets currency headwinds. The IMF expects GDP to grow 3.4% in 2025, supporting advertiser outlays even as inflation cools to 23.7%. These macro stabilizers encourage geographic diversification beyond the traditional Lagos-Abuja axis.
Competitive Landscape
Industry fragmentation endures, with 11,443 registered billboard structures in 2019 and DOOH penetration at just 4% by unit count. JCDecaux leverages a first-mover edge through 20 large-format sites and a proprietary traffic-intel stack that splits loops between public service and commercial slots. Alpha and Jam push the envelope with 3D and mixed-format builds like Maslow and Olympia, elevating creative standards and audience expectations. Local independents, Nimbus Media, Invent Media, Elevate Media, capitalize on falling LED prices to blitz mall atriums and secondary highways, forcing incumbents to revisit static-to-digital conversion roadmaps.
Programmatic supply surged after Place Exchange’s integration and OAAN’s GlobeTrotter rollout, both of which equalize buyer access and reward proof-of-play transparency. Telco platforms MTN Ads and Airtel Ads unsettle the field by coupling subscriber data with omnichannel delivery that transcends physical screen counts. Smaller operators partner with these portals to syndicate unsold inventory, preserving yield without heavy tech capex. Measurement remains the battleground, driving ventures like Retinaad’s AI verification suite that promises real-time compliance scans and audience heat maps.
White-space growth lies in airport concessions, electric-bus networks, and highway rest areas mandated under HDMI Phase II. Operators courting these assets must evidence funding and technical expertise under stricter Ministry of Works rules, raising the bar to weed out under-capitalized bidders. Consolidation pressures are likely as investors favor portfolios featuring integrated programmatic pipes, renewable energy plans, and audited impression data.
Nigeria OOH And DOOH Industry Leaders
JCDecaux SE
Optimum Exposures Ltd
Invent Media Ltd
Nimbus Media
Alpha & Jam
- *Disclaimer: Major Players sorted in no particular order

Recent Industry Developments
- January 2026: Alpha and Jam Africa unveiled Olympia, Lagos’ largest mixed-format structure beside the National Theatre, combining two 100 m × 30 m static faces with a 30 m × 4 m LED screen.
- November 2025: The Out-of-Home Advertising Association of Nigeria launched GlobeTrotter, a digital marketplace linking asset owners and buyers for seamless, transparent transactions.
- July 2025: The Federal Ministry of Works revised HDMI concession terms, compelling private partners to install solar lighting, CCTV, and rest areas along project routes.
- March 2025: Place Exchange expanded its programmatic DOOH platform to Nigeria, adding local screens to global open-auction and private-marketplace pools.


Research Methodology Framework and Report Scope
Market Definitions and Key Coverage
According to Mordor Intelligence, the Nigeria out-of-home (OOH) and digital OOH (DOOH) market covers all paid advertising formats that reach consumers in public spaces, from static billboards and street furniture to networked LED screens, programmatic units, and interactive displays deployed both outdoors and in high-traffic indoor venues. Spend tied to creative development, mobile retargeting, and purely online banners falls outside this scope.
Scope Exclusions: Indoor point-of-sale screens that are owned and operated by retailers for in-store promotion are excluded.
Segmentation Overview
- By Solution Type
- Traditional OOH
- Digital OOH
- Programmatic-DOOH
- Non-Programmatic-DOOH
- By Application
- Billboard
- Transit
- Street Furniture
- Other Applications
- By Location Environment
- Roadside Outdoor
- Airports
- Malls and Transit Hubs
- In-Store and Indoor Venues
- Other Location Environments
- By End-User Industry
- Automotive
- Retail
- Healthcare
- Banking and Financial Services (BFSI)
- Media and Entertainment
- Other End-User Industries
Detailed Research Methodology and Data Validation
Primary Research
Mordor analysts interviewed media-owner executives, buying-agency planners, and technology vendors across Lagos, Abuja, and Port Harcourt. These conversations clarified effective occupancy rates, average selling prices, and adoption timelines for programmatic buying, enabling us to align model inputs with on-ground realities and to challenge secondary numbers where gaps persisted.
Desk Research
We first mapped the physical inventory base using open data from agencies such as the Outdoor Advertising Association of Nigeria (OAAN), Lagos State Signage & Advertisement Agency (LASAA), and national transport authorities, which publish licensed panel counts and permit fees. Industry bulletins from the World Out of Home Organization, advertising spend tables in Nigerian Bureau of Statistics releases, and customs import codes for LED display hardware informed supply growth and price benchmarks. Company filings, investor decks, and major press articles supplied brand-level campaign budgets and new screen rollouts. Paid databases including D&B Hoovers and Dow Jones Factiva helped us cross-check operator revenues and transaction news. This list is illustrative; many additional sources supported data capture and vetting.
Market-Sizing & Forecasting
A top-down demand pool was built by reconciling brand advertising outlays, sourced from fiscal filings and audited media spend trackers, with OOH's historical share of total ad spend, which is then split by format using verified panel inventories and typical sell-through ratios. Bottom-up roll-ups of leading supplier revenues and sampled price-per-face checks provided a reasonableness screen before totals were finalized. Key variables include urban population growth, new highway kilometers, LED import volumes, power backup costs, mobile data penetration, and brand campaign seasonality. Multivariate regression, anchored on these drivers and validated by expert consensus, underpins the 2025-2030 forecast. Where operator revenue disclosures were partial, gaps were bridged using average occupancy × ASP proxies derived from interviewed benchmarks.
Data Validation & Update Cycle
Outputs undergo variance tests against historical spend patterns and OAAN inventory audits, followed by peer review within the analyst team. Mordor refreshes the model every twelve months and issues interim revisions when events, such as sudden exchange rate swings or new advertising code directives, materially alter input assumptions.
Why Our Nigeria OOH And DOOH Baseline Stands Out
Published estimates often diverge because firms adopt different panel definitions, discount rates, and update cadences.
Key gap drivers include whether indoor place-based screens are counted, how average selling prices are adjusted for currency volatility, and the frequency with which new builds are added to the inventory pool before full occupancy is achieved. Mordor discloses each of these levers and updates them annually, whereas some alternate publishers rely on static historical ratios or regional proxies.
Benchmark comparison
| Market Size | Anonymized source | Primary gap driver |
|---|---|---|
| USD 154.70 M (2025) | Mordor Intelligence | - |
| USD 118.21 M (2025) | Regional Consultancy A | Uses 2022 panel count, excludes indoor transit hubs, applies flat 10% discount factor |
| USD 118.21 M (2022) | Trade Journal B | Treats exchange rate at 2022 average, omits programmatic premium and Lagos Red Line inventory |
In sum, because our team combines verified inventory audits with forward-looking price and utilization inputs and continuously updates for policy, exchange, and technology shifts, Mordor's baseline offers decision-makers a balanced, transparent view they can reproduce and trust.


Key Questions Answered in the Report
How fast is out-of-home advertising revenue expanding in Nigeria?
Between 2026 and 2031, the Nigeria OOH and DOOH market is forecast to grow at a 6.12% CAGR, moving from USD 0.168 billion to USD 0.226 billion.
Which advertising format is gaining the most traction among Nigerian commuters?
Transit media, particularly rail-station and BRT-bus inventory, is projected to rise at a 7.23% CAGR through 2031 due to new rail lines and electric-bus fleets.
Why are telcos investing in digital out-of-home assets?
MTN and Airtel monetize street furniture by pairing first-party subscriber data with programmatic buying, giving brands measurable reach and bypassing legacy audience-tracking hurdles.
What is driving indoor screen growth inside Nigerian malls?
Mall owners deploy digital signage to capture two-hour shopper dwell times and offset retail vacancy, propelling indoor venues at an 8.41% CAGR.
How are foreign-exchange shortages affecting screen deployment?
FX scarcity inflates LED module costs by as much as 30% and delays spare-part imports, limiting expansion despite duty waivers on solar equipment.
Which regions offer the next wave of outdoor inventory after Lagos?
Abuja, Port Harcourt, Kano, and PPP-rehabilitated highway corridors provide fresh sites through station build-outs, airport concessions, and mandated rest-area gantries.
Page last updated on:


