United States OOH And DOOH Market Size and Share
Market Overview
| Study Period | 2020 - 2031 |
|---|---|
| Forecast Data Period | 2026 - 2031 |
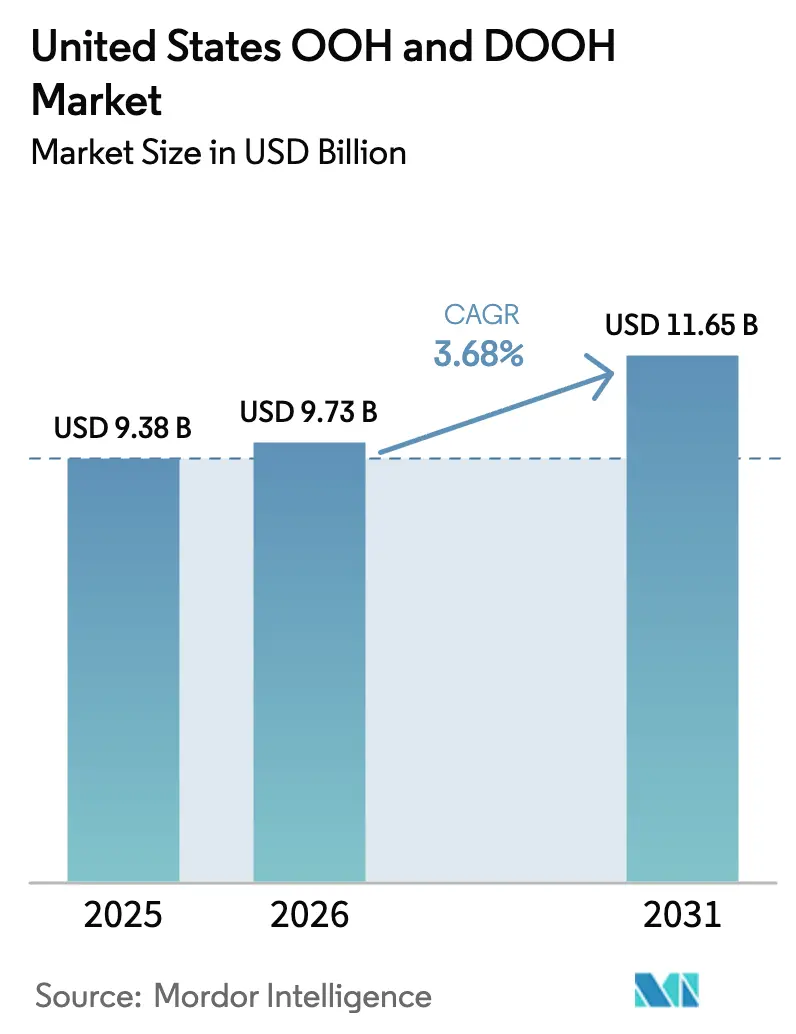
| Base Year Market Size (2025) | USD 9.38 Billion |
| Market Size (2026) | USD 9.73 Billion |
| Market Size (2031) | USD 11.65 Billion |
| Growth Rate (2026 - 2031) | 3.68% CAGR |
| Market Concentration | Medium |
Major Players *Disclaimer: Major Players sorted in no particular order Image © Mordor Intelligence. Reuse requires attribution under CC BY 4.0. | |
United States OOH And DOOH Market Analysis by Mordor Intelligence
The United States out-of-home advertising market size is expected to grow from USD 9.38 billion in 2025 to USD 9.73 billion in 2026 and is forecast to reach USD 11.65 billion by 2031 at 3.68% CAGR over 2026-2031. Digital formats are expanding more than twice as fast as the overall market, with digital OOH (DOOH) expected to post a 6.2% CAGR through 2030. Programmatic buying, mobile location data, and smart-city infrastructure are accelerating the shift toward data-driven inventory. Federal infrastructure funding is enlarging premium airport inventory, while EV-charging networks are adding fresh roadside screens. At the same time, tariff uncertainty on LED panels and strict historic-district zoning rules temper the conversion pace from static to digital.
Key Report Takeaways
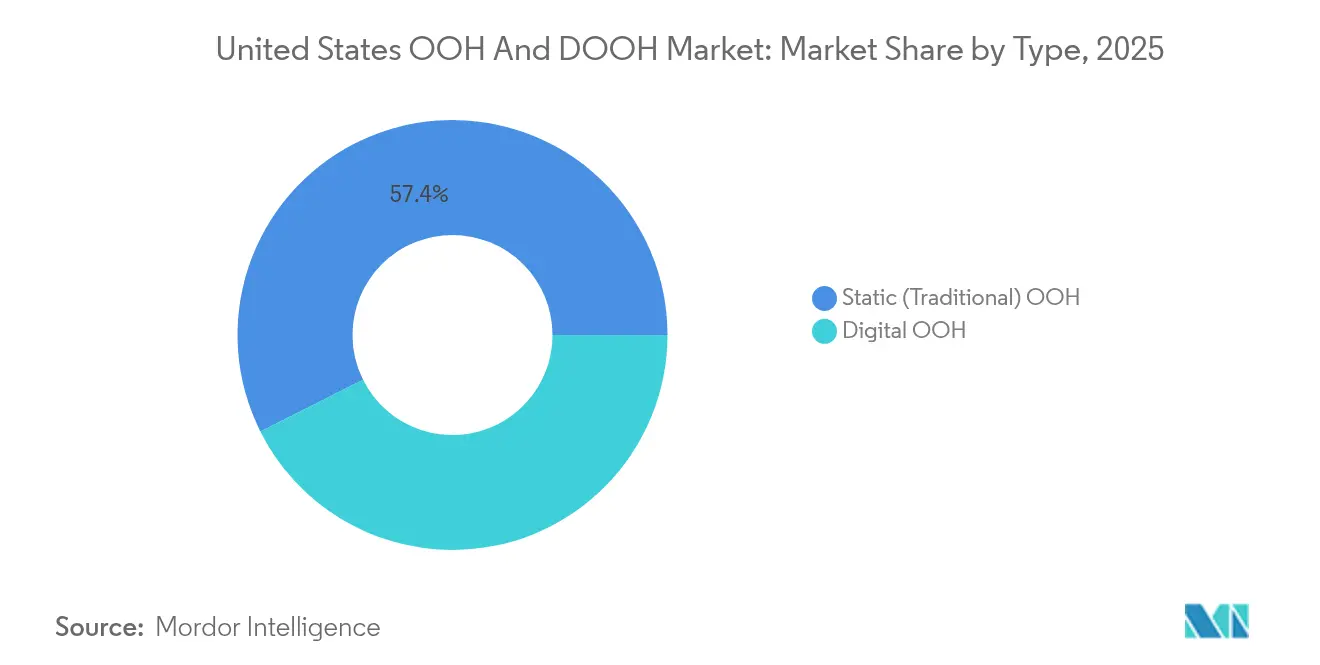
- By type, static formats held 57.40% of the United States out-of-home advertising market share in 2025, while digital OOH is set to rise at a 6.05% CAGR through 2031.
- By application, billboards commanded 45.30% revenue share of the United States out-of-home advertising market size in 2025; airport advertising is projected to expand at a 6.62% CAGR through 2031
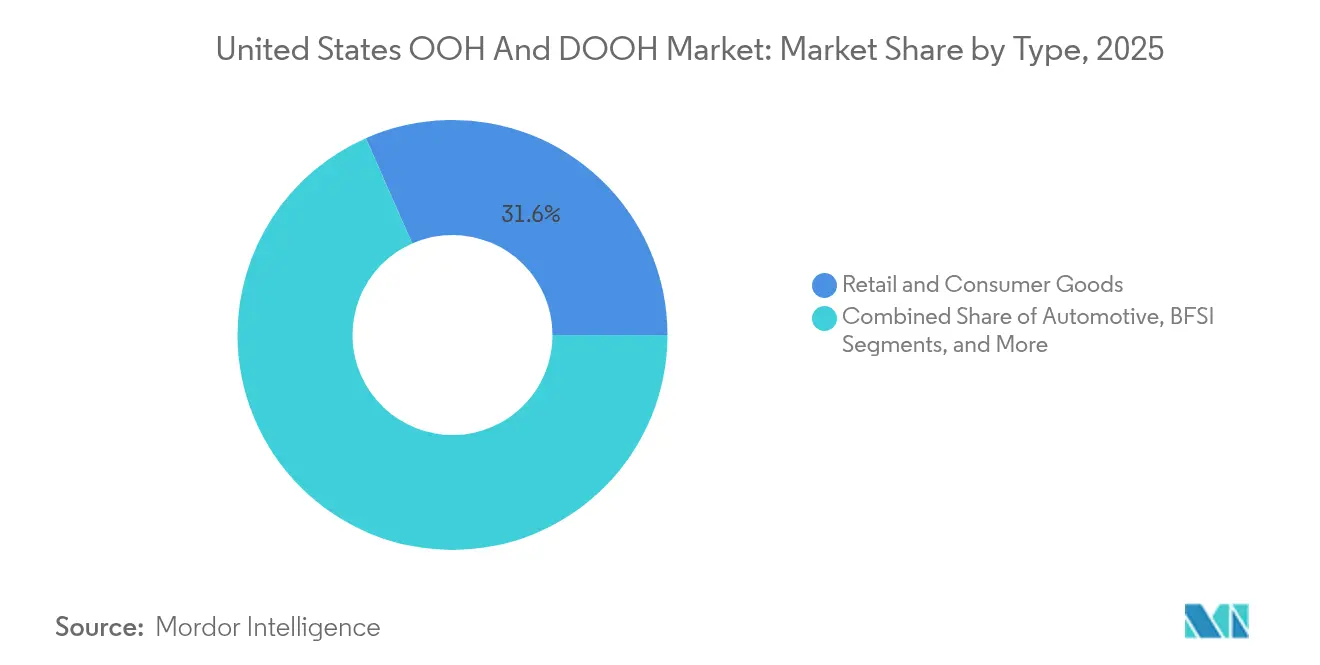
- By end-user industry, retail and consumer goods led with 31.60% share in 2025, whereas healthcare and pharmaceuticals are poised for the fastest 5.55% CAGR between 2026-2031.
Note: Market size and forecast figures in this report are generated using Mordor Intelligence’s proprietary estimation framework, updated with the latest available data and insights as of 2026.
United States OOH And DOOH Market Trends and Insights
Drivers Impact Analysis*
| Driver | (~) % Impact on CAGR Forecast | Geographic Relevance | Impact Timeline |
|---|---|---|---|
| Smart-kiosk roll-outs | +2.50% | Los Angeles, Santa Monica, other large cities | Short term (≤ 2 years) |
| Programmatic DOOH uptake | +1.80% | Nationwide retail corridors | Short term (≤ 2 years) |
| Airport modernization grants | +1.30% | Major hub and regional airports | Medium term (2-4 years) |
| EV-charging screen networks | +1.00% | Urban and highway corridors | Long term (≥ 4 years) |
| Source: Mordor Intelligence | |||
Municipal smart-kiosk roll-outs in major US cities
Smart kiosks that merge public service tools with digital ad panels are multiplying rapidly. Los Angeles has earmarked USD 30 million to install 3,000 digital bus shelters capable of device charging and neighborhood information displays, creating premium inventory in high-foot-traffic areas. [1]Government Technology Editors, “L.A.’s New Digital Bus Shelters to Offer EV Charging and Real-Time Info,” govtech.com Santa Monica’s 75 wayfinder kiosks are delivering city maps and paid placements while generating incremental municipal income. Media owners gain turnkey digital inventory without erecting traditional billboards, and advertisers obtain contextually relevant impressions at street-level decision points. Location sensors embedded in these kiosks also feed anonymized footfall data back to programmatic platforms, refining campaign measurement. The blend of utility and advertising aligns with smart-city mandates, easing public acceptance of new screens in dense neighborhoods.
Rapid adoption of programmatic DOOH among retail brands
Retail marketers are rewriting OOH buying playbooks by tapping programmatic exchanges. Clear Channel Outdoor now pipes real-time availability data into AdQuick.com’s interface, compressing the negotiation cycle from weeks to minutes. Vistar Media links advertisers to more than 1.1 million screens, letting brands pause, swap, or geo-fence creative on demand. The United States out-of-home advertising market benefits from this digital congruence because retailers can launch OOH bursts synchronized with e-commerce promotions. Coupling anonymized mobile-location signals with impression data yields credible ROI dashboards, a long-standing gap for static posters. As attribution confidence rises, internal media mixes shift dollars from online display toward the tangible reach of large-format locations.
Airport modernization grants fueling premium DOOH inventory
Roughly USD 1 billion in annual FAA Airport Terminal Program funding is flowing into terminal renovations for FY 2025, and many bids explicitly include large digital canvases for advertising. [2]Federal Register, “FY 2025 Airport Terminal Program Notice of Funding Opportunity,” federalregister.gov The USD 38.1 million upgrade at Frederick Douglass Greater Rochester International Airport will refresh ticketing and baggage halls, both prime ad zones.[4]Office of Governor Kathy Hochul, “Rochester Airport Terminal Modernization Receives USD 38.1 Million,” governor.ny.gov Clear Channel Outdoor’s airport unit saw a 21.4% revenue bump in Q2 2024 after installing new LED walls across several hubs.[3]Clear Channel Outdoor, “Q2 2024 Investor Presentation,” clearchanneloutdoor.com Luxury, tech, and financial advertisers flock to airports because frequent flyers exhibit higher household incomes and purchase intent. The predictable dwell times inherent to security queues and gate areas extend exposure, improving recall relative to roadside boards.
EV-charging station screen networks expanding footprint
A consortium of BMW, General Motors, Honda, Hyundai, Kia, Mercedes-Benz, and Stellantis is building a 30,000-point high-power charging grid nationwide, each site engineered for integrated digital signage. Energy Northwest and EVCS are adding 40 DC fast chargers across Washington and Oregon with U.S. DOT backing, also fitted with display panels. Screenverse reports a 68% lift in purchase intent after Nokia creative ran on EV-charging screens, underscoring the captive nature of 20- to 30-minute charge sessions. The United States out-of-home advertising market gains a fresh roadside network that is contextually relevant for automotive, energy, and QSR brands. Dynamic pricing models—akin to online contextual bidding—are emerging as sensor data gauges traffic peaks at each charger.
Restraints Impact Analysis*
| Restraint | (~) % Impact on CAGR Forecast | Geographic Relevance | Impact Timeline |
|---|---|---|---|
| Historic-district zoning limits | -0.80% | San Francisco, Austin, Boston, Charleston | Long term (≥ 4 years) |
| LED panel tariffs | -0.60% | Nationwide import supply chains | Medium term (2-4 years) |
| Source: Mordor Intelligence | |||
Historic-district zoning limits for digital billboards
Cities with celebrated architectural legacies guard streetscapes by capping sign size, illumination, or outright banning new off-premise displays. San Francisco’s Market Street Special Sign District bars most electronic boards unless strict frontage rules are met. Austin’s Land Development Code likewise curtails new billboards to preserve sightlines and reduce distraction risks. Media owners must pivot growth budgets toward suburban arterials or rapid-transit interiors, inflating CPMs for the scarce downtown slots that do pass review. The uneven regulatory map splinters the United States out-of-home advertising market, fostering premium scarcity in heritage cores while oversupplying less restrictive corridors.
LED panel tariffs raising DOOH conversion CAPEX
Proposed duties reaching 25% on imported LED modules from Mexico and 10% from China are inflating hardware costs for billboard upgrades. Signify and peers are exploring alternate production in Mexico, India, and Indonesia to temper landed costs, yet shipment timelines remain uncertain as tooling migrates. The United States out-of-home advertising market faces longer payback periods because a 48-foot digital billboard already commands USD 250,000 to USD 300,000 in capital. Extended breakeven horizons can delay board swaps, particularly for mid-sized operators reliant on bank credit rather than REIT capital structures.
*Our forecasts treat driver/restraint impacts as directional, not additive. The impact forecasts reflect baseline growth, mix effects, and variable interactions.
Segment Analysis
By Type: Digital transformation accelerates despite static dominance
Static formats retained a 57.40% share in 2025, underscoring the breadth of roadside posters still dotting American highways. Yet DOOH’s 6.05% CAGR to 2031 signals a reskewing of inventory value as advertisers chase data-rich impressions. Clear Channel Outdoor’s digital boards contributed 46% of the company's revenue, even though they make up under 7% of faces, revealing outsized monetization potential. Programmatic exchanges linked through Vistar Media already aggregate 1.1 million screens, unlocking national reach without manual contracting. The United States out-of-home advertising market size for large-format digital billboards is projected to advance faster than static as municipalities approve new digital permits along commuter arteries. In parallel, cost curves for LED modules continue to fall despite tariff headwinds, encouraging secondary and tertiary market operators to convert.
Second-generation digital networks include small-format retail, gym, and office screens that trade more like online impressions. Their ability to swap creative at retail velocity draws omnichannel brands that demand synchronized storytelling across in-store and mobile. Although static boards still blanket rural corridors, advertisers increasingly divert incremental dollars to data-verified impressions. That reallocation cements a flywheel in which media owners reinvest growing DOOH margins into further conversions, tilting future share in favor of dynamic inventory. Consequently, the United States out-of-home advertising market is likely to exhibit a widening revenue gap between digital and static units even as physical face counts slowly converge.


By Application: Airports lead growth amid diversified ecosystem
Billboards captured 45.30% of the United States out-of-home advertising market size in 2025, thanks to unmatched reach along interstates and primary roads. Yet airport advertising will grow fastest at a 6.62% CAGR through 2031 as modernization grants proliferate new LED walls. Clear Channel Outdoor added 116 large-format digital billboards across U.S. streets in 2023, but its airport segment delivered the stronger margin lift because travelers command higher advertiser premiums. Transit authorities are digitizing bus, rail, and ferry shelters to diversify revenue streams, while smart-kiosk contracts bring hyperlocal messaging to pedestrian zones. Retail and mall screens sit at the intersection of store media networks and brand marketing, letting CPGs trigger shelf-level calls-to-action that tie to point-of-sale data.
The ecosystem’s next frontier is EV-charging hubs that resemble miniature rest stops with embedded media. Early case studies show double-digit brand-lift metrics, prompting marketers in automotive, energy drink, and insurance verticals to budget test campaigns. Meanwhile, digital street furniture delivers civic information along with ads, blunting criticism that commercial signs add clutter. As applications diversify, advertisers stitch multi-format plans that carry sequential storytelling from road to concourse to point of sale. This holistic planning model anchors incremental spend inside the United States out-of-home advertising market rather than shifting it to online or mobile video.
By End-User Industry: Healthcare emerges as growth leader
Retail and consumer goods maintained the largest slice at 31.60% in 2025, reflecting the sector’s historical reliance on mass reach to push new product launches and seasonal promotions. However, healthcare and pharmaceuticals will see the quickest 5.55% CAGR through 2031 as providers fight for patient preference in a post-pandemic landscape. Hospital systems use geotargeted DOOH to steer consumers toward urgent care clinics, and pharma brands exploit HIPAA-compliant anonymized audience segments to raise disease awareness near doctor clusters. The United States out-of-home advertising market share for healthcare campaigns is underpinned by increased telehealth and Medicare Advantage competition, where DOOH offers demographic coverage without infringing digital-privacy constraints.
Luxury and fashion labels are also gravitating to the premium halo of airport terminals, aligning ads with duty-free boutiques accessible minutes after exposure. Automotive marketers apply DOOH to facilitate EV literacy, running contextual creative at charging sites. Streaming platforms deploy programmatic boards for real-time updates on show premieres, leveraging weather and sports cues to maximize relevance. Financial-services companies preserve brand safety by favoring OOH formats that avoid the user-tracking complexity of online display. Collectively, these vertical dynamics expand advertiser diversification, insulating the United States out-of-home advertising industry from cyclical swings in any single category.
Geography Analysis
Urban centers account for the majority of DOOH conversions because political leadership often pairs smart-city budgets with revenue-sharing ad contracts. Clear Channel Outdoor’s America division installed 116 new large digital faces in 2023, many in dense metros where pedestrian and vehicle impressions overlap. The Northeast, particularly New York City, is spearheading mobile transit formats; legislation enacted in January 2025 now allows for-hire vehicles to display roof-mounted tablets that push geo-aware ads, creating an itinerant network across boroughs. Conversely, the Southwest’s preservation codes slow billboard digitization within historic corridors, resulting in static dominance even as ring roads digitize.
Los Angeles exemplifies West-Coast innovation through its USD 30 million Sidewalk and Transit Amenities Program that will erect 3,000 digital shelters across the county. Santa Monica’s 75 kiosks widen the footprint, confirming that city councils view ad-supported infrastructure as budget-neutral public service. Meanwhile, Lamar Advertising’s 160,400 static and 4,750 digital billboards spanning 45 states offer advertisers turnkey national reach, though its densest networks cluster along southeastern interstates. Midwest secondary markets such as Minneapolis and Kansas City are also authorizing digital conversions, spurred by highway rebuilds that include prewired sign poles for future LED faces.
Airport hubs exhibit the sharpest regional skew: Atlanta, Dallas-Fort Worth, and Denver contributed a disproportionate slice of airport OOH revenue because each has launched multiyear terminal expansions funded partly by FAA grants. Smaller regional airports are copying that blueprint to diversify income beyond airline fees. Along coast-to-coast highways, the new EV-charging network fronted by seven automakers is sprinkling screens through rural waypoints, widening geographic equity in ad access. Taken together, the United States out-of-home advertising market displays patchwork progress that tracks local zoning attitudes, economic vitality, and infrastructure dollars rather than a uniform national pattern.
Competitive Landscape
Clear Channel Outdoor, Lamar Advertising, and OUTFRONT Media remain the axis of market concentration, collectively controlling the lion’s share of prime roadside and transit inventory. Clear Channel generated USD 1.101 billion from its America segment in 2023, fifty-two percent of corporate revenue, illustrating its weight in the United States out-of-home advertising market. Lamar’s Q2 2024 net revenue climbed 4.5% to USD 565.3 million, benefiting from local-advertiser resilience and disciplined digital conversion. OUTFRONT Media reinforces its street furniture and transit foothold through proprietary data suite smartSCOUT™, which layers privacy-compliant mobile signals onto inventory planning.
Disruption is gathering momentum from telecom entrants. T-Mobile’s USD 600 million purchase of Vistar Media in January 2025 grants it a supply-side platform touching 1.1 million screens and unlocks synergies between first-party handset data and OOH targeting. The move starkly contrasts with AT&T and Verizon’s divestiture of non-core media assets, positioning T-Mobile as an integrated connectivity-and-media challenger. Smaller programmatic specialists pursue niche roll-ups: Broadsign bought OutMoove in May 2024 to deepen automated creative trafficking. Private equity has softened its appetite in the sector, and public-company acquisitions dropped 44% in 2024, suggesting price discipline after a pandemic-era buying spree.
Technology arms races define competitive differentiation. Clear Channel’s RADAR fuses mobile location analytics, third-party data sets, and attribution dashboards, letting advertisers measure visit lift and brand awareness changes. Lamar augments boards with SolarSync light sensors to optimize brightness and power draw, cutting OPEX while improving creative clarity at night. OUTFRONT partners with city transit authorities to incorporate dynamic arrival information alongside ad slots, boosting rider utility and device-free engagement. Such product-led investments raise switching barriers for local advertisers and consolidate pricing power among incumbents. Nonetheless, specialty operators in campus, cinema, and grocery store niches defend territory through exclusive venue contracts, maintaining a long-tail structure beneath the top tier.
United States OOH And DOOH Industry Leaders
Clear Channel Outdoor Holdings Inc.
OUTFRONT Media Inc.
Lamar Advertising Company
JCDecaux SE (U.S. Operations)
Intersection
- *Disclaimer: Major Players sorted in no particular order

Recent Industry Developments
- January 2025: T-Mobile acquired Vistar Media, adding a 1.1 million-screen programmatic supply network for USD 600 million.
- January 2025: BMW, General Motors, Honda, Hyundai, Kia, Mercedes-Benz, and Stellantis launched a joint venture to install at least 30,000 high-power EV chargers with embedded digital media
- November 2024: Clear Channel Outdoor secured one of the country’s largest roadside display portfolios, expanding billboard density in growth metros
- October 2024: JOLT broadened its DOOH partnership with Vistar Media to enhance U.S. inventory


Research Methodology Framework and Report Scope
Market Definitions and Key Coverage
Mordor Intelligence defines the United States out-of-home (OOH) and digital out-of-home (DOOH) advertising market as all paid messages displayed on public outdoor assets, static billboards, street furniture, transit displays, place-based venue screens, and programmatic digital networks, sold within U.S. borders during a calendar year. Formats used exclusively for indoor corporate communications or retail shelf media are outside this scope.
Scope exclusion: in-store digital signage aimed only at staff or shoppers is not counted.
Segmentation Overview
- By Type
- Static (Traditional) OOH
- Digital OOH
- Large-Format Digital Billboards
- Digital Place-Based Media Networks
- Programmatic OOH Inventory
- By Application
- Billboard
- Transportation
- Airports
- Rail and Subway
- Street Furniture
- Retail and Mall Screens
- Other Place-based Venues (Gyms, Cinemas, Universities)
- By End-user Industry
- Retail and Consumer Goods
- Automotive
- Entertainment and Media Streaming
- Healthcare and Pharma
- BFSI
- Government and Public Sector
- Other Industries (Real Estate, Education)
Detailed Research Methodology and Data Validation
Primary Research
To bridge information gaps, we interviewed media buyers, OOH network owners, civic permitting officers, and ad-tech integrators across all U.S. time zones. Dialogues tested real selling rates, digital screen uptime, and average contract tenures, allowing us to validate inventory counts, achievable average selling price (ASP), and utilization assumptions taken from desk work.
Desk Research
Our analysts first mapped the size and structure of outdoor inventory using non-paywalled, high-credibility sources such as the Out of Home Advertising Association of America, Federal Highway Administration traffic counts, Bureau of Transportation Statistics airport passenger flows, and municipal open-data on street furniture concessions. Financial filings and investor decks of leading OOH operators complemented these datasets, while D&B Hoovers supplied historical revenue to benchmark operator market share. Public trade journals and patent databases offered trend signals around programmatic bidding and LED cost curves. This list illustrates inputs and is not exhaustive; many additional references guided data checks and contextual understanding.
Market-Sizing & Forecasting
We began with a top-down reconstruction of 2024 OOH spend from official revenue disclosures and tax-receipted transit rents, then layered penetration-rate based demand pools for airports, roadside units, and venue screens. Bottom-up spot checks, supplier billings, sampled CPM × impression audits, and selected operator roll-ups were used to fine-tune totals. Key model drivers include average digital screen ASP movement, number of permitted roadside faces, passenger volumes on urban transit, LED replacement cycles, and programmatic share of DOOH bookings. A multivariate regression tested the sensitivity of market value to these variables and produced the 2025-2030 outlook. Scenario analysis captured upside from rapid programmatic adoption and downside from regulatory caps.
Data Validation & Update Cycle
Outputs pass an anomaly scan against historical seasonality and macro indicators before analyst peer review. Any variance beyond preset thresholds triggers re-contact with sources. Reports refresh annually, and material events, such as major mergers and regulatory changes, prompt interim updates, ensuring clients always receive a current baseline.
Why Mordor's United States OOH And DOOH Baseline Commands Reliability
Published estimates often diverge because each firm picks a different mix of formats, valuation bases, and refresh dates.
Key gap drivers include whether cinema and place-based screens are bundled, if static and digital are reported together, the aggressiveness of forward growth assumptions, currency conversion choices, and how deeply on-the-ground interviews temper desk-only projections.
Benchmark comparison
| Market Size | Anonymized source | Primary gap driver |
|---|---|---|
| USD 9.38 billion (2025) | Mordor Intelligence | - |
| USD 9.13 billion (2024) | Industry Association A | Snapshot of operator billings only; excludes fast-growing programmatic DOOH and no forward adjustment |
| USD 10.9 billion (2024) | Global Consultancy B | Adds cinema and sports-venue screens; relies on broad media outlook with limited asset-level validation |
| USD 6.1 billion (2024) | Research Publisher C | Measures DOOH alone, omits static formats; estimates derived from regional ratios without U.S. expert interviews |
These comparisons show that Mordor's balanced mix of inventory counts, ASP verification, and continual expert feedback yields a dependable, transparent baseline for strategic decision-making.


Key Questions Answered in the Report
How big is the United States OOH And DOOH Market?
The United States OOH And DOOH Market size is expected to reach USD 9.73 billion in 2026 and grow at a CAGR of 3.68% to reach USD 11.65 billion by 2031.
How fast is digital OOH growing compared with static formats?
Digital formats are expanding at a projected 6.05 % CAGR, roughly double the rate of the overall market.
Which application segment is growing the quickest?
Airport advertising leads with a 6.62 % CAGR, supported by federal terminal modernization funding.
Why are EV charging stations important for OOH advertisers?
Charging dwell times create captive, tech-savvy audiences, allowing sequential, context-rich messaging that boosts purchase intent.
How do mobile data integrations improve OOH campaign measurement?
They link billboard exposure to foot traffic, sales, and app activity, giving advertisers tangible ROI metrics comparable to online channels.
Which end-user industry is currently the fastest riser in OOH spend?
Healthcare and pharmaceutical advertisers exhibit the highest growth, leveraging contextually relevant messaging near points of care.
Page last updated on:


