Singapore OOH And DOOH Market Size and Share
Market Overview
| Study Period | 2020 - 2031 |
|---|---|
| Forecast Data Period | 2026 - 2031 |
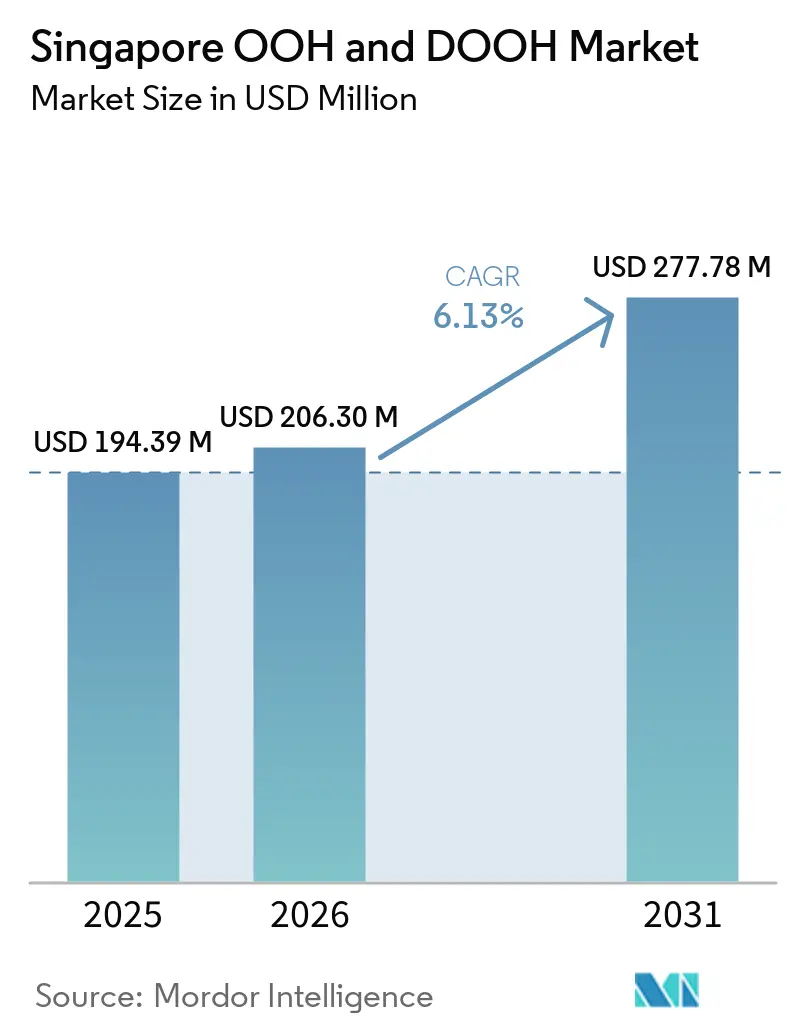
| Base Year Market Size (2025) | USD 194.39 Million |
| Market Size (2026) | USD 206.30 Million |
| Market Size (2031) | USD 277.78 Million |
| Growth Rate (2026 - 2031) | 6.13% CAGR |
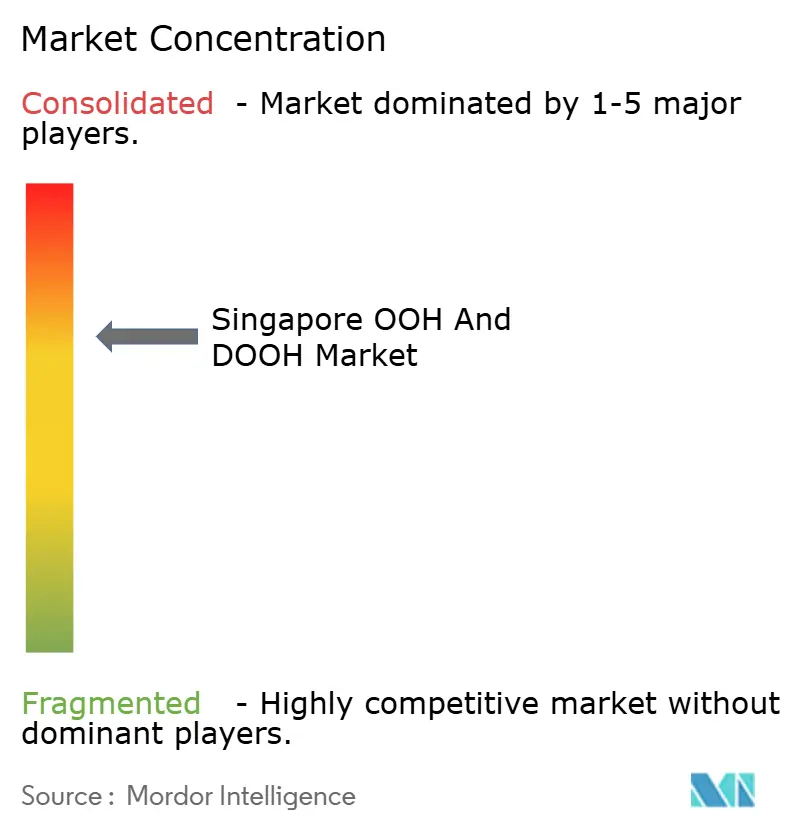
| Market Concentration | Medium |
Major Players *Disclaimer: Major Players sorted in no particular order Image © Mordor Intelligence. Reuse requires attribution under CC BY 4.0. | |
Singapore OOH And DOOH Market Analysis by Mordor Intelligence
The Singapore OOH And DOOH Market size was valued at USD 194.39 million in 2025 and is estimated to grow from USD 206.30 million in 2026 to reach USD 277.78 million by 2031, at a CAGR of 6.13% during the forecast period (2026-2031).
Demand is intensifying as premium LED façades on Orchard Road and at Marina Bay Sands deliver high-impact visibility for brands, while programmatic capabilities make inventory more measurable and flexible.[1]Urban Redevelopment Authority, “Orchard Road Rejuvenation Plan,” ura.gov.sg Static formats still dominate today, but digital out-of-home (DOOH) is accelerating at an 8.9% CAGR as advertisers shift budgets toward data-driven media. Robust transit ridership and the USD 8 billion Marina Bay Sands expansion project are unlocking new locations that sustain pricing power above regional peers. The Singapore OOH and DOOH market also benefits from open-banking regulations that encourage fintech spending, although strict Urban Redevelopment Authority (URA) caps on large-format sites constrain supply and keep CPMs elevated.
Key Report Takeaways
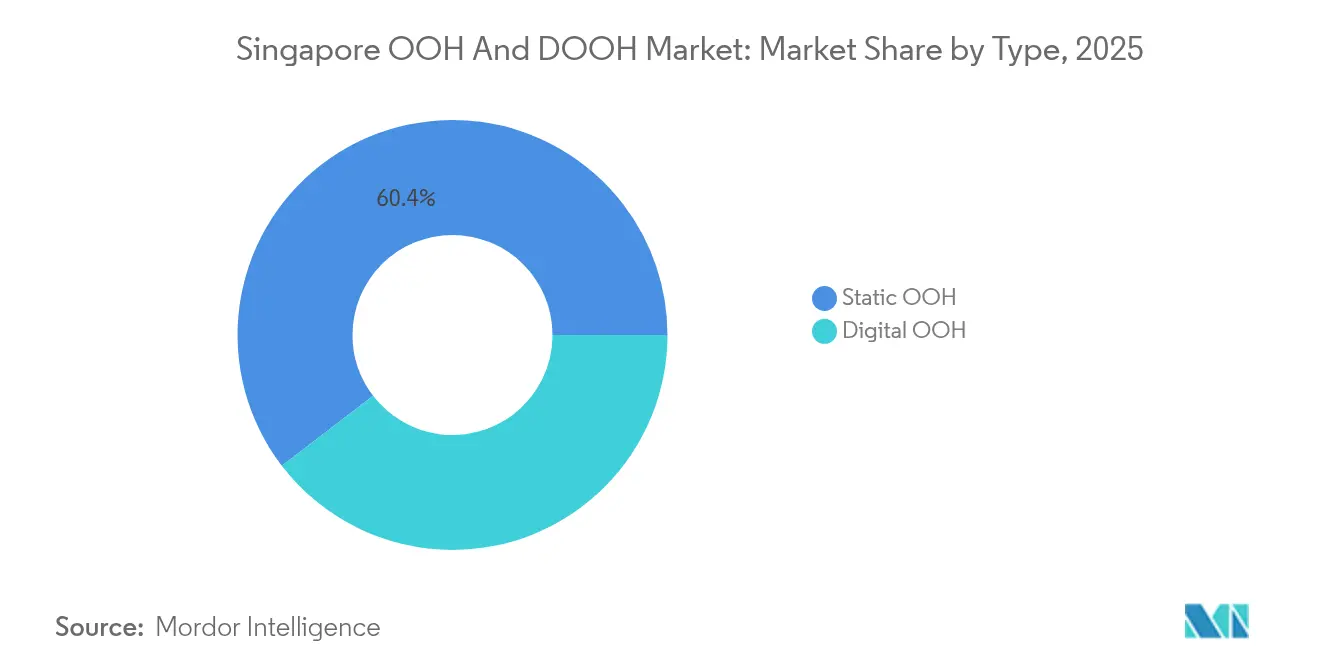
- By type, Digital OOH captured 39.60% revenue in 2025 and is set to grow at an 8.55% CAGR, while Static retained 60.40% of the Singapore OOH and DOOH market share in 2025.
- By format, Transit advertising recorded a 9.12% CAGR outlook and accounted for 25.30% of the Singapore OOH and DOOH market size in 2025.
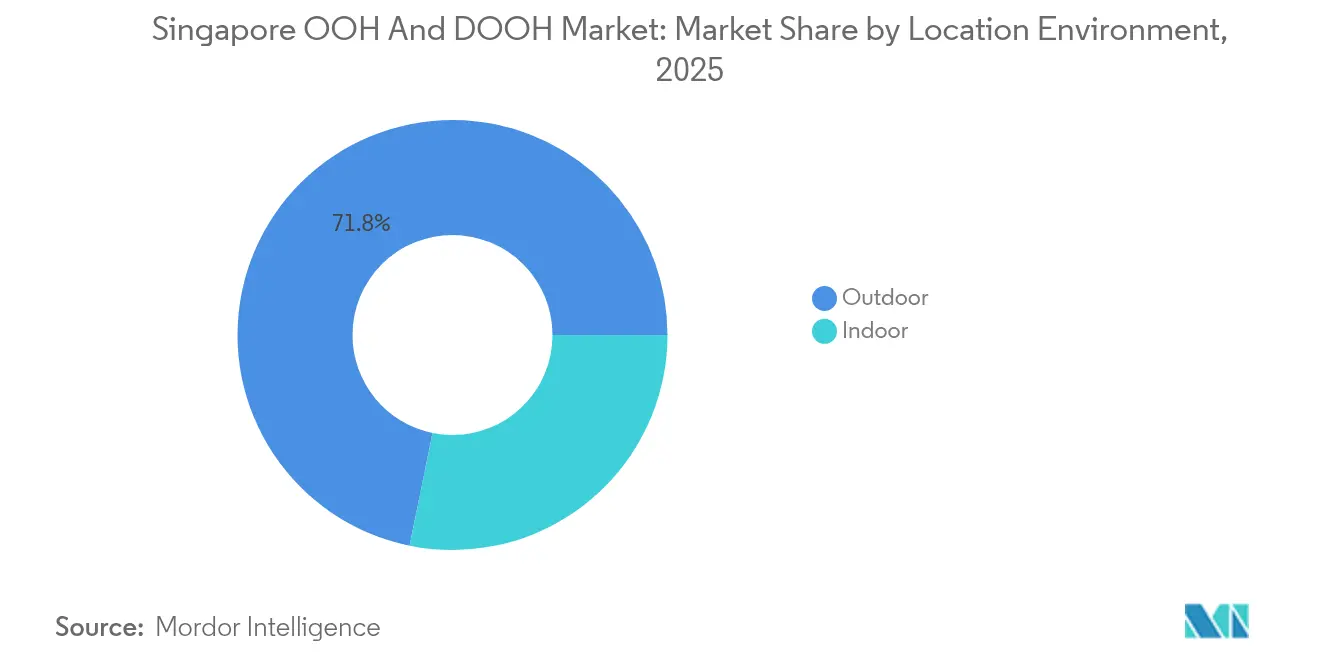
- By location environment, Indoor venues controlled 28.20% share in 2025 and are projected to expand at an 8.34% CAGR through 2031.
- By end-user, Retail and Consumer Goods held 40.30% revenue in 2025; Banking, Financial Services, and Insurance leads growth at an 11.32% CAGR.
Note: Market size and forecast figures in this report are generated using Mordor Intelligence’s proprietary estimation framework, updated with the latest available data and insights as of 2026.
Singapore OOH And DOOH Market Trends and Insights
Drivers Impact Analysis*
| Driver | (~) % Impact on CAGR Forecast | Geographic Relevance | Impact Timeline |
|---|---|---|---|
| Rapid build-out of premium LED façades along Orchard Road and Marina Bay Sands | +1.8% | Central Singapore, with spillover to tourism-heavy areas | Medium term (3-4 yrs) |
| Singapore Changi Airport's Jewel and T5 expansion boosting transit inventory | +1.5% | Eastern Singapore, with global traveler reach | Long term (≥5 yrs) |
| Smart-nation push accelerating programmatic-DOOH adoption by local SMEs | +1.2% | Nationwide, with concentration in business districts | Short term (≤2 yrs) |
| MAS open-banking policy catalysing fintech OOH spend | +1.0% | Central Business District, with spillover to residential hubs | Medium term (3-4 yrs) |
| Data-mingled commuter insights from SBS Transit/SMRT mobile apps | +0.9% | Transit corridors and interchange hubs | Short term (≤2 yrs) |
| Source: Mordor Intelligence | |||
Rapid build-out of premium LED façades
Orchard Road is being repositioned as a lifestyle precinct, and property owners are investing in high-resolution screens that bring cinematic quality to street-level media. The URA’s incentive scheme encourages façade upgrades that will add multiple digital canvases from 2025 onward. Marina Bay Sands will add a new tower and a 15,000-seat arena that together create fresh exterior and interior media zones. These sites attract premium CPMs because they marry high footfall with affluent audiences. Advertisers gain dynamic scheduling, real-time creative swaps, and audience impression guarantees. As a result, DOOH budgets move steadily from static posters into these data-rich premium screens, propelling the Singapore OOH and DOOH market toward higher digital penetration.
Singapore Changi Airport Jewel & T5 expansion
Jewel Changi Airport has matured into a lifestyle destination that blends retail, attractions, and transport, giving brands an immersive platform that reaches residents and travelers alike. Terminal 5, sized for 50 million annual passengers, will launch a wave of transit inventory when operations begin in the next decade. JCDecaux extended its concession through 2034, guaranteeing advertisers a coordinated airport network of 100 digital screens, including the 14-meter-tall Digital Chandelier. The consistent global traveler mix supports long dwell times and high conversion rates, making Changi a core pillar of the Singapore OOH and DOOH market.
Smart-Nation push for programmatic DOOH
Government digitalization programs supply open transport datasets that enhance audience profiling. The Land Transport Authority shares real-time bus movement data, which media owners blend with mobile analytics to build hourly reach curves.[3]Land Transport Authority, “DataMall Datasets,” lta.gov.sg SMEs and local brands now use programmatic dashboards to buy geotargeted impressions at CPMs starting around USD 7, a cost that falls when inventory is purchased during off-peak windows. The lowered entry barrier encourages a broader advertiser base, stimulating incremental spend across the Singapore OOH and DOOH market.
MAS open-banking policy catalysing fintech OOH spend
The Monetary Authority of Singapore’s open-banking framework compels financial institutions to innovate and differentiate. Asset management assets rose to SGD 5.41 trillion (USD 5.41 trillion) in 2024. Fintech challengers respond by purchasing conspicuous OOH placements near MRT interchanges and CBD office towers to reinforce trust. Creative executions often include real-time personal finance data or ESG commitments, aligning brand image with transparency. The outcome is double-digit OOH budget increases within the financial vertical, accelerating overall growth in the Singapore OOH and DOOH market.
Restraints Impact Analysis*
| Restraint | (~) % Impact on CAGR Forecast | Geographic Relevance | Impact Timeline |
|---|---|---|---|
| Stringent Urban Redevelopment Authority cap on large-format sites | -1.2% | Heritage districts and premium urban corridors | Long term (≥5 yrs) |
| High median media-buy CPM versus regional peers (Bangkok, Kuala Lumpur) | -0.8% | Nationwide, particularly affecting price-sensitive advertisers | Medium term (3-4 yrs) |
| Advertising exclusion zones near heritage districts | -0.7% | Chinatown, Little India, Kampong Glam, and other cultural precincts | Long term (≥5 yrs) |
| Source: Mordor Intelligence | |||
Stringent URA cap on large-format sites
Singapore protects visual corridors and heritage skylines by limiting billboard approvals in conservation areas. The Advertising Licensing System now requires digital plan submissions and restricts creatives that impede building aesthetics.[4]Building and Construction Authority, “Advertisement Licensing System Guide,” bca.gov.sg This curtails inventory growth, especially in high-traffic zones like Chinatown and Little India. Supply scarcity sustains price premiums and can deter price-sensitive sectors, slowing the expansion of the Singapore OOH and DOOH market.
High median CPM versus regional peers
Average programmatic CPM remained at USD 7.16 in H1 2024, about 18% higher than Kuala Lumpur rates. Elevated costs arise from limited space, strict content rules, and higher license fees. The Land Transport Authority will soon award a single concession for bus and terminal advertising, which may strengthen pricing power. Smaller advertisers might reduce spend or switch to social media, moderating revenue momentum in the Singapore OOH and DOOH market.
*Our forecasts treat driver/restraint impacts as directional, not additive. The impact forecasts reflect baseline growth, mix effects, and variable interactions.
Segment Analysis
By Type: Digital acceleration underpins revenue migration
The Singapore OOH and DOOH market size for Digital OOH reached USD 76.99 million in 2025 and is forecast to climb at an 8.55% CAGR through 2031. Programmatic trading already accounts for 20% of digital screen revenue, and JCDecaux expects that share to hit 30% by 2025. Dynamic creative optimization allows advertisers to align messaging with weather, traffic, and retail promotions in real time. Static inventory, while still holding 60.40% of the Singapore OOH and DOOH market share in 2025, sees slower 3.85% annual growth thanks to lower CPMs and longer booking cycles. Many static faces in suburban town centers remain attractive for long-term brand presence, yet landlords plan phased LED retrofits that will continue to tilt revenue toward digital formats.
In the Singapore OOH and DOOH market, media owners bundle static posters with digital panels to offer tiered packages that protect legacy assets while promoting high-margin screens. Brands in FMCG and entertainment embrace full-motion video because it yields recall uplifts of up to 30% compared with static. Improved measurement tools, such as audience impression modeling validated by telecom location data, provide advertisers with confidence in the incremental reach delivered by digital. These advances reinforce Digital OOH as the primary driver of incremental spend over the next five years.


By Format: Transit network maximises growth potential
Transit placements generated USD 49.19 million, equal to 25.30% of the Singapore OOH and DOOH market size in 2025, and exhibit the fastest trajectory at a 9.12% CAGR. MRT stations like Raffles Place and Dhoby Ghaut record weekday gate counts above 180,000, offering dense commuter impressions. The Straits Times reports that the Land Transport Authority will appoint a single concessionaire for bus advertising in 2025, allowing package sales across 5,800 buses and 100 terminals. This scale creates cross-line frequency and data-driven route planning, raising the appeal of transit media to national brands.
Billboards remain the largest individual format at 34.10% market share, yet growth lags due to site caps. Street furniture enjoys moderate expansion as Housing and Development Board (HDB) digital screens penetrate residential estates, delivering hyper-local reach at mid-range CPMs. Airport media enjoys premium pricing, and JCDecaux’s global programmatic airport network lets advertisers geofence flight destinations inside one trading console. Collectively, these innovations intensify advertiser interest and sustain the upward curve of the Singapore OOH and DOOH market.
By Location Environment: Indoor venues gain strategic weight
Indoor sites commanded 28.20% revenue in 2025 and are projected to grow at an 8.34% CAGR. Malls such as Ion Orchard and Jewel Changi feature digital walls with average dwell times exceeding 40 minutes, giving advertisers prolonged exposure. Air-conditioned venues also shield equipment from Singapore’s humid climate, improving screen uptime. The Singapore OOH and DOOH market share for indoor media is expected to rise to 32.70% by 2031 as landlords integrate new lobby screens during refurbishment cycles.
Outdoor formats still dominate with 71.80% share thanks to landmark billboards, bus wraps, and over-road gantries that assure mass reach. However, data-driven planning often pairs outdoor assets with indoor screens to build reach and frequency seamlessly. Combined scheduling boosts message recall, especially for launches tied to retail activation. Media owners see higher yield per location when offering packages that cover building exterior facades, atrium LEDs, and lift lobby panels, underscoring the strategic interplay between environments.
By End-User Industry: BFSI takes growth lead over retail mainstay
Retail and Consumer Goods generated 40.30% of 2025 spend, driven by seasonal promotions and product launches in Singapore’s dense mall network. Nevertheless, the Banking, Financial Services, and Insurance vertical is on a steeper 11.32% CAGR as open-banking rules encourage challenger banks to scale brand awareness quickly. Fintech firms use large LED walls in the CBD to highlight security credentials, while established banks showcase sustainability targets on green-themed creative.
Automotive advertisers maintain steady budgets around new model releases, often synchronizing OOH bursts with live-stream roadshows screened on CBD megascreens. Healthcare advertisers leverage place-based screens near clinics and pharmacies, though CPM softness in 2024 hinted at tactical budget optimisations. Overall, diversified vertical demand keeps the Singapore OOH and DOOH market resilient against sector-specific slowdowns.
Geography Analysis
The Central Business District captures the highest CPMs because office workers, expatriates, and tourists converge there daily. The Singapore OOH and DOOH market in the CBD accounted for about 34.60% of national revenue in 2025, with landmark facades such as One Raffles Place commanding monthly rentals of USD 40,000. Orchard Road, already a retail magnet, will benefit from URA’s six-kilometer green corridor, which introduces new pedestrian zones and street furniture ideal for digital panels.
Marina Bay forms the emergent premium cluster, anchored by the Marina Bay Sands expansion. Once the new hotel tower and arena open after 2028, agencies anticipate double-digit CPM uplift on nearby screens owing to sustained visitor growth. The integrated resort will attract MICE delegates, upscale shoppers, and entertainment seekers, broadening the advertiser base from luxury retail to technology conferences.
In suburban heartlands, HDB digital screens and bus-stop posters give brands cost-efficient reach. High residential density means a single HDB town can reach 200,000 residents within a five-minute walk radius. Real-time travel card data allows planners to pinpoint peak evening flows, aligning ad bursts with commuters returning home. Expanding suburban inventory ensures national campaigns achieve full-population coverage within the Singapore OOH and DOOH market.
Competitive Landscape
JCDecaux holds the leading position, controlling extensive airport, bus-shelter and mall networks. Digital revenue accounted for 36.8% of its H1 2024 turnover, reflecting ongoing screen conversion across flagship sites. Clear Channel Singapore focuses on data-enabled packages that integrate mobile retargeting, lifting post-exposure website visits by up to 12%. Both operators enhance programmatic pipes to catch incremental spend from SMEs.
Technology-centric firms such as Moving Walls supply demand-side and supply-side platforms that stitch together smaller inventory owners into one buyable pool. Hivestack partners with screen owners at MRT stations to sell by impression rather than by week, giving media buyers flexible budget control. T-Mobile’s USD 600 million purchase of Vistar Media signals a global appetite for scalable DOOH technology, eventually enriching capabilities available in Singapore. Consolidation continues as Broadsign acquires OutMoove to add dynamic creative tools that appeal to local operators.
Market rivalry also plays out through exclusive concessions. Stellar Lifestyle, the advertising arm of SMRT, introduced Hive Express retail pods at Raffles Place MRT, giving advertisers new shopper engagement points. Moove Media leverages ComfortDelGro’s bus fleet to sell full-wrap campaigns that blanket suburban corridors. As data, programmatic trading and large-venue redevelopment advance, incumbents with capital and technology scale remain best positioned within the Singapore OOH and DOOH market.
Singapore OOH And DOOH Industry Leaders
JCDecaux Singapore Pte Ltd
Clear Channel Singapore Pte Ltd
SPH Media Ltd
Moving Walls Pte Ltd
Vistar Media
- *Disclaimer: Major Players sorted in no particular order

Recent Industry Developments
- January 2025: T-Mobile agreed to acquire Vistar Media for USD 600 million, broadening programmatic DOOH reach.
- January 2025: Las Vegas Sands confirmed a USD 8 billion investment for Marina Bay Sands expansion, construction begins in June 2025.
- November 2024: SPH Media live-streamed the BYD Denza launch on an outdoor megascreen in the CBD.
- September 2024: Stellar Lifestyle launched Hive Express vending pods at Raffles Place MRT.


Research Methodology Framework and Report Scope
Market Definitions and Key Coverage
Our study defines Singapore's out-of-home (OOH) and digital out-of-home (DOOH) market as paid media spend on static billboards, street-furniture panels, transit and place-based screens, plus connected digital networks that deliver dynamic or programmatic content in public spaces both indoors and outdoors. Values track pure media spend, not physical build, production, or agency fees.
Scope Exclusions: We exclude in-cinema ads, experiential activations, and point-of-sale screens that sit inside retail stores.
Segmentation Overview
- By Type
- Static (Traditional) OOH
- Digital OOH
- Programmatic-OOH
- Other DOOH Types
- By Format
- Billboard
- Street Furniture
- Transportation (Transit)
- Airports
- Other Transit (MRT, buses, taxis)
- Place-based Media
- By Location Environment
- Outdoor
- Indoor
- By End-User Industry
- Automotive
- Retail and Consumer Goods
- Healthcare
- BFSI
- Other End Users
Detailed Research Methodology and Data Validation
Primary Research
We interviewed sales heads at media owners, media-buying planners, and brand marketers across retail, mobility, healthcare, and BFSI. Their inputs on fill rates, average loop length, and realistic programmatic premiums helped us close information gaps and align desk findings.
Desk Research
We began with official datasets from the Infocomm Media Development Authority, Land Transport Authority, Urban Redevelopment Authority, and the Department of Statistics to map audience mobility, screen zoning, and currency trends. Rate-card clues came from listed operator filings, while headline campaign volumes were verified through news wires in Dow Jones Factiva and company snapshots on D&B Hoovers. Trade papers from the Out-of-Home Media Association of Singapore and peer-reviewed traffic-count studies provided footfall-to-impression factors. The sources named are illustrative; many others supported data gathering, cross-checks, and thought clarification.
Our desk review also considered regional ad-spend trackers, tender logs on Volza that reveal LED-panel imports, and patent data from Questel to judge technical refresh cycles before fixing useful-life assumptions.
Market-Sizing & Forecasting
We first built the model with a top-down allocation of national advertising outlays into OOH by applying historic share shifts, footfall trends, and average CPM movement. We then sanity-checked totals with a sampled bottom-up roll-up of screen counts × sold minutes × price. Key variables include MRT ridership, Changi passenger traffic, central business district pedestrian counts, digital screen density, and CPI-adjusted CPM drift. Forecasts use multivariate regression blended with scenario analysis, and missing private-network data are bridged through occupancy proxies shared in interviews.
Data Validation & Update Cycle
Each quarter, our analysts run variance tests against independent spend benchmarks, revisit anomalies, and refresh the model annually, with interim updates when regulatory or infrastructure events materially alter drivers.
Why Mordor's Singapore OOH And DOOH Baseline Commands Reliability
When we compare published estimates, we find noticeable gaps because firms juggle different format baskets, pricing ladders, and refresh cadences.
Key Gap Drivers: We observe that some studies drop indoor screens, others fold agency commission into revenue, and a few uplift totals using hardware imports without validating sell-through. Mordor adjusts for all three and revises every year.
Benchmark comparison
| Market Size | Anonymized source | Primary gap driver |
|---|---|---|
| USD 194.39 M (2025) | Mordor Intelligence | |
| USD 164 M (2025) | Regional Consultancy A | Omits indoor venues and applies static CPM averages |
| USD 160.70 M (2022) | Trade Journal B | Combines cinema ads and lacks post-pandemic base refresh |
| USD 300 M (2024) | Industry Research C | Adds agency fees plus hardware sales to media spend |
This comparison shows that, by grounding numbers in current inventory, audited prices, and regularly refreshed variables, Mordor Intelligence gives decision-makers a balanced, transparent baseline they can retrace and replicate.


Key Questions Answered in the Report
What is the current value of the Singapore OOH and DOOH market?
The market is valued at USD 206.3 million in 2026 and is forecast to reach USD 277.78 million by 2031.
Which segment is growing fastest in the Singapore OOH and DOOH market?
Transit advertising shows the highest growth, advancing at a 9.12% CAGR through 2031.
How large is the digital share of the Singapore OOH and DOOH market?
Digital OOH accounted for 39.60% of 2025 revenue and is increasing at an 8.55% CAGR.
Why are CPMs higher in Singapore than in neighboring cities?
Strict site caps and limited space reduce inventory, while affluent audiences sustain premium pricing.
Page last updated on:


