Japan OOH And DOOH Market Size and Share
Market Overview
| Study Period | 2020 - 2031 |
|---|---|
| Forecast Data Period | 2026 - 2031 |
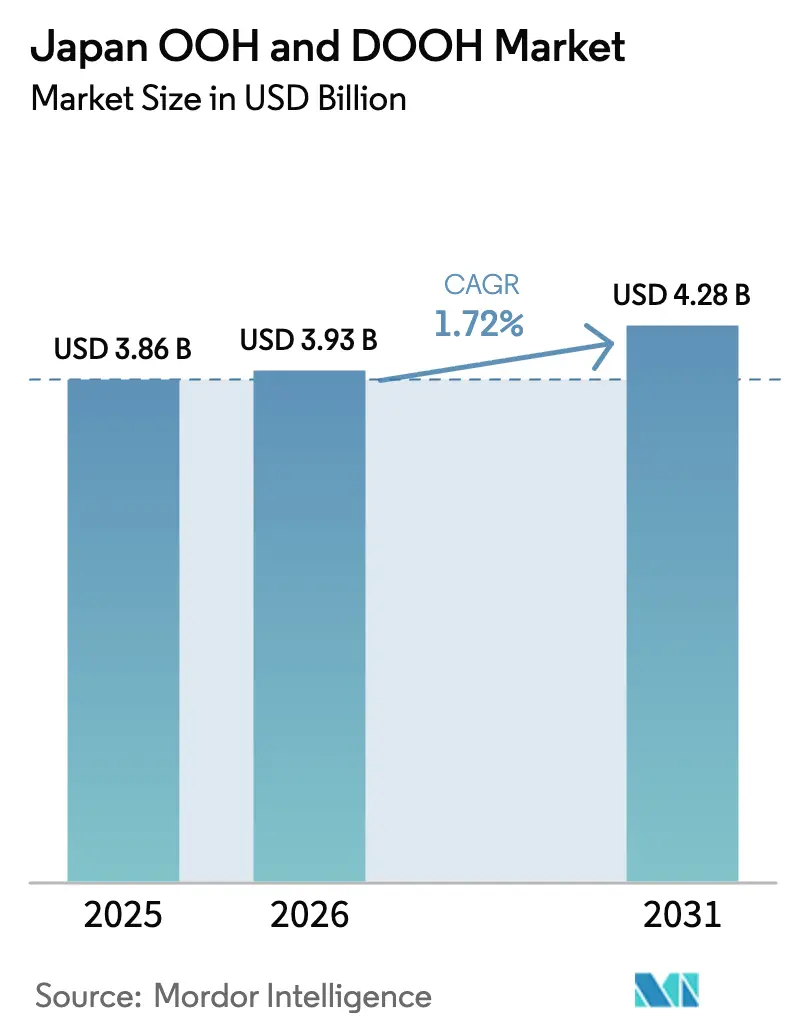
| Base Year Market Size (2025) | USD 3.86 Billion |
| Market Size (2026) | USD 3.93 Billion |
| Market Size (2031) | USD 4.28 Billion |
| Growth Rate (2026 - 2031) | 1.72% CAGR |
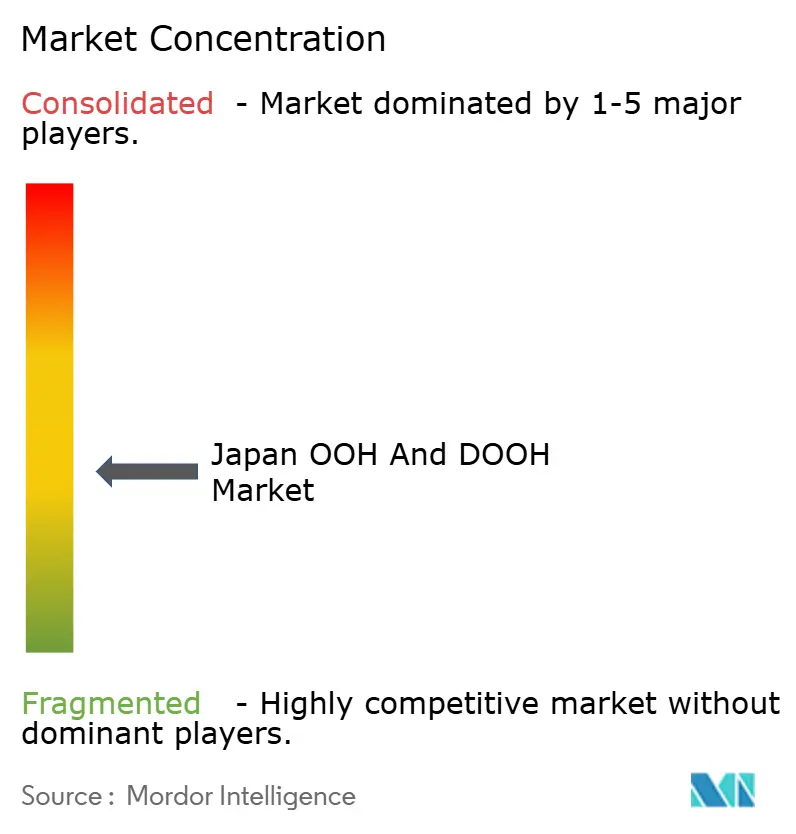
| Market Concentration | Medium |
Major Players *Disclaimer: Major Players sorted in no particular order Image © Mordor Intelligence. Reuse requires attribution under CC BY 4.0. | |
Japan OOH And DOOH Market Analysis by Mordor Intelligence
The Japan OOH and DOOH market size was valued at USD 3.86 billion in 2025 and estimated to grow from USD 3.93 billion in 2026 to reach USD 4.28 billion by 2031, at a CAGR of 1.72% during the forecast period (2026-2031). Static formats continue to supply volume, yet Digital OOH outperforms with a 4.47% CAGR, signaling a gradual share shift toward impression-based buying. Billboards command premium rents because high-visibility intersections such as Shibuya Crossing remain scarce, while the digital upgrade cycle ahead of the Tokyo 2025 World Expo accelerates screen deployments in Osaka’s transit corridors. Rapid 5G rollout is converting location-based transactions to audience-based deals, letting buyers fuse telecom mobility data with programmatic platforms for near-real-time optimisation. Meanwhile, integration of retail media networks with outdoor screens creates omnichannel paths that join in-store first-party data with street-level impressions, lifting measurement precision. Market fragmentation persists top three vendors holding only 20% of inventory, so advertisers still juggle multiple owners to achieve national reach, yet software layers such as MASTRUM start to harmonise buying workflows.
Key Report Takeaways
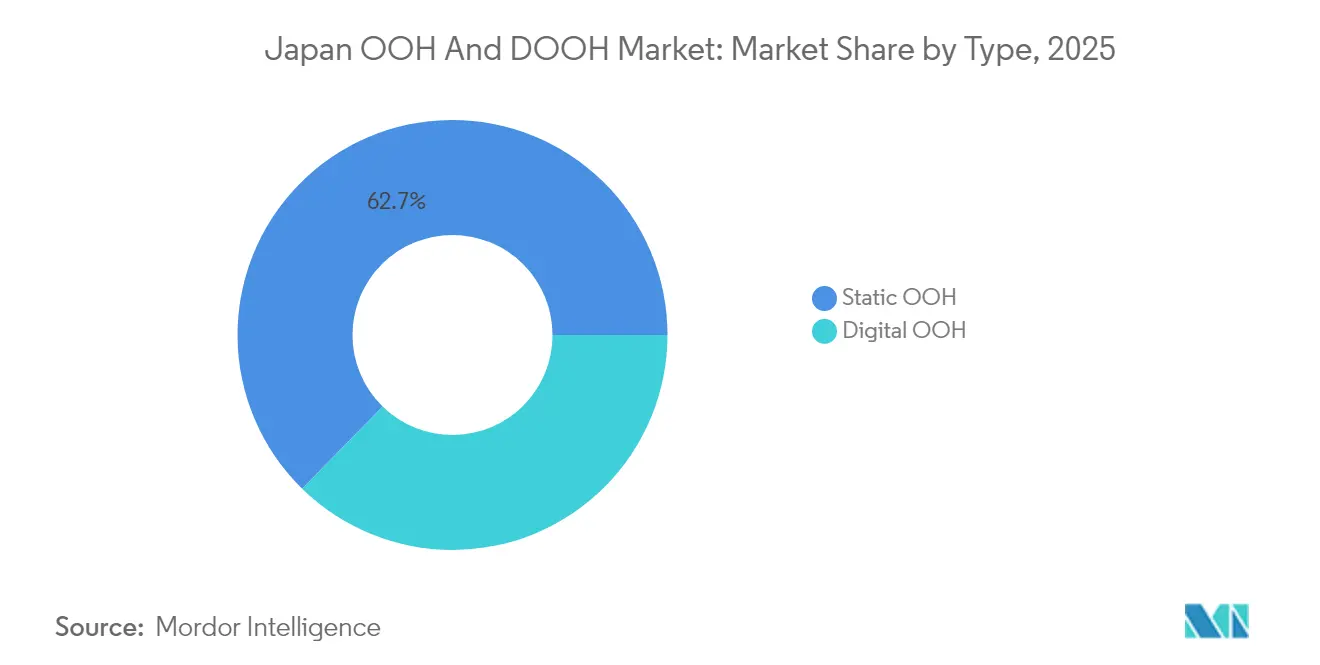
- By type, Static OOH held 62.68% of the Japan OOH advertising market share in 2025, while Digital OOH is advancing at a 4.38% CAGR through 2031.
- By application, billboards generated 46.08% revenue in 2025 and will grow at 2.18% CAGR to 2031.
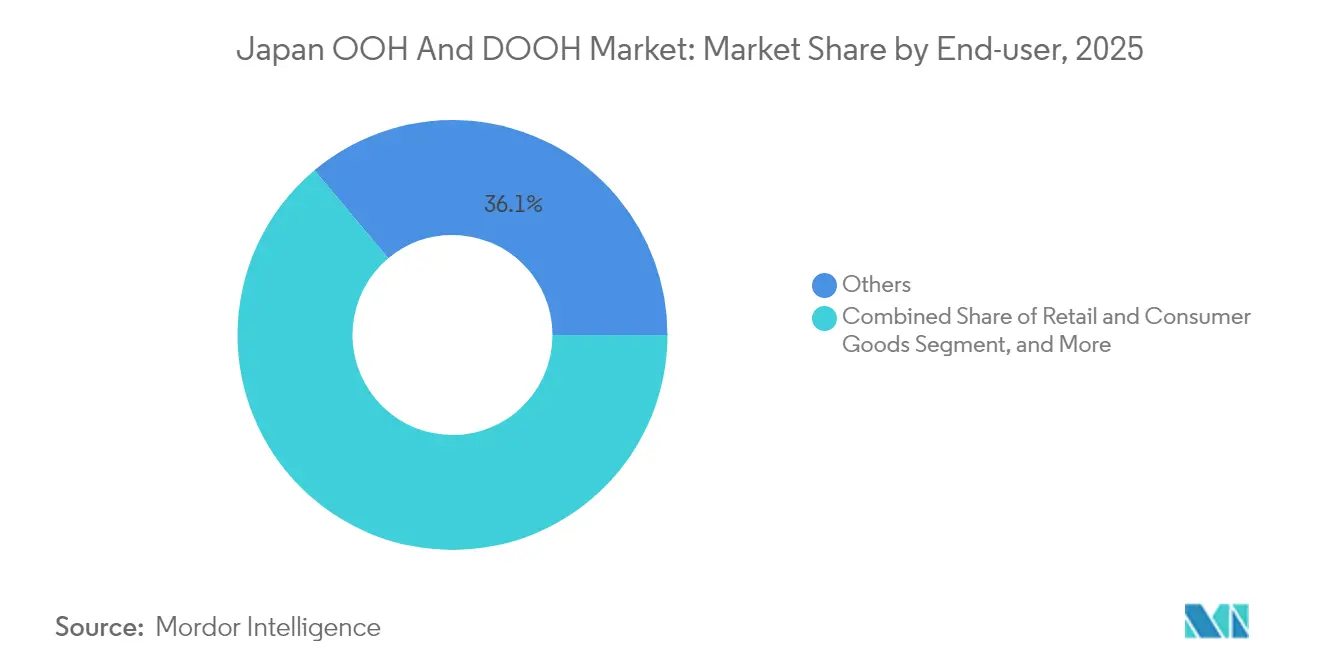
- By end-user industry, the “Others” cluster represented 36.10% share of the Japan OOH advertising market size in 2025, whereas Retail and Consumer Goods is estimated to register the fastest growth with a CAGR 2.15% of by 2031.
Note: Market size and forecast figures in this report are generated using Mordor Intelligence’s proprietary estimation framework, updated with the latest available data and insights as of 2026.
Japan OOH And DOOH Market Trends and Insights
Drivers Impact Analysis*
| Driver | (~) % Impact on CAGR Forecast | Geographic Relevance | Impact Timeline |
|---|---|---|---|
| 5G-enabled programmatic platforms | 0.40% | Nationwide with focus on Tokyo and Kansai | Short term (≤ 2 years) |
| Tokyo 2025 World Expo digital street furniture | 0.30% | Osaka Prefecture and transit routes | Short term (≤ 2 years) |
| Relaxed digital billboard rules in scenic zones | 0.20% | Kyoto, Nara, Hokkaido tourist sites | Medium term (2-4 years) |
| Retail media networks extending outdoors | 0.15% | Major retail districts | Medium term (2-4 years) |
| Source: Mordor Intelligence | |||
5G-enabled Programmatic Transaction Platforms Accelerating Media Buys
LIVE BOARD, the venture between NTT DOCOMO and Dentsu, delivers Japan’s first impression-based Digital OOH exchange by combining anonymised mobile network data with screen playout logs. Its success pushes airport operators and municipal concessionaires to open inventory via openRTB pipes, cutting lead times from weeks to hours and aligning CPM quotes with dynamic audience swell. In April 2025, MCDecaux added 55 screens at Kansai and Osaka International Airports to its programmatic stack, signalling mainstream uptake across transport hubs. Buyers now routinely overlay telecom-verified foot-fall estimates on bid requests, raising effective reach while reducing waste. The capability also boosts accountability because advertisers receive unified post-campaign impression certificates tied to independent telecom counts. Together, these gains underpin the forecast uplift in the Japan OOH advertising market.
Tokyo 2025 World Expo Boosting Digital Street Furniture Expansion
From April 13 to October 13 2025 the Expo expects 28.2 million visitors, driving a fast rollout of weather-proof LCD totems and solar-powered LED shelters along rail lines linking Osaka Bay with Kansai suburbs.[1]Government of Japan, “Expo 2025 Overview,” expo2025.go.jp . Operators secure multiyear concessions that outlive the event, so the installed base of urban screens rises well beyond 2025. Brands booking Expo-era campaigns gain continuity because contracts extend into the legacy period when regional tourism and commuting patterns stay elevated. The Expo’s “Living Lab” theme also provides a testbed for touch-free interfaces and AI-driven creative rotation, setting new benchmarks for contextual relevance. These factors combine to lift demand curves within the Japan OOH advertising market both during and after the event window.
Government Relaxation on Digital Billboard Regulation in Scenic Zones
The Ministry of Land, Infrastructure, Transport and Tourism now allows digital displays in designated scenic districts provided luminance sensors and timed dimming ensure harmony with heritage vistas. [2]Ministry of Land, Infrastructure, Transport and Tourism, “Outdoor Advertising Regulatory Update 2024,” mlit.go.jp . Media owners can therefore monetise tourist foot-paths previously off-limits, such as Kyoto’s Gion and Hokkaido’s ski towns, unlocking premium CPM inventory. Compliance costs remain manageable because LED suppliers offer bezel-less designs and directional louvers that cap light bleeds. Initial permits granted during 2024 already evidence regulator comfort, so incremental screen counts will surface chiefly in Long term (≥ 4 years), nudging incremental revenue into the Japan OOH advertising market.
Retail Media Networks Extending to Outdoor Screens for Omnichannel Reach
Supermarkets and convenience chains now syndicate first-party shopper IDs to external DOOH partners, allowing purchase-based geo-fences around store clusters. LIVE BOARD’s March 2024 “Interactive Delivery Package” uses 71 street-level screens with QR code feedback loops, letting passers-by fetch coupons that travel into their phone wallets. Campaigns achieve clearer attribution because redemption data folds back to the same retailer CRM tables. The result fortifies the omnichannel proposition and widens the buyer base for outdoor inventory, thus feeding volume into the Japan OOH advertising market.
Restraints Impact Analysis*
| Restraint | (~) % Impact on CAGR Forecast | Geographic Relevance | Impact Timeline |
|---|---|---|---|
| Fragmented ownership of prime real estate | -0.25% | Urban commercial districts | Long term (≥ 4 years) |
| Rising electricity tariffs on LED boards | -0.35% | Nation-wide, stronger in Tokyo | Medium term (2-4 years) |
| Source: Mordor Intelligence | |||
Fragmented Ownership of Prime Urban Real Estate Elevating Installation Costs
With top three vendors holding only 20% inventory, agencies still face multi-party negotiations for even modest national roadmaps. The issue deepens in heritage neighborhoods where property plots are subdivided across family trusts, retailers and transport entities, lengthening lease cycles and raising entry costs. Automation layers such as MASTRUM reduce some friction yet cannot over-ride landowner consents, so screen roll-outs lag advertiser demand. Consequently, supply bottlenecks temper the projected expansion of the Japan OOH advertising market.
Rising Electricity Tariffs Eroding LED Board ROI
Japan’s 2024 utility revisions raised average commercial power rates by nearly 14% year-on-year . Large-format LED can draw 9 kWh per square metre daily, so operating margins tighten fastest for independent screen owners that lack volume-based electricity discounts. Some firms retrofit smart dimming or trial rooftop photovoltaic arrays, yet capital intensity slows adoption. Conversational pricing models indexed to kilowatt usage are emerging, but these mechanisms still lift CPM floors, trimming advertiser budgets and putting a minor drag on the Japan OOH advertising market.
*Our forecasts treat driver/restraint impacts as directional, not additive. The impact forecasts reflect baseline growth, mix effects, and variable interactions.
Segment Analysis
By Type: Static Retains Reach While Digital Captures Momentum
Static formats contribute 62.68% of 2025 spend, underpinning broad visibility across commuter rail and municipal poster networks. Traditional posters cost less per play cycle and comply easily with local ordinances, so they remain a staple for FMCG launch bursts. Nevertheless, Digital OOH grows at 4.38% through 2031, driven by programmatic guarantees and rich-media storytelling. Programmatic already underwrites one-quarter of digital impressions, and telecom-data enrichment lifts yield. The Japan OOH advertising market size for digital screens will likely exceed USD 1.67 billion by 2031, reflecting the widening gap in growth paces. Static still posts modest upgrades, chiefly vinyl-to-paper substitutions that pare maintenance outlays, yet share will slip as advertisers chase trigger-based creatives and day-part optimisation.
Second-order signals reinforce the tilt. LIVE BOARD’s NFT sale of a prime Aoyama façade validated alternative transaction models that resonate with digital asset investor.. Meanwhile, municipal tenders increasingly require sustainability metrics, where power-efficient LED packs score higher than paste-up steel frames. These forces keep digital on a compound trajectory and sustain headline growth inside the Japan OOH advertising market.


By Application: Billboards Anchor Brand Fame
Billboards generated 46.08% of 2025 revenue, a statistic that translates to a dominant 2.18% CAGR over the forecast span. High-profile clusters around Electric Street and Dotonbori drive disproportionate impressions, so media owners lift rates well ahead of inflation. The segment commands 1 of every 2 yen spent across the Japan OOH advertising market size for location-based fame. Digital synchronisation elevates impact; Hit Co.’s seven linked screens at Shibuya Station amplify single-creative flights across contiguous sight-lines, allowing brands to stage mass-appeal launches in a format previously limited to static wraps.
Growth tailwinds include computer-vision audience audits that feed into buyer dashboards within 24 hours. These datasets justify rate cards by exposing verified pedestrian impressions, thereby cementing billboard clout. Street furniture and in-train posters expand more gradually, partly because administrative jurisdiction crosses city transport offices, yet they remain important frequency layers in multichannel plans inside the Japan OOH advertising market.
By End-user Industry: Retailers Accelerate Spend
The “Others” basket, a mix of entertainment, telecom and governmental campaigns, captured 36.10% revenue in 2025. Retail and Consumer Goods, however, posts the hottest 2.15% CAGR and is on track to lift its Japan OOH advertising market share once attribution tools tie out-of-home exposure to e-commerce baskets. ITO EN’s Shohei Ohtani takeover across 85 placements demonstrated the halo effect when a beverage brand weaves celebrity, social and DOOH to trigger real-time QR activations. Automotive remains a top-three spender, relying on launch visuals that play well on large-format boards, yet banking and healthcare are closing the gap, enticed by OOH brand-safety certainty compared with volatile online feeds.
Sector rotation looks steady. Retailers will bolt OOH deals into loyalty apps, while pharma cautiously pilots condition-specific day-part creatives. The broader dynamism keeps sector diversity intact and underpins the resilience of the Japan OOH advertising market.
Geography Analysis
Tokyo leads with dense inventory, accounting for an estimated 41.72% of 2025 spend, thanks to iconic clusters at Shibuya Crossing where week-long exclusive flights reach millions of pedestrian impressions. The capital’s saturation makes rental rates the highest nationally, but taxi-screen penetration of 96% supplies incremental mobile reach that smooths frequency curves. Osaka and wider Kansai currently receive expedited funding as Expo 2025 deadlines approach; roughly 500 new digital units are slated for installation by Q1 2025 around Yumeshima and transport interchanges.
Regional nodes such as Nagasaki, Kumamoto and Kagoshima benefit from ANA Trading’s linked airport network, which spreads programmatic access to tier-two cities and nudges advertisers to think beyond the Tokyo-Osaka belt. Hokkaido ski resorts plus Kyoto heritage lanes now test context-sensitive LED with low-glare coatings, taking advantage of eased scenic-zone regulations. Over the forecast horizon, the Japan OOH advertising market will see its geographic revenue mix tilt marginally toward Kansai, yet Kanto remains the anchor due to corporate headquarters density and commuter throngs. Screen proliferation across Shinkansen platforms, ferry terminals and suburban malls extends audience coverage, yet implementation speed depends on local ordinance harmonisation. Municipalities that automate permit submissions through digital portals shorten deployment cycles to as low as 60 days, ensuring the Japan OOH advertising market keeps pace with advertiser appetites even outside established megacities.
Competitive Landscape
Competition remains atomised; the top three vendors collectively manage only 20% inventory, a stark contrast to markets where duopolies exceed 60%. Strategic partnerships therefore become critical. NTT DOCOMO and Dentsu channel telecom analytics into LIVE BOARD, granting it the strongest data spine among pure-play screens. JCDecaux scales through MCDecaux, focusing on transit concessions such as Kansai International, which now syndicates 55 screens programmatically. Hit Co. aligns with Vistar Media to monetise premium Shibuya and Ikebukuro constructs, while Moving Walls and JR East aggregate fragmented rail stock via the MASTRUM platform.
Technology is the fault line that reshapes hierarchies. Operators with bid-stream APIs, AI-powered content verification and power-aware LED suites win longer contracts. Smaller firms grapple with 15-20% cost inflation on replacement parts and electricity, prompting selective asset divestitures that could persuade mid-tier players to merge. Energy-efficient panels confer strategic defence as tariffs rise, giving capitalised incumbents room to negotiate hybrid purchase power agreements.
International entrants keep momentum. Clear Channel tests limited pilot screens through minority joint ventures, gauging regulatory reception to foreign ownership. Domestic agencies meanwhile seek measurement parity; the push for an industry-wide impression currency, now under joint study by JAAA and OAAA-Japan, could shift bargaining power toward networks that supply audited log files. These vectors together shape a competitive mosaic that is both fluid and innovation-centric, reinforcing growth potential for the Japan OOH advertising market.
Japan OOH And DOOH Industry Leaders
Dentsu Inc.
MCDecaux (JCDecaux Group)
LIVE BOARD Inc.
Kyoritz Advertising Agency Co., Ltd.
Hit Co., Ltd.
- *Disclaimer: Major Players sorted in no particular order

Recent Industry Developments
- April 2025: MCDecaux launched programmatic DOOH at Kansai and Osaka International Airports with 55 digital screens and plans to cover bus stops in 10 more cities by mid-2025.
- April 2025: Metro Ad Agency unveiled “Shibuhakobijon,” a 254-inch LED at Shibuya Station’s Ginza Line priced at ¥3,500,000 per week.
- March 2024: LIVE BOARD rolled out the “DOOH Interactive Delivery Package” connecting 71 screens for two-way smartphone engagement.
- February 2024: LIVE BOARD published its “OOH Industry Trend Forecast 2024,” underscoring data-led planning and creative storytelling.


Research Methodology Framework and Report Scope
Market Definitions and Key Coverage
Our study defines Japan's out-of-home (OOH) and digital out-of-home (DOOH) market as the total advertising spend flowing to billboards, street furniture, transit media, and place-based screens, whether static vinyl faces or internet-connected digital panels, situated in publicly accessible locations across Japan. According to Mordor Intelligence, the spend captured includes advertiser net media payments only; agency commissions and creative or production costs sit outside the revenue pool.
Scope exclusion: production, installation, and agency-service fees are expressly left out of the market value.
Segmentation Overview
- By Type
- Static OOH
- Digital OOH
- Programmatic OOH
- Other Digital OOH Types
- By Application
- Billboard
- Transportation
- Airports
- Other Transportation
- Street Furniture
- Other Place-Based Media
- By End-user Industry
- Automotive
- Retail and Consumer Goods
- Healthcare
- Banking, Financial Services and Insurance (BFSI)
- Entertainment and Media
- Other End-user Industries
Detailed Research Methodology and Data Validation
Primary Research
To enrich desk findings, we interviewed media-owner executives, programmatic-platform providers, and brand buyers spread across Kanto, Kansai, and Kyushu, gathering insight on average screen utilization, share of dynamic content, and likely tariff progression. Follow-up surveys with outdoor specialist agencies helped us validate conversion rates between booked gross impressions and net spend, closing critical data gaps before model lock-in.
Desk Research
Mordor analysts began with publicly available anchors such as the Ministry of Internal Affairs and Communications advertising census, the annual Dentsu ad-expenditure report, Japan Outdoor Advertising Association inventory audits, and passenger-kilometer data from the Ministry of Land, Infrastructure and Transport, which together outline spend flows, format splits, and foot-traffic densities. We further mined company filings, investor decks, and press releases of major media owners for disclosed screen counts and occupancy ratios, then checked news archives on Dow Jones Factiva and company financials on D&B Hoovers to verify revenue swing factors and contract renewals. Such sources illustrate volume, tariff ranges, and regulatory shifts; many additional references, though not listed here, were reviewed to strengthen context and cross-checks.
Market-Sizing & Forecasting
The baseline was first re-created top-down by reconciling declared OOH spend in official ad-spend statistics with import-export records for large-format LED modules and local build cost proxies, which are then adjusted for typical media-owner margins. We corroborated totals through a selective bottom-up roll-up of leading operator revenues and sampled average selling price multiplied by occupied face-months. Key variables steering the model include: 1) net new digital screen installations, 2) average yield per thousand impressions, 3) urban mobility indices, 4) regulatory limits on illumination and content length, and 5) brand-side mix-shift toward programmatic buying. Forecasts rely on multivariate regression linking spend to GDP growth, commuter footfall, and digital-screen penetration, with scenario bounds reviewed by our primary respondents. Where minor operator data were absent, we applied utilization coefficients derived from audited peers and flagged the assumption for periodic re-validation.
Data Validation & Update Cycle
Outputs pass a multi-layer review, peer analyst checks, senior-analyst anomaly sweeps, and model stress testing against external macro and media-pricing indicators. We refresh the dataset annually, with interim revisions triggered by material events such as rule changes on digital signage brightness or Olympic-related infrastructure additions.
Why Mordor's Japan OOH And DOOH Benchmarks Command Reliability
Published market numbers rarely align because firms choose different inventory scopes, valuation bases, and refresh cadences. Our team openly states inclusions, grounds projections in verifiable variables, and revisits the model every twelve months, which keeps our baseline current and transparent.
Key gap drivers versus other publishers stem from their focus on either digital-only spend, narrower format baskets, unverified average selling prices, or once-off historical snapshots that remain unadjusted for yen fluctuations.
Benchmark comparison
| Market Size | Anonymized source | Primary gap driver |
|---|---|---|
| USD 3.86 bn (2025) | Mordor Intelligence | - |
| USD 2.95 bn (2024) | Global Consultancy A | excludes indoor place-based media and uses static tariff averages |
| USD 1.17 bn (2024) | Industry Journal B | tracks digital screens only, omits static formats |
| USD 1.27 bn (2024) | Trade Study C | digital-only scope and relies on self-reported impression data |
In sum, our disciplined scope selection, dual-approach modeling, and frequent updates give decision-makers a balanced, reproducible baseline that they can trace back to clear variables and real-world checks.


Key Questions Answered in the Report
What is the current value of the Japan OOH advertising market?
It stands at USD 3.93 billion in 2026 and is projected to climb to USD 4.28 billion by 2031.
How fast is Digital OOH growing in Japan?
Digital formats are expanding at a 4.38% CAGR between 2026 and 2031, more than double the overall market pace.
Which segment holds the largest Japan OOH advertising market share?
Billboards lead with 46.08% revenue share in 2025 thanks to high-visibility locations.
Why is the Tokyo 2025 World Expo important for advertisers?
The Expo will draw 28.2 million visitors and spurs new digital street furniture installations, enlarging premium inventory.
Page last updated on:


