United Kingdom OOH and DOOH Market Size and Share
Market Overview
| Study Period | 2020 - 2031 |
|---|---|
| Forecast Data Period | 2026 - 2031 |
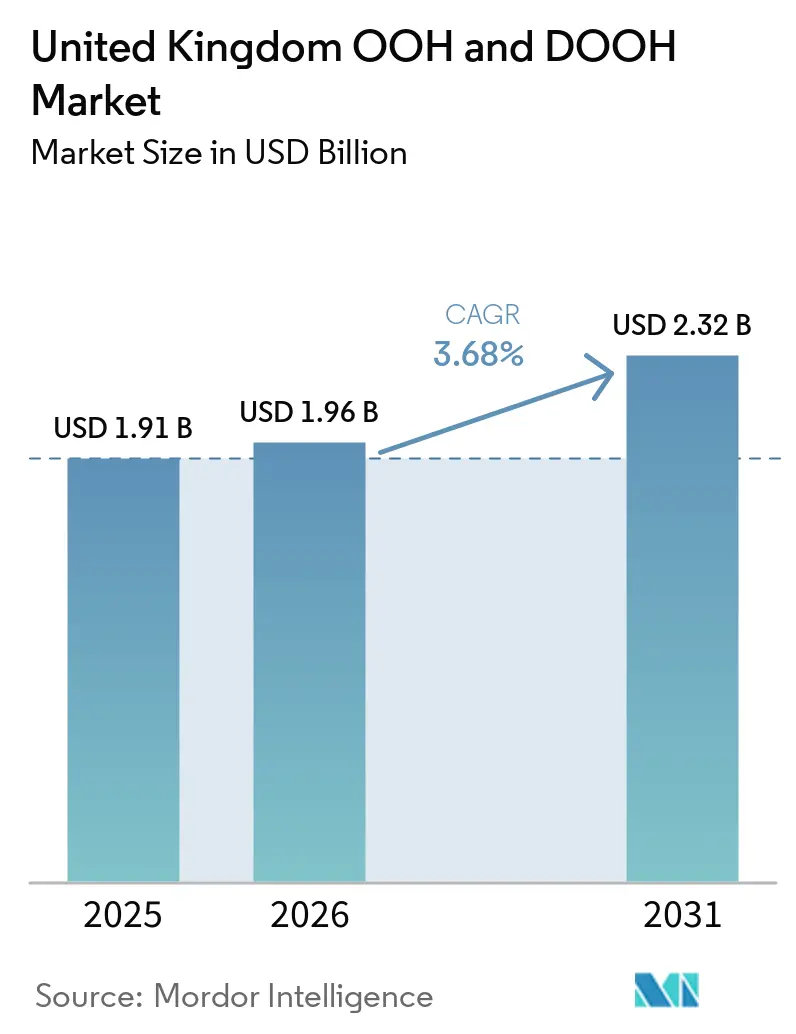
| Base Year Market Size (2025) | USD 1.91 Billion |
| Market Size (2026) | USD 1.96 Billion |
| Market Size (2031) | USD 2.32 Billion |
| Growth Rate (2026 - 2031) | 3.68% CAGR |
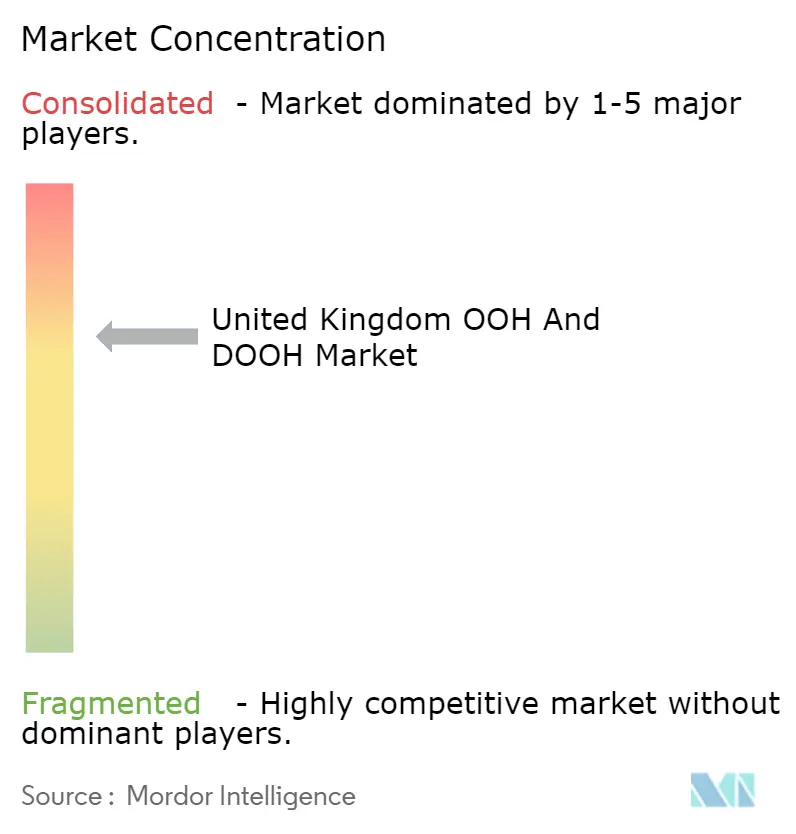
| Market Concentration | Medium |
Major Players *Disclaimer: Major Players sorted in no particular order Image © Mordor Intelligence. Reuse requires attribution under CC BY 4.0. | |
United Kingdom OOH and DOOH Market Analysis by Mordor Intelligence
The United Kingdom OOH and DOOH market size is expected to grow from USD 1.91 billion in 2025 to USD 2.1.96 billion in 2026 and is forecast to reach USD 2.32 billion by 2031 at 3.68% CAGR over 2026-2031. Demand is tilting toward digitized screens as programmatic trading covers nearly half of all campaigns, while digital formats already command almost two-thirds of total inventory. Major grocers, pharmacies and fuel-station chains are integrating their own screens with roadside and transit networks to create national omnichannel reach that rivals television. Airports are scaling premium formats as Heathrow and Gatwick inject multi-billion-dollar terminal upgrades, and Transport for London’s eight-year contracts are expanding immersive assets that invite higher CPMs. Energy-efficiency retrofits, smart-city infrastructure and first-party data linkages are now central to operator profitability and advertiser targeting, even as hybrid work and measurement gaps temper weekday impression volumes.
Key Report Takeaways
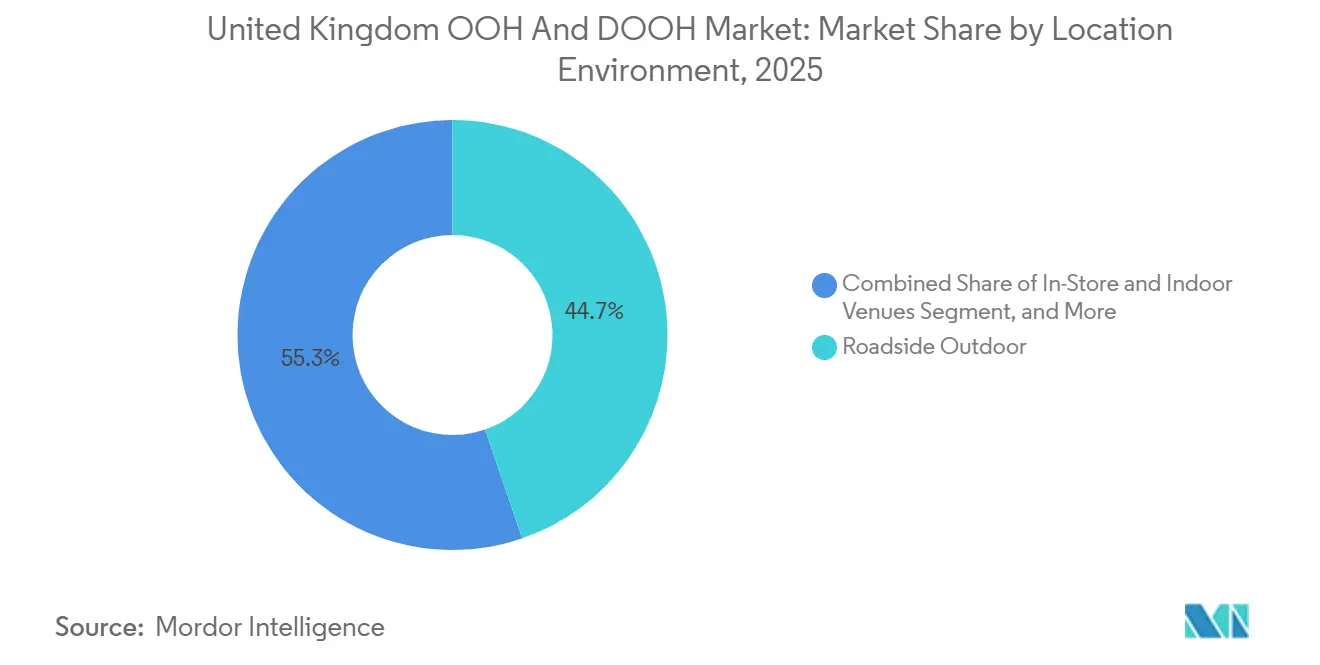
- By location environment, roadside outdoor led with 44.74% share of the UK OOH and DOOH market in 2025, while airports are projected to expand at a 4.23% CAGR to 2031.
- By application, billboards controlled 39.96% of the United Kingdom OOH and DOOH market size in 2025 and transit applications are advancing at a 4.38% CAGR through 2031.
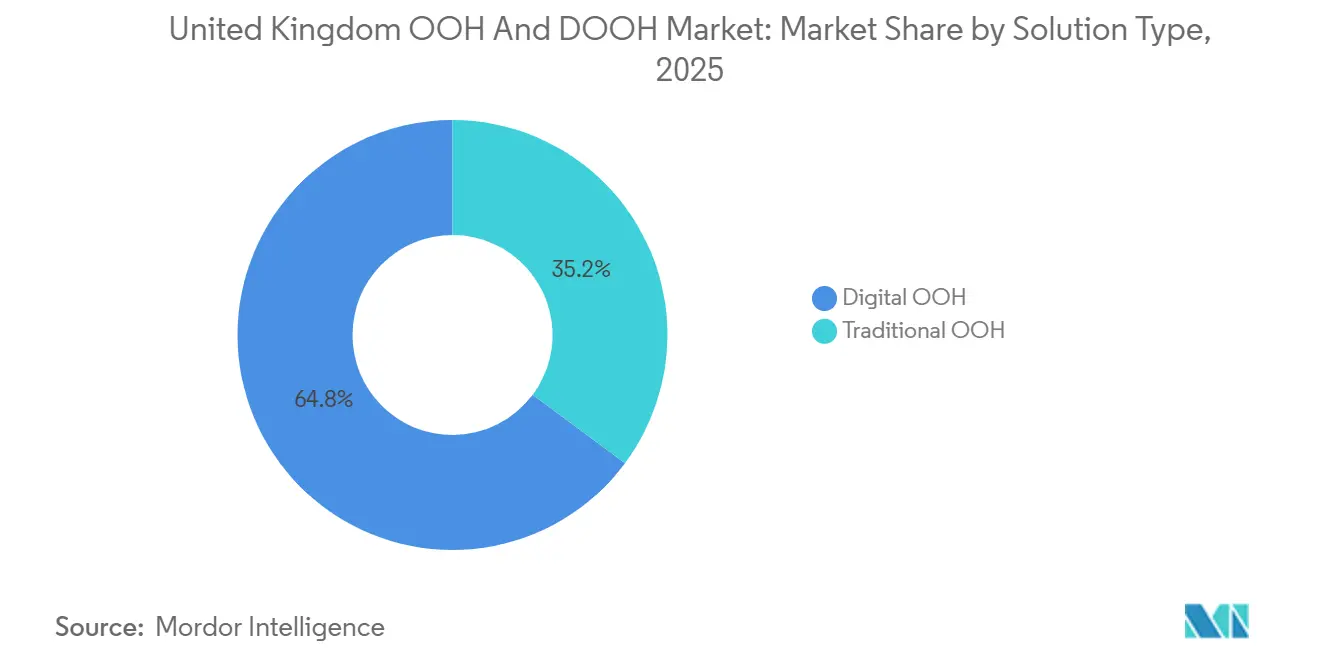
- By solution type, digital OOH captured 64.83% of the United Kingdom OOH and DOOH market share in 2025 and is poised to grow at a 3.81% CAGR to 2031.
- By end-user industry, retail held 24.87% share in 2025, whereas healthcare is the fastest riser at a 4.46% CAGR over the same horizon.
Note: Market size and forecast figures in this report are generated using Mordor Intelligence’s proprietary estimation framework, updated with the latest available data and insights as of January 2026.
United Kingdom OOH and DOOH Market Trends and Insights
Drivers Impact Analysis*
| Driver | (~) % Impact on CAGR Forecast | Geographic Relevance | Impact Timeline |
|---|---|---|---|
| Rapid Expansion of Programmatic Trading Platforms Among UK Media Buyers | +1.2% | National, led by London, Manchester, Birmingham | Medium term (2-4 years) |
| Growth of Smart-City Digital Infrastructure in Major UK Metropolitan Areas | +0.9% | London, Manchester, Birmingham, Edinburgh | Long term (≥ 4 years) |
| Integration of Data-Driven Audience Targeting via Mobile Location Analytics | +0.8% | National, strongest in transit and airport hubs | Short term (≤ 2 years) |
| Retail Media Networks Extending OOH Partnerships for Omnichannel Campaigns | +0.7% | National supermarket footprints | Medium term (2-4 years) |
| Rising Airport-Terminal Redevelopments Ahead of 2030 Net-Zero Aviation Targets | +0.5% | Heathrow, Gatwick, Manchester, Edinburgh | Long term (≥ 4 years) |
| London Underground Digital Roll-Out Driving Premium CPMs and Advertiser Adoption | +0.6% | Greater London network | Medium term (2-4 years) |
| Source: Mordor Intelligence | |||
Rapid Expansion of Programmatic Trading Platforms Among UK Media Buyers
Programmatic penetration has lifted to 47% of UK campaigns, up 18 percentage points year-on-year, as VIOOH, Hivestack, Broadsign, and Place Exchange standardize biddable access to roadside, transit, and retail screens.[1]“State of the Nation 2024 - UK Market Highlights,” VIOOH, viooh.com Programmatic-guaranteed deals still dominate, but non-guaranteed volumes are scaling quickly, echoing online display behavior. OOH specialist agencies now manage almost four-fifths of programmatic budgets, reflecting a pivot toward data-driven planning. With 91% of advertisers prioritizing audience over location, investment is being re-routed from other digital channels rather than expanding total spend. This shift is redefining operator differentiation around first-party data, dynamic creative optimization, and supply-side platform partnerships.
Growth of Smart-City Digital Infrastructure in Major UK Metropolitan Areas
City councils are embedding screens into public assets to fund connectivity roll-outs. Manchester’s 10-year GBP 70 million (USD 89 million) concession prioritizes large-format digital panels, and London’s Connected London program adds thousands of small cells and fiber back-haul to support real-time DOOH. BT Street Hubs blend 75-inch screens with public Wi-Fi, while Havering’s 7-year deal with JCDecaux installs panels fitted with air-quality sensors. Transport for London stipulates LED conversions that cut power use 60% and align with its 2030 net-zero goal. Infrastructure-first deployment speeds permit approvals, shortens payback periods and hooks DOOH growth to municipal sustainability agendas.
Integration of Data-Driven Audience Targeting via Mobile Location Analytics
Global’s “Access All Audiences” harnesses anonymized Transport for London journey data alongside TGI and YouGov attributes, letting brands reach cohorts such as business travelers or suburban families with precision at 1,000 new screens.[2]“Global wins TfL contract,” Global Media, global.com Retailers follow suit: Tesco’s Clubcard insights, covering 20 million households, fuel in-store and forecourt messaging that rivals broadcast reach. Privacy-compliant first-party data dodges UK GDPR hurdles tied to mobile ad IDs and produces CPM premiums over unverified roadside impressions. Yet 51% of buyers report skill gaps around dynamic creative, exposing an execution lag even as data access accelerates.
Retail Media Networks Extending OOH Partnerships for Omnichannel Campaigns
UK retail media spend is forecast to top GBP 1 billion (USD 1.27 billion) in 2025, with supermarkets installing thousands of screens to capture brand budgets once reserved for television.[3]“Retail media spend to surpass £1bn,” IAB UK, iabuk.com Tesco, Sainsbury’s, Boots and Asda now deliver national OOH reach inside stores and forecourts. Operators such as Clear Channel and Ocean Outdoor co-sell roadside and retail placements, enabling sequential messaging from commute to point-of-purchase. Return-on-ad-spend metrics average GBP 6.60 (USD 8.40) for every pound invested, incentivizing brands to shift media mixes. Fragmented measurement across separate networks, however, forces advertisers to juggle multiple dashboards, curbing cross-network campaign scale.
Restraints Impact Analysis*
| Restraint | (~) % Impact on CAGR Forecast | Geographic Relevance | Impact Timeline |
|---|---|---|---|
| Measurement-Standardization Gaps Across Multiple OOH Owners Hindering Cross-Network ROI Reporting | -0.8% | National multi-network buys | Short term (≤ 2 years) |
| High Energy Costs Pressuring DOOH Operating Margins Post-2022 Price Shocks | -0.7% | National, acute for large-format screens | Medium term (2-4 years) |
| Community and Council Restrictions on New Digital Screens to Protect Heritage Sites | -0.4% | Westminster, Camden, Bath, York | Long term (≥ 4 years) |
| Declining Roadside Traffic During Hybrid Work Weeks Reducing City-Centre Impression Volumes | -0.6% | London, Manchester, Birmingham CBDs | Medium term (2-4 years) |
| Source: Mordor Intelligence | |||
Measurement-Standardization Gaps Across Multiple OOH Owners Hindering Cross-Network ROI Reporting
Route’s audience currency delivers reach and frequency, yet programmatic trades on impression-based CPMs, leaving planners to reconcile two incompatible frameworks.[4]“Industry news and data,” Outsmart, outsmart.org.uk Advertisers, therefore, default to single-operator deals, chilling open-exchange liquidity and limiting optimization. Industry bodies are piloting OpenDirect and OpenRTB for DOOH, but the lack of a unified, UK GDPR-compliant attribution system delays decision-grade reporting. The result is slower budget allocation to cross-network campaigns, despite evidence that OOH drives double-digit uplifts in smartphone actions.
High Energy Costs Pressuring DOOH Operating Margins Post-2022 Price Shocks
Non-domestic electricity averaged 24.66 pence per kWh in Q4 2024, 33% higher than 2021, inflating screen operating costs by up to 40%.[5]“Energy price cap and tariff data,” Ofgem, ofgem.gov.uk Premium formats consume heavy power, and mid-tier operator 75Media collapsed in November 2025 after failing to offset elevated utility bills despite 454% revenue growth. Market leaders are installing lower-draw LEDs and solar arrays, but these capex demands lengthen payback periods and give scale operators a bargaining edge in energy contracting, accelerating consolidation.
*Our forecasts treat driver/restraint impacts as directional, not additive. The impact forecasts reflect baseline growth, mix effects, and variable interactions.
Segment Analysis
By Solution Type: Digital Formats Consolidate Leadership
Digital OOH claimed 64.83% of United Kingdom OOH and DOOH market share in 2025 and is projected to widen its lead at a 3.81% trajectory. Programmatic channels already handle 47% of campaigns, diverting spend from static panels toward biddable inventory where creative and targeting can refresh in real time. JCDecaux doubled its London digital footprint to 2,000 screens, while Global’s rail estate adds immersive curved LEDs, actions that enlarge the United Kingdom OOH and DOOH market size allocated to premium formats. Traditional OOH persists where landlords or planning rules restrict digital roll-outs, and its lower energy consumption retains value for long-dwell brand campaigns. Sustainability pledges, such as printing on recycled paper with vegetable inks, help classic billboards defend share against energy-intensive LEDs.
Retrofitting efficiency upgrades is accelerating, with Transport for London mandating 60% power cuts through LED conversions. Supply-side platform consolidation, typified by Broadsign’s purchase of Place Exchange, promises unified programmatic pipes that could unlock untapped mid-market screens for national buys. Advertiser capability remains the bottleneck: half the buyer community still lacks dynamic creative competencies, suggesting education will be as decisive as infrastructure in determining future share gains for digitized formats.


By Application: Transit Accelerates on Captive Dwell Times
Billboards represented 39.96% of the United Kingdom OOH and DOOH market in 2025, yet transit inventory is expanding fastest at 4.38% a year as contracts with Transport for London and Network Rail pump more than 1,000 new screens into stations. The Elizabeth line alone adds 329 sites, while 160-meter multi-sensory travelator takeovers at Waterloo illustrate the premium CPMs that immersive environments secure. Commuters’ average 25-minute dwell delivers attentive exposures that outperform brief roadside glances, elevating advertiser ROI and boosting the UK OOH and DOOH market size attributed to transit nodes.
Street-furniture upgrades complement this surge, with 4,700 bus shelters under LED conversion, and interactive touchscreens at London Bridge supplying live travel data in 11 languages to heighten engagement. Regulatory shifts, including the 2026 high-fat-salt-sugar advertising watershed, require geo-filters and schedules that digital screens can enact instantaneously, incentivizing further digitization of transit assets. Large-format billboard landlords respond by locking in 99-year leases that embed digital rights, demonstrating that while transit outpaces in growth, roadside owners are future-proofing through very long concessions.
By Location Environment: Airport Screens Capture Premium Audiences
Roadside outdoor continued to dominate with 44.74% share in 2025, but airport media is projected to compound at 4.23% through 2031 on the back of Heathrow’s GBP 1.3 billion (USD 1.65 billion) and Gatwick’s GBP 1.874 billion (USD 2.38 billion) upgrade programs aligned with 2030 carbon targets. Heathrow welcomed 83.9 million passengers in 2024, yielding affluent, international audiences that justify double-digit CPM uplifts and increase the United KingdomOOH and DOOH market size attributed to aviation. Gatwick’s northern-runway expansion could lift capacity to 75 million passengers, doubling advertiser reach within a decade.
Shopping malls and in-store venues enjoy spillover growth as retail media networks roll out thousands of screens nationwide, pushing omnichannel campaigns beyond city centers into community catchments. Suburban roadside and retail hubs gain further importance as hybrid work patterns curb weekday central business-district footfall. Heritage restrictions in Westminster and Bath constrain new digital roadside units, redirecting operator capex toward airport terminals and smart-city street furniture in less sensitive boroughs.

By End-User Industry: Healthcare Budgets Shift Toward Contextual Reach
Retail remained the largest buyer at 24.87% share in 2025, leveraging its own screen networks to close the loop from awareness to purchase. Pharmaceutical and public-health advertisers are, however, the fastest movers, growing at 4.46% annually as the National Health Service deploys campaigns like “Think Pharmacy First” across pharmacy-adjacent screens. U.S. case studies showing 78% post-exposure actions reinforce OOH’s suitability for health prompts near hospitals and transport hubs, and this momentum is lifting the United Kingdom OOH and DOOH market share attributed to healthcare.
Automotive brands adopt EV-centric placements at charging points, while challenger banks such as Monzo employ rail station takeovers for mass reach. The common thread is data-enabled targeting that aligns messages with journey context: whether a consumer is topping up an EV, waiting for a prescription or commuting into work, real-time scheduling and creative triggers match mind-set with media, feeding cross-channel attribution loops that raise advertiser confidence.
Geography Analysis
London commanded roughly 40-45% of 2025 spend owing to dense premium transit estates and affluent roadside corridors. JCDecaux’s added 1,000 screens and Wildstone’s USD 101 million 99-year lease cement the capital’s leadership. Yet weekday footfall remains 15-20% below 2019, and strict planning rules inside heritage boroughs throttle incremental supply. Operators therefore pivot to suburban retail forecourts, airport terminals and weekend leisure hubs where volumes rebound faster.
Regional cities log faster percentage growth. Manchester’s 10-year contract with Ocean Outdoor anchors a USD 89 million screen refresh tied to the council’s 2038 net-zero goal. Leeds, Bristol and Nottingham gained 31 roadside LED sites through 75Media’s acquisition spree, broadening national reach into northern and Midlands commuter belts. Scotland’s Edinburgh and Glasgow leverage airport redevelopments and smart-city deployments to lure national advertisers seeking cost-efficient impressions outside London.
Rural and suburban catchments benefit from supermarket and pharmacy screen roll-outs, ensuring that the UK OOH and DOOH market can now deliver omnichannel continuity from village forecourt to city center. The national fiber and 5G build-out under Building Digital UK removes latency bottlenecks, allowing programmatic bidders to activate real-time triggers equally in Cumbria or Camden, flattening the historical London bias over the forecast horizon.
Competitive Landscape
Four incumbents, JCDecaux, Global, Clear Channel and Ocean Outdoor, control about 80% of premium inventory, yet over 20 smaller firms hold niche assets, creating a dual-speed structure. Scale players leverage ISO-certified data security, renewable-energy commitments and public-service amenities such as defibrillators to secure decade-long municipal concessions. Mid-tier specialists chase retail, cinema or motorway niches but face margin stress from elevated energy bills and landlord dependencies, a fragility underscored by 75Media’s 2025 liquidation.
Technology is the strategic hinge. Supply-side platforms like VIOOH, Hivestack and the enlarged Broadsign-Place Exchange entity aggregate screens into biddable pools, commoditizing raw reach. Differentiation is migrating toward data depth, with Global’s TfL database and Tesco’s Clubcard insights commanding premiums. Consolidation is likely to accelerate as capital-intensive energy upgrades and programmatic integration favor players with balance-sheet heft.
Retail media networks emerge as competitive disruptors by internalizing both media sales and first-party shopper data. Traditional OOH operators counter by forming revenue-share alliances or embedding experiential formats—such as Global’s multi-sensory Waterloo travelator—to preserve CPM advantages. The next competitive battleground will revolve around unified, GDPR-compliant measurement that can link Route exposures to mobile and in-store outcomes, unlocking true cross-network optimization.
United Kingdom OOH and DOOH Industry Leaders
JCDecaux UK
Clear Channel UK
Global (Outdoor + Ex-Primesight)
Ocean Outdoor UK
Alight Media
- *Disclaimer: Major Players sorted in no particular order

Recent Industry Developments
- January 2026: JCDecaux began activating the first 500 of 670 new 86-inch bus-shelter screens across London, featuring 20% lower power draw.
- December 2025: Broadsign completed its acquisition of Place Exchange, creating a supply-side platform spanning 1.8 million screens worldwide.
- November 2025: Multiply Media Group bought London Lites, adding 65 premium signs such as The Cube on Oxford Street to launch the Backlite UK brand.
- November 2025: 75Media entered voluntary liquidation after failing to renew its primary landlord agreement despite 454% revenue growth.


United Kingdom OOH and DOOH Market Report Scope
The study tracks advertising spending in various Out-of-Home (OOH) formats, including billboards (including city-light boards), street furniture (like city-light posters), transit and transportation (ads on or in public transport), and place-based media (located at the point of sale). It focuses on both digital and static ads, indoors and outdoors, covering spots like malls, airports, streets, and transit hubs. Notably, the study excludes agency commission costs and production expenses from its scope.
The United Kingdom OOH and DOOH Market Report is Segmented by Solution Type (Traditional OOH, and Digital OOH [Programmatic-DOOH, and Non-Programmatic-DOOH]), Application (Billboard, Transit, Street Furniture, and Other Applications), Location Environment (Roadside Outdoor, Airports, Malls and Transit Hubs, In-Store and Indoor Venues, and Other Location Environments), End-User Industry (Automotive, Retail, Healthcare, Banking and Financial Services, Media and Entertainment, and Other End-User Industries), and Geography. The Market Forecasts are Provided in Terms of Value (USD).
| Traditional OOH | |
| Digital OOH | Programmatic-DOOH |
| Non-Programmatic-DOOH |
| Billboard |
| Transit |
| Street Furniture |
| Other Applications |
| Roadside Outdoor |
| Airports |
| Malls and Transit Hubs |
| In-Store and Indoor Venues |
| Other Location Environments |
| Automotive |
| Retail |
| Healthcare |
| Banking and Financial Services (BFSI) |
| Media and Entertainment |
| Other End-User Industries |
| By Solution Type | Traditional OOH | |
| Digital OOH | Programmatic-DOOH | |
| Non-Programmatic-DOOH | ||
| By Application | Billboard | |
| Transit | ||
| Street Furniture | ||
| Other Applications | ||
| By Location Environment | Roadside Outdoor | |
| Airports | ||
| Malls and Transit Hubs | ||
| In-Store and Indoor Venues | ||
| Other Location Environments | ||
| By End-User Industry | Automotive | |
| Retail | ||
| Healthcare | ||
| Banking and Financial Services (BFSI) | ||
| Media and Entertainment | ||
| Other End-User Industries | ||


Key Questions Answered in the Report
How large will paid media spend on programmatic screens be in the UK OOH and DOOH market by 2031?
Programmatic activity is forecast to grow faster than overall spend, supporting a 3.68% CAGR that takes total market value to USD 2.32 billion by 2031.
Which application type is expected to expand quickest over the next five years?
Transit formats are projected to grow at a 4.38% CAGR through 2031 as rail, metro and airport operators install thousands of new digital screens.
Why are airports gaining share within national out-of-home budgets?
Multi-billion-dollar terminal upgrades at Heathrow and Gatwick embed large-format LEDs that reach affluent, international travelers and command premium CPMs.
How are energy prices influencing operator strategy?
Elevated commercial electricity rates drive investments in low-draw LEDs, solar arrays and long-duration power-purchase agreements to protect margins.
What measurement challenge most limits cross-network campaigns today?
Advertisers must reconcile Route's reach metrics with programmatic impression counts, a mismatch that hampers unified ROI reporting and slows budget flow.
Which industry sector is rising fastest as an advertiser in out-of-home?
Healthcare campaigns, boosted by National Health Service initiatives and pharmaceutical brands, are advancing at a 4.46% CAGR to 2031.
Page last updated on:


