Next Generation Firewall Market Size and Share
Market Overview
| Study Period | 2020 - 2031 |
|---|---|
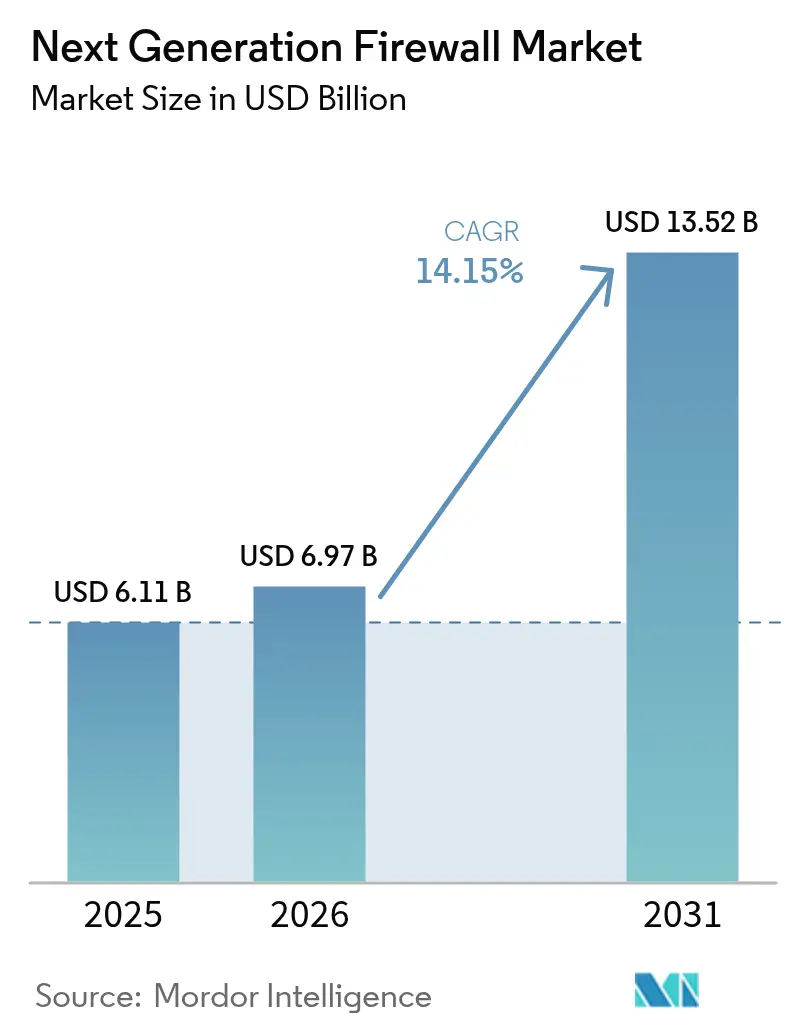
| Market Size (2026) | USD 6.97 Billion |
| Market Size (2031) | USD 13.52 Billion |
| Growth Rate (2026 - 2031) | 14.15% CAGR |
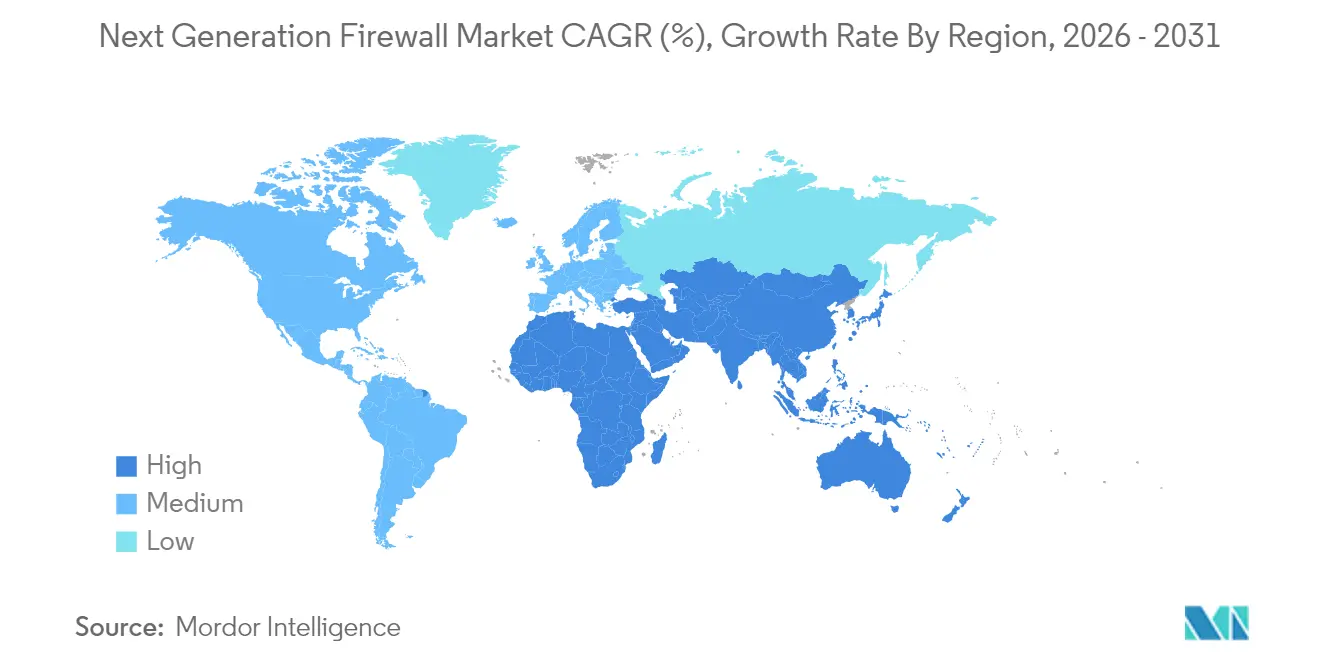
| Fastest Growing Market | Asia Pacific |
| Largest Market | North America |
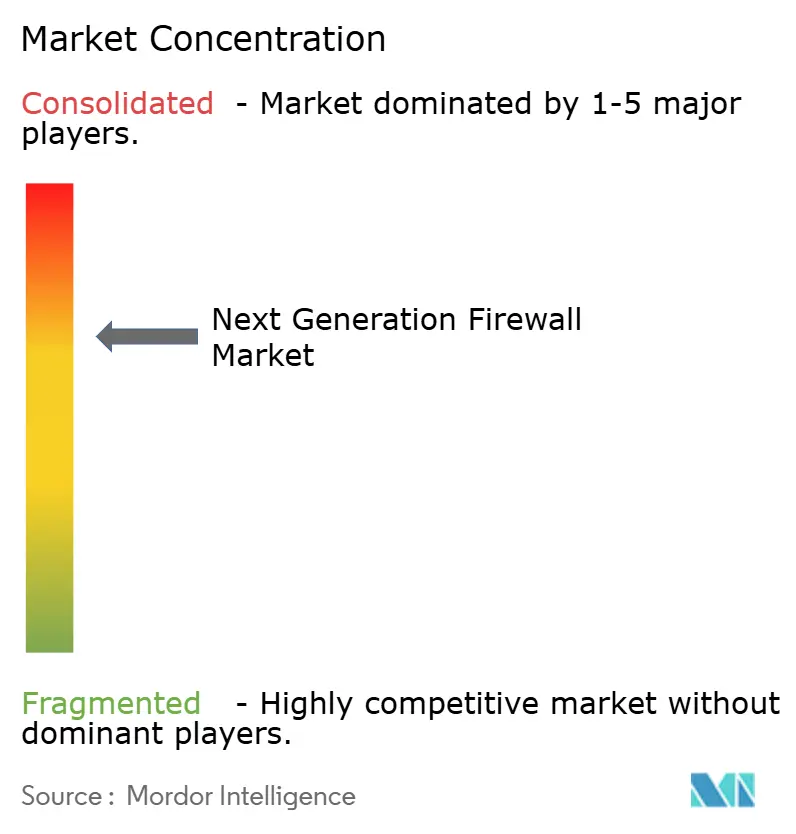
| Market Concentration | Medium |
Major Players *Disclaimer: Major Players sorted in no particular order Image © Mordor Intelligence. Reuse requires attribution under CC BY 4.0. | |
Next Generation Firewall Market Analysis by Mordor Intelligence
next generation firewall market size in 2026 is estimated at USD 6.97 billion, growing from 2025 value of USD 6.11 billion with 2031 projections showing USD 13.52 billion, growing at 14.15% CAGR over 2026-2031. Heightened adoption stems from the move to zero-trust architectures, wider cloud workload distribution, and embedded AI-threat analytics that cut false positives by up to 71%[1]Fortinet, “FortiGate 700G Series Launch,” fortinet.com. Hardware appliances still dominate, yet virtual and cloud-native deployments are scaling quickly as enterprises pursue software-defined security for hybrid environments. North America leads with a 36% revenue share, while Asia-Pacific is expanding the fastest as governments roll out sovereign-cloud mandates and regional data-residency laws. Demand is concentrated in IT-Telecom (46% share) and BFSI, where stricter compliance regimes and high-value digital assets push institutions toward real-time threat prevention. Vendors able to combine ASIC-level performance, AI-driven detection, and unified policy management are best placed to capture emerging opportunities in the next generation firewall market.
Key Report Takeaways
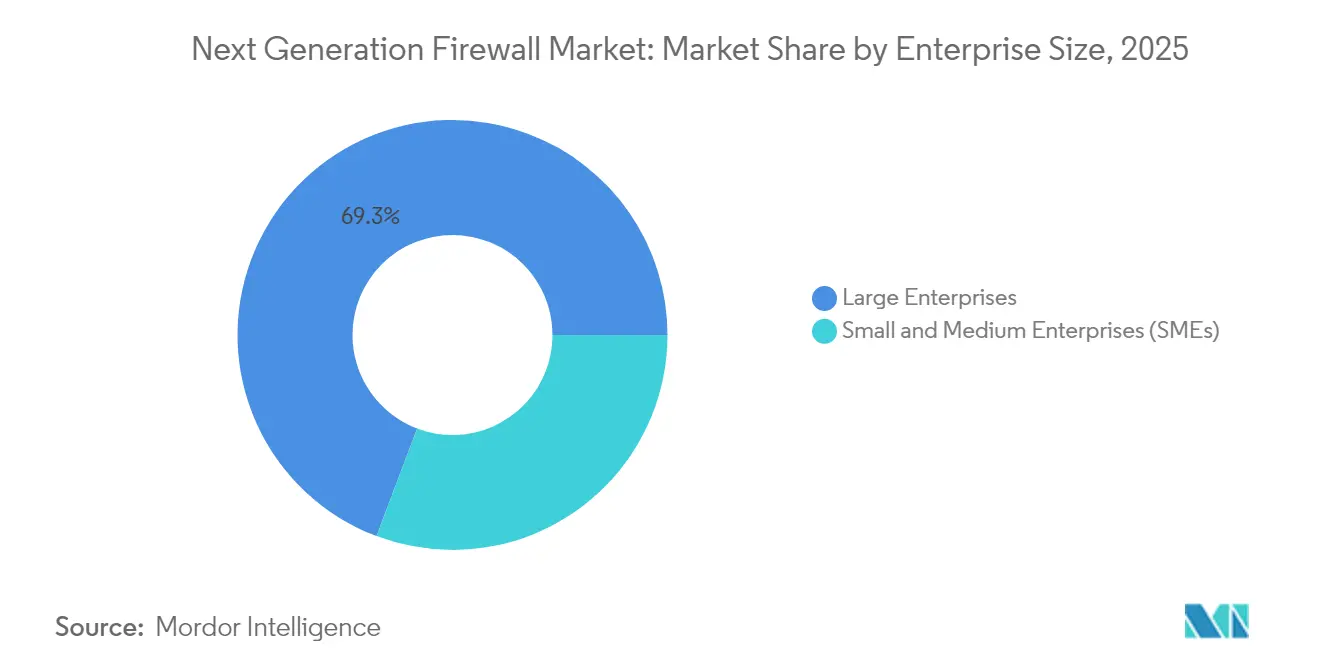
- By enterprise size, large enterprises held 69.25% of the next generation firewall market share in 2025, whereas SMEs are projected to grow at a 16.05% CAGR through 2031.
- By solution type, hardware appliances commanded 54.35% of the next generation firewall market size in 2025, while virtual and cloud-based firewalls are slated to advance at a 15.1% CAGR to 2031.
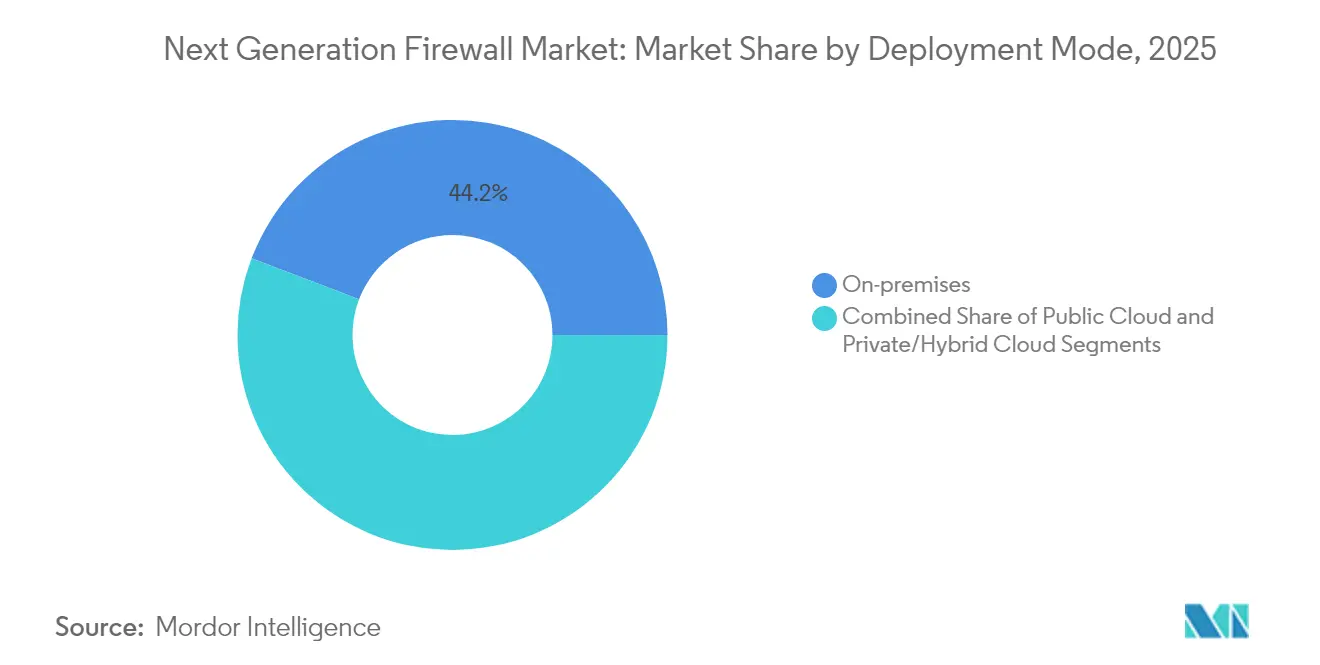
- By deployment mode, on-premises installations represented 44.20% of the market in 2025; private and hybrid cloud deployments are forecast to expand at a 16.2% CAGR over the same period.
- By end-user industry, IT and Telecom led with 45.35% revenue share in 2025; BFSI is the fastest-growing vertical, registering a 15.7% CAGR to 2031.
- By geography, North America accounted for 35.60% of global revenue in 2025, whereas Asia-Pacific is anticipated to post the highest regional CAGR of 15.95% to 2031.
- Fortinet, Palo Alto Networks, Cisco, and Check Point collectively controlled about 70% of worldwide shipments in 2024.
Note: Market size and forecast figures in this report are generated using Mordor Intelligence’s proprietary estimation framework, updated with the latest available data and insights as of 2026.
Global Next Generation Firewall Market Trends and Insights
Drivers Impact Analysis*
| Driver | (~) % Impact on CAGR Forecast | Geographic Relevance | Impact Timeline |
|---|---|---|---|
| Accelerated cloud migration demands inline L7-aware security | +3.8% | Global; early uptake in North America and Europe | Medium term (2-4 years) |
| Hybrid work proliferation expanding attack surface | +2.9% | Global; pronounced in service-oriented economies | Short term (≤ 2 years) |
| Mandatory zero-trust roll-outs in regulated sectors | +3.2% | North America, Europe, advanced APAC markets | Medium term (2-4 years) |
| AI-driven real-time threat-intel feeds in NGFWs | +2.5% | Global; concentrated in enterprise deployments | Medium term (2-4 years) |
| Sovereign-cloud initiatives boosting regional spend | +1.7% | APAC, Europe, Middle East | Long term (≥ 4 years) |
| Source: Mordor Intelligence | |||
Accelerated cloud migration demands inline L7-aware security
Sixty-eight percent of enterprise workloads now run in public, private, or hybrid clouds, exposing east-west traffic that legacy firewalls cannot inspect. Cloud-native NGFWs equipped with application-aware inspection shorten average threat detection time by 63% and cut security incidents by 47% compared with perimeter-only controls[2]Fortinet, “FortiGate 700G Series Launch,” fortinet.com. Deep visibility across microservices lets security teams retain uniform policies as 72% of enterprises boost cloud budgets in 2025, firmly positioning NGFWs as the control plane for distributed architectures.
Hybrid-work proliferation expanding attack surface
Remote access endpoints grew sharply when hybrid work became permanent, with 42% of devices now unmanaged. NGFWs that embed zero-trust network access validate every connection and have driven a 54% year-on-year booking increase for SonicWall’s Cloud Secure Edge. Identity-aware policies prevent credential abuse, addressing the 37% rise in such attacks since 2023, and equip firms to secure staff who move between corporate and home networks.
Mandatory zero-trust architecture roll-outs in regulated sectors
Government directives underscore continuous verification: the U.S. Department of Defense targets full zero-trust implementation by 2027 and designates NGFWs as enforcement points. Sixty percent of enterprises cite regulatory pressure as the main trigger for upgrades. When AI analytics assist policy decisions, detection improves by 43% and false positives fall 37%, validating the synergy between AI and zero-trust models[3]U.S. General Services Administration, “Application of Zero Trust Principles in Federal Agencies,” gsa.gov.
AI-driven threat intelligence transforms detection capabilities
Static rule sets are yielding to adaptive AI engines that recognize unknown malware in real time. Fortinet’s FortiGuard services reduce mean-time-to-detect by 78%, while Check Point blocks 99.9% of new malware within 24 hours of discovery. Automated updates also shrink incident response times by 42%, ensuring that defenses keep pace as adversaries weaponize AI.
Restraints Impact Analysis*
| Restraint | (~) % Impact on CAGR Forecast | Geographic Relevance | Impact Timeline |
|---|---|---|---|
| Capital-intensive ASIC road-map limits SMB price declines | −1.2% | Global; sharper effect in emerging markets | Medium term (2-4 years) |
| Shortage of DPI talent raises service costs | −0.9% | Global; acute in developing regions | Short term (≤ 2 years) |
| Fragmented data-residency laws slow SaaS NGFW uptake | −0.8% | Europe, APAC, Middle East | Medium term (2-4 years) |
| Open-source eBPF firewalls erode entry-level revenues | −0.7% | Global; primarily SMB segment | Long term (≥ 4 years) |
| Source: Mordor Intelligence | |||
Capital-intensive ASIC road-map limits SMB-grade price declines
High-performance SSL/TLS decryption drives vendors toward custom silicon. Fortinet’s SP5 processor gives 7× higher firewall throughput while consuming far less power, yet the research and development outlay keeps entry-level pricing elevated, with 43% of small businesses citing cost as the chief barrier. Although ASICs improve energy efficiency—FortiGate 70G needs 62× fewer watts per Gbps than rivals—the upfront spend remains daunting for budget-constrained buyers.
Shortage of deep-packet-inspection talent raises service costs
Advanced DPI features demand scarce skills. Sixty-eight percent of firms struggle to hire NGFW specialists, and compensation premiums inflate total cost of ownership. To bridge the gap, many enterprises rely on managed security service providers; SonicWall’s Managed Protection Suite offers 24/7 oversight, but recurring fees temper adoption, especially in cost-sensitive segments.
*Our forecasts treat driver/restraint impacts as directional, not additive. The impact forecasts reflect baseline growth, mix effects, and variable interactions.
Segment Analysis
By Enterprise Size: Demand bifurcates between high-end performance and managed simplicity
Large enterprises contributed 69.25% of 2025 revenue as their sizable budgets allowed deployment of multi-gigabit appliances inspecting encrypted traffic without latency. They continue to favor on-appliance ASIC acceleration paired with centralized policy orchestration. In contrast, SMEs are forecast to post a 16.05% CAGR to 2031, propelled by consumption-based subscriptions and managed services that lower capital hurdles. Flexible licensing and turnkey management let resource-limited teams gain enterprise-grade controls while outsourcing complexity. As a result, the next generation firewall market captures two distinct value propositions: uncompromising throughput for global multinationals and simplified, service-led offerings for smaller firms.
Regulatory obligations also shape spending patterns. Larger organizations confront stringent audit trails and must demonstrate granular control across data centers, branches, and subsidiaries. Smaller companies, meanwhile, gravitate toward consolidated platforms that integrate SD-WAN, IPS, and zero-trust access in a single stack, avoiding “tool sprawl.” The widening availability of pay-as-you-go virtual firewalls is expected to keep the next generation firewall market accessible to new adopters, especially across developing economies where capital intensity is a concern.


By Solution Type: Hardware remains core as cloud-native gains legitimacy
Hardware appliances retained 54.35% share in 2025, reflecting trusted performance characteristics within on-premises data centers. ASIC-laden flagships such as the FortiGate 700G deliver 164 Gbps firewall throughput at 7× better power efficiency than the industry mean, underscoring why high-bandwidth operators continue to prefer physical devices for deterministic latency. Meanwhile, the portion of revenue from virtual and cloud-based offerings is rising at a 15.1% CAGR, accelerated by elastic workloads and the economics of infrastructure-as-code.
Cloud-hosted NGFWs draw strength from centralized AI analytics that correlate threats across multiple tenants. Versa Networks scored 99.90% in independent security tests, signaling parity with hardware incumbents. As enterprises rationalize toolchains, they increasingly embed firewall functions within holistic SASE or SSE frameworks, boosting attach rates for virtual products. This dual-track evolution ensures the next generation firewall market addresses both performance-bound data-center needs and agile DevOps pipelines.
By Deployment Mode: Hybrid architectures anchor private-cloud momentum
On-premises deployments still account for 44.20% of total spend due to predictable throughput, regulatory controls, and direct hardware ownership. Even cloud-first enterprises maintain campus appliances to keep low-latency inspection near users. Private and hybrid clouds, however, are registering the strongest expansion at 16.2% CAGR, mirroring corporate strategies that mix flexibility with sovereignty mandates. NGFWs delivered as virtual machines or containerized microservices enforce uniform policy across disparate environments, minimizing security drift when workloads move between data centers and hyperscale clouds.
As edge computing gains ground, distributed firewalls help monitor east-west traffic at branch sites, campuses, and 5G MEC nodes. Their real-time intelligence synchronizes with centralized controllers, enabling unified visibility. Public-cloud firewalls also continue steady growth, strengthened by integration with native services from leading cloud providers. Together, these dynamics guarantee that the next generation firewall market size for hybrid architectures will outpace monolithic deployment modes through the decade.
By End-User Industry: Financial services accelerate modernization
IT-Telecom retained leadership with 45.35% global revenue in 2025, stemming from the sector’s role in operating backbone infrastructure and backbone traffic flows that demand deterministic, high-capacity inspection. Providers embed NGFWs to secure multi-tenant data centers, 5G cores, and edge POPs. In parallel, BFSI is expanding at a 15.7% CAGR as open banking, real-time payments, and API ecosystems heighten exposure to fraud and ransomware. Banks require granular application visibility and full-packet inspection to meet PCI DSS and local prudential regulations; PT Bank Central Asia’s rollout of Palo Alto Networks’ NGFWs showcases the sector’s focus on compliance and operational efficiency.
Government and defense agencies are another pivotal segment. The U.S. Federal Zero Trust mandate places NGFWs at the core of micro-segmentation and continuous monitoring, driving procurement across federal and state programs. Healthcare, manufacturing, and retail verticals also raise spending as IoT, tele-medicine, and omnichannel commerce broaden attack surfaces. Collectively, vertical diversification sustains the next generation firewall industry’s long-term momentum.
Geography Analysis
North America maintained first place with a 35.60% share in 2025. Early adoption of zero-trust frameworks, compliance drivers such as the NIST guidelines, and the presence of leading vendors sustain high spending depths. Financial services and healthcare institutions in the United States prioritize deep inspection of encrypted traffic and micro-segmentation, reinforcing demand for high-end appliances. Federal programs that modernize critical infrastructure further amplify procurement.
Asia-Pacific is projected to grow at 15.95% CAGR through 2031. Sovereign-cloud policies in Japan, India, and Singapore, together with a surging digital-services economy, accelerate rollouts of cloud-native defenses. Palo Alto Networks’ recent expansion of Prisma Access Browser to regional data centers underlines vendor efforts to meet residency rules while enabling secure remote access. The climb in managed security services also addresses skills shortages, allowing enterprises to deploy enterprise-grade NGFW capabilities without large in-house teams.
Europe forms a sizable addressable base as GDPR and the NIS2 Directive require robust traffic inspection and data-handling safeguards. The forthcoming EU AI Act places new emphasis on responsible AI integration within security products, influencing how vendors position threat-detection engines. Demand is notable among critical infrastructure operators in energy, transport, and financial market utilities.
The Middle East and Africa are registering solid growth as national digital-transformation agendas roll out 5G, smart-city projects, and e-government platforms. Robust GDP allocation to cybersecurity in Saudi Arabia and the United Arab Emirates stimulates competitive tenders, with buyers looking for post-quantum cryptography readiness and flexible consumption models. Although starting from a smaller base, these regions add diversity to the next generation firewall market and open channel opportunities for system integrators.

Competitive Landscape
Four suppliers—Fortinet, Palo Alto Networks, Cisco, and Check Point—collectively captured roughly 70% of global shipments in 2024, highlighting a moderately concentrated arena. Fortinet commands the largest installed base, exceeding 775,000 customers, benefiting from custom ASIC design that delivers superior throughput-per-watt metrics. Check Point emphasizes detection efficacy, posting 99.9% blocking on day-zero malware, while Palo Alto Networks leans on Prisma to unify cloud, edge, and on-prem controls, recently enhanced through the planned Protect AI acquisition for USD 500 million.
Performance, security accuracy, and operational integration define key differentiation vectors. Vendors integrating AI into control planes automate policy fine-tuning and incident triage, reducing administrative overhead for SOC teams. The shift toward security-service-edge subscriptions bolsters revenue diversity, rewarding suppliers that can decouple software value from proprietary hardware. New entrants such as Versa Networks gained visibility by achieving 99.90% effectiveness in independent cloud firewall tests, demonstrating that cloud-native architectures can compete on protection parity.
Managed security service providers now influence procurement, as organizations lacking DPI specialists outsource configuration and monitoring. Vendors tailor licensing for multi-tenant environments, adding APIs for usage-based billing. Consolidation trends also emerge, with firewall suppliers acquiring AI, XDR, and SASE assets to enrich platforms and minimize customer tooling sprawl. Competitive intensity is set to remain high as the next generation firewall market balances the hardware performance arms race against the agility of virtual firewalls.
Next Generation Firewall Industry Leaders
Juniper Networks Inc.
Palo Alto Networks Inc.
Dell Technologies
Huawei Technologies Co. Ltd
Fortinet Inc.
- *Disclaimer: Major Players sorted in no particular order

Recent Industry Developments
- May 2025: Fortinet launched the FortiGate 700G, a hybrid-mesh firewall offering 164 Gbps throughput and post-quantum cryptography readiness.
- April 2025: Palo Alto Networks agreed to acquire Protect AI for USD 500 million+, adding specialized safeguards for AI and machine-learning workloads.
- March 2025: Versa Networks’ NGFW earned a 99.90% security-effectiveness score in a CyberRatings.org cloud-firewall test.
- March 2025: Palo Alto Networks expanded Asia-Pacific cloud infrastructure, integrating Prisma Access Browser across five regional data centers.
- February 2025: Fortinet unveiled the FortiGate G-series (70G/50G/30G) for distributed enterprises, delivering up to 11× IPsec throughput gains with AI-powered services.
- February 2025: Check Point’s Enterprise and Hybrid Mesh Firewall scored 99.9% malware block and 99.74% phishing URL prevention in Miercom testing.


Research Methodology Framework and Report Scope
Market Definitions and Key Coverage
Our study defines the next-generation firewall market as revenue derived from purpose-built hardware, virtual appliances, and cloud-delivered firewalls that integrate deep packet inspection, application awareness, intrusion prevention, and advanced threat analytics within a single policy engine. Subscription-based update and management fees linked to these firewalls are included, while professional services are captured separately in service splits.
Scope Exclusion: Legacy stateful packet-filter devices, secure web gateways, and small-office UTM boxes that lack application-layer controls are excluded.
Segmentation Overview
- By Enterprise Size
- Small and Medium Enterprises (SMEs)
- Large Enterprises
- By Solution Type
- Hardware Appliance
- Virtual / Cloud-based
- By Deployment Mode
- On-premises
- Public Cloud
- Private / Hybrid Cloud
- By End-User Industry
- Banking, Financial Services and Insurance (BFSI)
- Information Technology (IT) and Telecom
- Government and Defense
- Healthcare
- Manufacturing
- Retail and E-commerce
- Energy and Utilities
- Others
- By Geography
- North America
- United States
- Canada
- Mexico
- South America
- Brazil
- Argentina
- Rest of South America
- Europe
- United Kingdom
- Germany
- France
- Russia
- Rest of Europe
- Asia-Pacific
- China
- Japan
- India
- South Korea
- Australia and New Zealand
- Rest of Asia-Pacific
- Middle East and Africa
- Middle East
- Saudi Arabia
- United Arab Emirates
- Turkey
- Rest of Middle East
- Africa
- South Africa
- Nigeria
- Rest of Africa
- Middle East
- North America
Detailed Research Methodology and Data Validation
Primary Research
We interviewed network-security architects at managed service providers, CISOs from finance and healthcare, and channel distributors across North America, Europe, and Asia-Pacific. These conversations clarified average selling prices, refresh intervals, and the shift toward SaaS firewalls, enabling us to adjust desk-derived assumptions and resolve gray areas on cloud licensing.
Desk Research
Mordor analysts first collect baseline indicators from freely available tier-one sources such as the US National Institute of Standards and Technology breach repository, ENISA threat reports, Eurostat ICT surveys, and regional telecom regulator filings that track enterprise connectivity counts. Shipment statistics from customs databases like Volza and patent trends extracted through Questel help us size physical units and gauge technology refresh cycles. Company 10-K filings, investor decks, and global cyber-insurance loss reports round out adoption signals before they are loaded into our modeling sheets.
To cross-check revenues, we reference paid datasets, including D&B Hoovers for vendor financials and Dow Jones Factiva for deal pipelines, which provide directional guardrails. The secondary-source list above is illustrative; many additional public and paid materials inform data validation throughout the project.
Market-Sizing & Forecasting
A blended top-down approach converts enterprise site counts and bandwidth tiers into an addressable demand pool, which is then sanity-checked through sampled ASP × unit roll-ups from supplier disclosures. Key variables tracked include average branch bandwidth, cloud migration rate, zero-trust project penetration, hardware-to-virtual mix, regulatory mandate frequency, and cyber-incident growth. Forecasts are produced with multivariate regression that links those drivers to historic revenue, and results are reconciled against selective bottom-up estimates to fine-tune totals.
Data Validation & Update Cycle
Outputs pass multi-layer reviews where analysts test variance versus import data, currency swings, and newly released vendor earnings. Models refresh annually; material events such as major breaches or regulatory shifts trigger interim updates. A last-minute pass before publication ensures clients receive the latest outlook.
Why Mordor's Next Generation Firewall Baseline Warrants Confidence
Published numbers often diverge because firms choose different firewall classes, apply distinct ASP progressions, and refresh models at uneven intervals.
By centering on a clear NGFW feature set and combining site counts with real-time price checks, Mordor delivers a figure that is both transparent and reproducible.
Benchmark comparison
| Market Size | Anonymized source | Primary gap driver |
|---|---|---|
| USD 6.11 B (2025) | Mordor Intelligence | - |
| USD 5.18 B (2024) | Global Consultancy A | Excludes cloud-delivered firewalls and uses static ASPs |
| USD 8.60 B (2028) | Regional Consultancy B | Applies aggressive roll-forward without validating installed-base retirement |
| USD 5.26 B (2024) | Trade Journal C | Covers hardware only; omits subscription revenue |
The comparison shows that methodological scope and update cadence explain most gaps. By aligning variables tightly with the functional definition and refreshing data each year, Mordor Intelligence offers a dependable baseline for budgeting, vendor assessment, and investment planning.


Key Questions Answered in the Report
What is the projected next generation firewall market size by 2031?
The next generation firewall market size is expected to reach USD 13.52 billion by 2031, growing at a 14.15% CAGR from 2026.
Which region will grow the fastest in the next generation firewall market?
Asia-Pacific is forecast to post the highest regional CAGR of 15.95% through 2031, fuelled by sovereign-cloud mandates and rapid digital transformation.
Why are hardware appliances still significant despite cloud growth?
High-bandwidth inspection, deterministic latency, and ASIC-based acceleration keep hardware appliances vital for data-center and campus deployments where performance is critical.
How does zero-trust adoption influence the next generation firewall industry?
Government mandates and compliance standards position NGFWs as essential enforcement points within zero-trust architectures, amplifying demand across regulated sectors.
What role does AI play in modern firewalls?
AI-driven threat intelligence improves detection accuracy, reduces mean-time-to-detect by up to 78%, and automates policy updates, enhancing overall security posture.
Are managed security services impacting purchasing decisions?
Yes. Skill shortages in deep-packet inspection push organizations toward managed service offerings, influencing vendor licensing models and expanding market access for SMEs.
Page last updated on:


