
New Zealand Used Car Market Size and Share
Market Overview
| Study Period | 2020 - 2031 |
|---|---|
| Forecast Data Period | 2026 - 2031 |
| Base Year Market Size (2025) | USD 306.85 Million |
| Market Size (2026) | USD 323.37 Million |
| Market Size (2031) | USD 420.12 Million |
| Growth Rate (2026 - 2031) | 5.38 % |
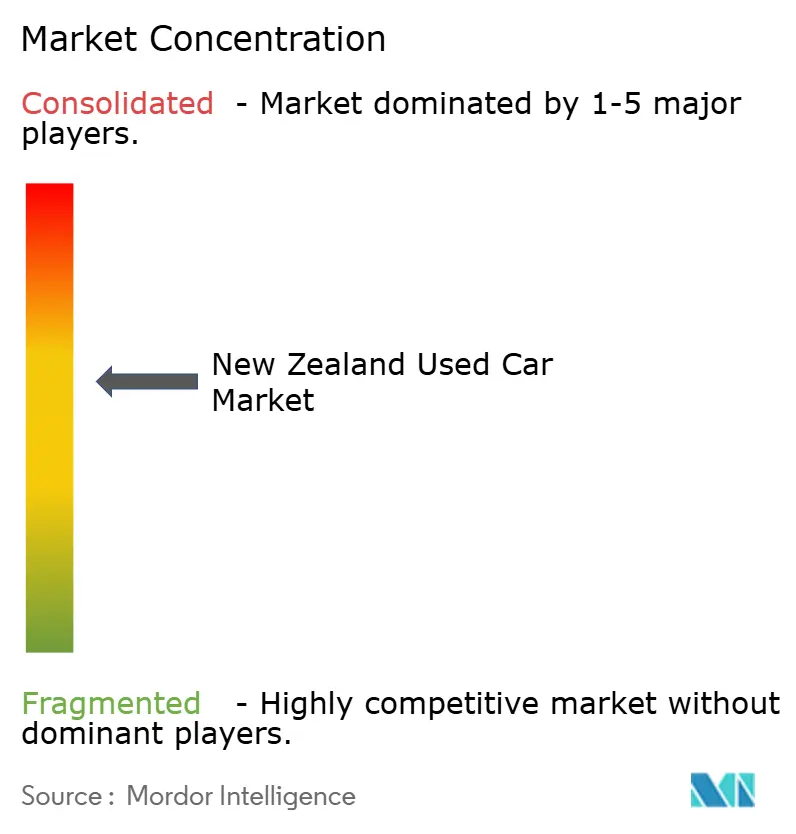
| Market Concentration | Medium |
Major Players *Disclaimer: Major Players sorted in no particular order Image © Mordor Intelligence. Reuse requires attribution under CC BY 4.0. | |
New Zealand Used Car Market Analysis by Mordor Intelligence
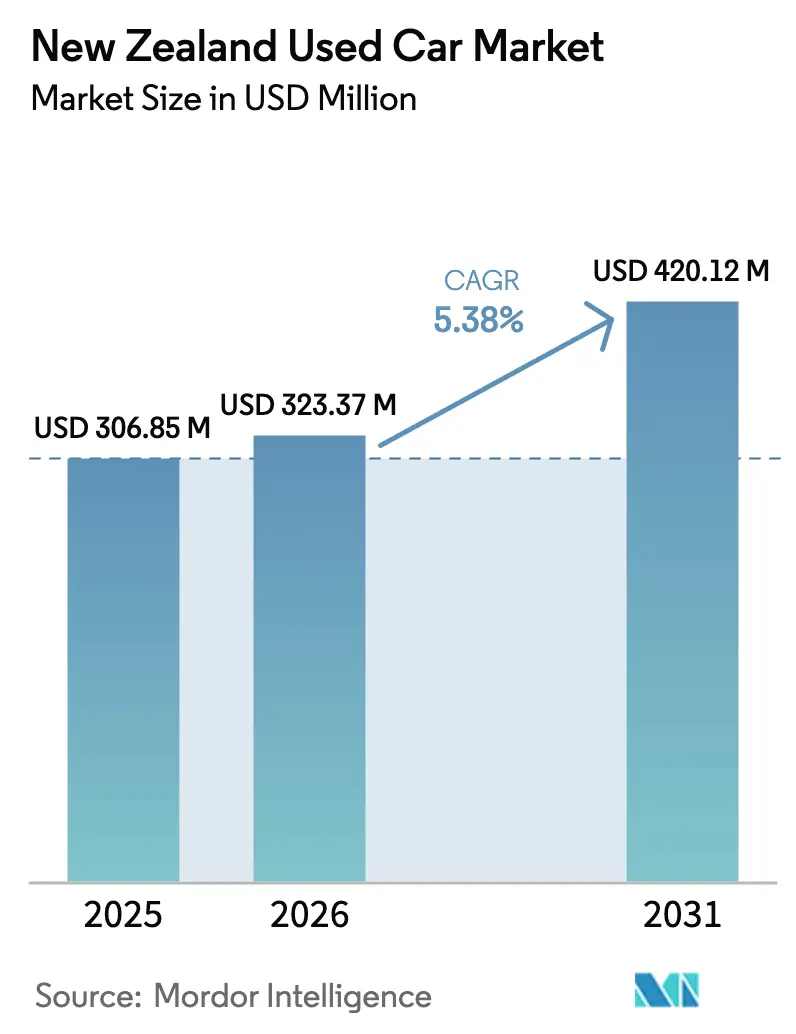
The New Zealand used car market size is expected to grow from USD 306.85 million in 2025 to USD 323.37 million in 2026 and is forecast to reach USD 420.12 million by 2031 at 5.38% CAGR over 2026-2031. Demand remains resilient despite the 2023 end of the Clean Car Discount and the 2024 road-user charge for battery-electric vehicles, as buyers adapt to evolving policy settings [1]. Growth is fueled by a decisive shift from yard-only shopping to digital-first journeys. Consumer appetite for versatile sport-utility vehicles stays strong, while a steady influx of competitively priced Japanese hybrid and electric imports, supported by a weak yen, broadens low-emission choices. These conditions create opportunities for dealers that blend omnichannel retailing, emissions-compliant inventory, and transparent vehicle histories to serve an expanding, tech-savvy customer base.
Key Report Takeaways
- By vehicle type, sport-utility vehicles held 45.12% of the New Zealand used car market share in 2025, and the segment is expanding at 5.88% CAGR through 2031.
- By vendor type, unorganized dealers captured 57.63% revenue of the New Zealand used car market in 2025, while the organized segment is advancing at 6.42% CAGR to 2031.
- By fuel type, petrol engines commanded a 63.45% share of the New Zealand used car market in 2025, while hybrid and electric cars recorded the fastest 13.78% CAGR, though 2031.
- By vehicle age, 6-8 year units accounted for 38.72% share of the New Zealand used car market in 2025, whereas 0-2 year vehicles are projected to grow at 6.85% CAGR through 2031.
- By price segment, USD 10,000-14,999 cars led with 45.55% share of the New Zealand used car market in 2025, yet models priced above USD 30,000 are set to climb 6.12% CAGR through 2031.
- By sales channel, offline outlets retained 57.95% share of the New Zealand used car market in 2025, but online sales are increasing at 7.72% CAGR through 2031.
- By ownership, multi-owner listings represented 73.40% share of the New Zealand used car market in 2025, while first-owner cars are growing 7.18% CAGR through 2031.
Note: Market size and forecast figures in this report are generated using Mordor Intelligence’s proprietary estimation framework, updated with the latest available data and insights as of 2026.
Competitive positioning in New zealand includes both locally based firms and those operating across multiple regions. The market landscape in the global used car industry research shows how these players are arranged internationally.
Market Trends and Insights
Drivers Impact Analysis of New Zealand Used Car Market*
| Driver | (~) % Impact on CAGR Forecast | Geographic Relevance | Impact Timeline |
|---|---|---|---|
| Government Clean Car Standard and rebate legacy effects | +1.2% | National | Medium term (2-4 years) |
| Surging supply of budget EV and hybrid ex-JDM imports | +0.9% | National, major ports | Medium term (2-4 years) |
| Accelerated online-to-offline retail integration | +0.8% | National, early gains in Auckland/Wellington/Christchurch | Short term (≤ 2 years) |
| Fleet-age reduction mandate proposed by NZTA | +0.7% | National, commercial fleets | Long term (≥ 4 years) |
| Rise of subscription car-as-a-service models | +0.6% | Urban centers, expanding regionally | Medium term (2-4 years) |
| Favorable FX (weak yen) boosting importer margins | +0.4% | National | Short term (≤ 2 years) |
| Source: Mordor Intelligence | |||
Government Clean Car Standard and Rebate Legacy Effects
Although the Clean Car Discount ended in 2023, importers still face NZD 22.50 per gram of CO₂ above fleet targets, so low-emission stock remains strategically valuable. Electric-vehicle registrations nearly doubled in early 2025 versus the prior year, confirming that underlying demand persists without direct rebates. The ongoing standard improves visibility for dealers until at least 2027, motivating higher import volumes of hybrids and electrics. Secondary-market buyers benefit from lower entry prices as first owners shoulder the steepest depreciation. Dealers who optimize emissions portfolios gain an edge when auctioning high-CO₂ inventory to overseas buyers, moderating compliance costs.
Surging Supply of Budget EV and Hybrid Ex-JDM Imports
Japan ships many used cars each month to New Zealand at an average landed cost of NZD 7,700 (USD 4,620), filling forecourts with value-priced hybrids and micro-EVs. Quality checks such as JEVIC inspections ensure units meet Euro 4 standards, sustaining buyer confidence even at lower price points. Import volumes center on the 3-5 year age bracket, directly contesting local trade-in pricing. Dealers with in-house compliance centers turn faster, while smaller yards absorb higher reconditioning times. The flow of electrified imports raises consumer exposure to EV ownership, accelerating repeat-purchase likelihood in the New Zealand used car market.
Accelerated Online-to-Offline Retail Integration
Consumers increasingly expect seamless digital journeys, prompting dealers to embed virtual showrooms, instant finance calculators, and remote paperwork into traditional processes. Around 18.72% of all big-ticket retail transactions already occur fully online, signaling cultural readiness for click-to-buy car purchases. The shift trims floorplan costs and widens national reach but requires investment in inventory-management systems and staff re-skilling. Smaller independents face margin pressure until platform fees normalize and scale economies emerge. As payment security and logistics partners mature, conversion rates on digital listings are expected to edge closer to traditional yards, giving the New Zealand used car market a durable omnichannel backbone.
Fleet-Age Reduction Mandate Proposed by NZTA
Policy debate now weighs fees on high-emission vehicles older than 12 years, a move aligned with the 2050 net-zero goal [2]. Commercial fleets may be required to shorten replacement cycles, stimulating turnover toward younger, lower-maintenance stock. Parts distributors forecast 5-10% annual growth under a status-quo fleet, underscoring potential upside if forced retirement accelerates. Mandates would lift demand for late-model units yet risk stranding aged inventory that remains price-competitive for rural buyers. Stakeholders, therefore, lobby for phased rollouts with scrappage vouchers, cushioning transition pain.
Restraints Impact Analysis of New Zealand Used Car Market*
| Restraint | (~) % Impact on CAGR Forecast | Geographic Relevance | Impact Timeline |
|---|---|---|---|
| Trust Gap in Odometer/Damage-History Data | -0.5% | National, higher-value deals | Long term (≥ 4 years) |
| Stricter Japanese Auction Sourcing Rules | -0.4% | National, import-dependent | Short term (≤ 2 years) |
| Volatile BEV Residual Values | -0.3% | Urban EV clusters | Medium term (2-4 years) |
| Insufficient Public Charging Outside Main Metros | -0.2% | Regional/Rural | Long term (≥ 4 years) |
| Source: Mordor Intelligence | |||
Trust Gap in Odometer/Damage-History Data
Claims disputes heard by the Motor Vehicle Disputes Tribunal underline lingering transparency issues around mileage rollbacks and past damage [3]. Cost or effort deters some buyers from independent inspections, and requested price discounts compress dealer margins. Digital platforms now attach government-verified Consumer Information Notices to listings, yet authenticity doubts persist for imports lacking verified service records. Wider uptake of blockchain-based maintenance logs could narrow the gap, but critical mass remains distant. Until certainty improves, premium transactions will progress cautiously, tempering the New Zealand used car market’s velocity at the high end.
Stricter Japanese Auction Sourcing Rules
Japan’s domestic regulator is tightening export procedures to curb fraud and protect local buyers, which can cap New Zealand importer access to premium lanes or increase compliance expenses. Small importers lacking bundled shipping contracts face higher per-unit logistics charges, eroding landing-price advantages. Dealers may diversify to Singapore or UK auctions, but those channels carry different specs and right-hand-drive availability. In the short term, inventory scarcity on popular grades could lift domestic wholesale prices, transferring cost to consumers.
*Our forecasts treat driver/restraint impacts as directional, not additive. The impact forecasts reflect baseline growth, mix effects, and variable interactions.
New Zealand Used Car Market Segment Analysis
By Vehicle Type:
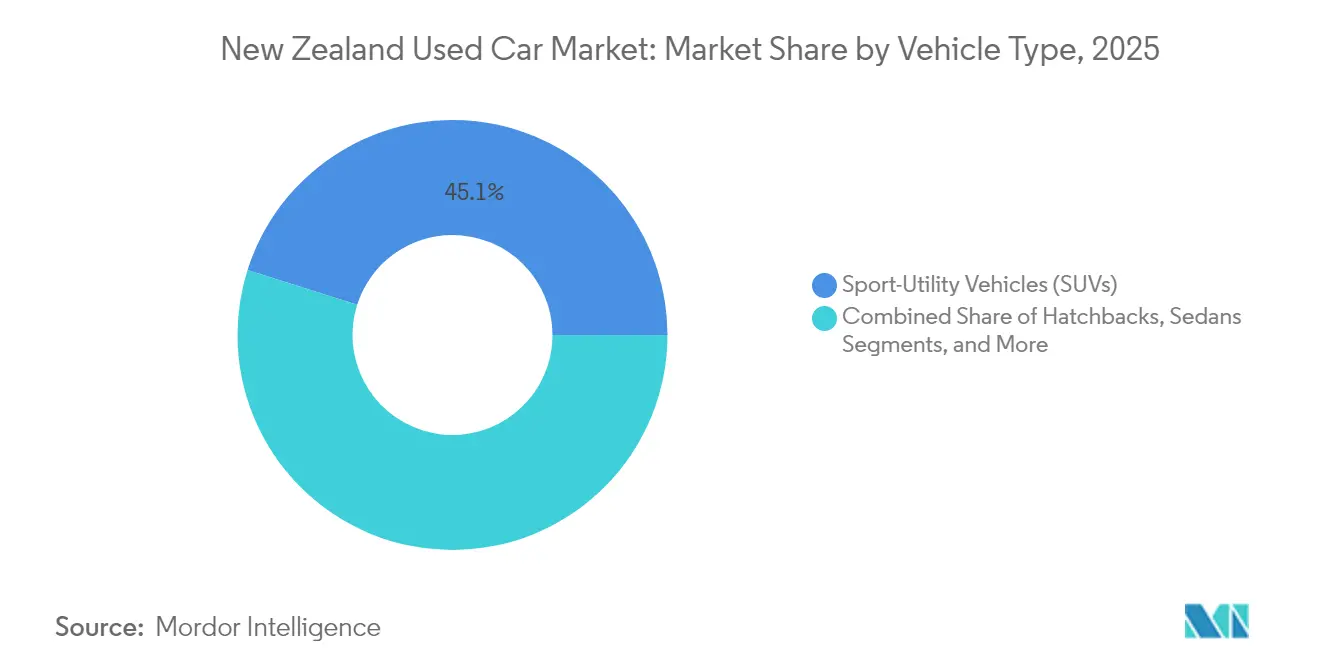
SUV Dominance Drives Market EvolutionSport-utility vehicles captured 45.12% of the New Zealand used car market in 2025 and are projected to climb at a 5.88% CAGR through 2031. The segment enjoys strong resale values, supportive of trade-in flows that perpetuate inventory depth. Hatchbacks and sedans continue serving budget and fleet buyers but surrender share to higher-riding crossovers. Outdoor recreational culture, gravel roads, and unpredictable weather make all-wheel drive and elevated ground clearance practical advantages. The Clean Car Standard nudges OEMs toward hybrid and plug-in SUV variants, moderating future compliance penalties. Enthusiast body styles such as convertibles and coupes remain niche yet attract premium margins for specialty yards.

By Vendor Type:
Organized Dealers Gain GroundUnorganized sellers held 57.63% of the New Zealand used car market turnover in 2025, yet organized dealerships are expanding fastest at a 6.42% CAGR as buyers seek warranty cover and structured finance. First-tier dealers leverage certified reconditioning centers and nationwide logistics to shorten lead times and build brand trust. Unorganized sellers retain cost advantages yet struggle to match digital marketing spend and compliance sophistication. Expanding consumer-credit screening by banks favors licensed yards able to integrate instant approval engines. As transparency laws tighten, the New Zealand used car market is expected to keep reallocating volume toward the organized segment.
By Fuel Type:
Electrification Accelerates Despite Policy ShiftsPetrol models held 63.45% share of the New Zealand used car market in 2025, but hybrids and electrics will post the fastest 13.78% CAGR as battery prices fall and consumer running-cost awareness rises. Many buyers experiment with hybrid technology first, comforted by ample Japanese import supply and familiar servicing. Road-user charges on EVs introduce a new cost line, yet total ownership calculations still favor BEVs for high-kilometer drivers under rising fuel prices. Diesel experiences gradual contraction as emissions scrutiny intensifies, and LPG/CNG remains minor owing to sparse refueling networks.
By Vehicle Age:
Newer Vehicles Gain PreferenceUnits aged 6-8 years held a 38.72% share in 2025 within the New Zealand used car market, yet 0-2-year entries will rise at 6.85% CAGR as buyers prioritize up-to-date safety tech and connectivity. Lease returns from corporates provide a steady pipeline of such late-model cars. Older than 12 years stock faces looming policy risk and higher Warrant-of-Fitness-fail rates, nudging cost-aware consumers toward the younger 3–5-year bracket. Part suppliers still see healthy demand from legacy fleets, indicating a long tail of older-vehicle viability, particularly outside major cities.
By Price Segment:
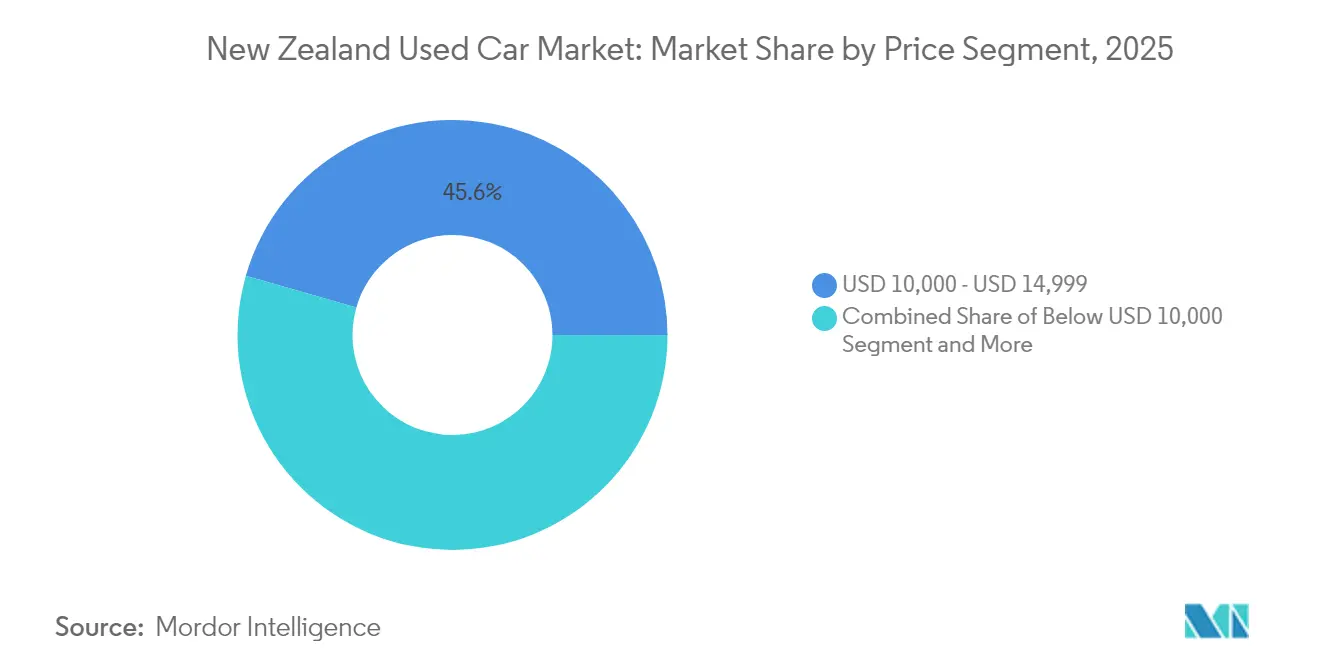
Premium Growth Amid Value FocusCars priced USD 10,000-14,999 controlled 45.55% of the New Zealand used car market in 2025, reflecting broad value hunting among mid-income households. However, units above USD 30,000 are forecast to grow at 6.12% CAGR, propelled by technology seekers and rising disposable incomes in dual-earner households. Sub-USD 10,000 choices face reliability concerns and limited finance support, while the USD 15,000-29,999 middle tiers act as gateways to advanced driver-assistance features. Dealers stocking premium near-new imports benefit from higher gross profit per unit, offsetting slower turn rates.
By Sales Channel:
Digital Transformation AcceleratesOffline showrooms still processed 57.95% of the New Zealand used car market transactions in 2025, but online channels expanded at 7.72% CAGR as listing platforms add finance, inspection, and delivery plugins. Consumers increasingly pre-qualify for loans online, reducing time spent on-site. Physical yards adapt by offering click-and-collect services and virtual video tours. Auction houses maintain dealer-to-dealer relevance, though some pivot to livestreamed bidding to widen buyer circles. Omnichannel strategies emerge as baseline expectations rather than competitive differentiators.
By Ownership:
First-Owner Vehicles Command PremiumFirst-owner listings grow at 7.18% CAGR against a dominant 73.40% share of the New Zealand used car market for multi-owner cars in 2025, signaling a willingness to pay a transparency premium. Verified service logs and extended warranties help close deals faster, especially on vehicles under five years old. Multi-owner stock keeps volume leadership by affordability, yet contends with the enduring odometer-history trust gap. Platforms investing in data analytics to validate ownership chronology can unlock latent value across this high-volume segment of the New Zealand used car market.
Geography Analysis
Auckland functions as the nation’s import hub, funneling Japanese arrivals through its ports and sustaining the country’s largest dealer network. Wellington’s steady government employment provides a resilient customer base that values late-model low-emission vehicles. Christchurch continues to refresh its fleet after earthquake-era write-offs, maintaining active demand.Secondary cities such as Hamilton, Tauranga, and Dunedin post above-average growth as population inflows and infrastructure upgrades lower distribution costs. Regional consumers often face inventory scarcity and longer test-drive logistics, creating pricing premiums. Electric-vehicle uptake maps closely to charging-point density; major urban corridors enjoy firm BEV demand, whereas regional areas lag pending the government’s 10,000-point 2030 infrastructure target. Meridian Energy’s highway installations are narrowing gaps, yet range anxiety still tempers rural BEV resale values.
Mordor Intelligence tracks the used car market across other major regions such as Africa, with additional country-level coverage spanning Sri Lanka, South Korea, South Africa, Myanmar, Switzerland, Belgium, Nigeria, and Kenya, each reflecting localized structural drivers, restraints and more.
Regulatory Landscape
New Zealand used-vehicle retail is shaped by trader-registration, disclosure, and consumer-protection requirements that govern how vehicles are advertised and sold. The Motor Vehicle Sales Act 2003 requires dealers to be registered on the Motor Vehicle Traders Register, while the Consumer Information Standards (Used Motor Vehicles) Regulations 2008 require a Consumer Information Notice (CIN) to be displayed on used vehicles offered for sale, with market operators required to take reasonable steps to ensure traders using their facilities meet CIN obligations.
Enforcement sits primarily with the Commerce Commission under the Fair Trading Act 1986, which creates compliance and reputational risk for dealers and platforms. Non-compliance can trigger infringement notices (up to NZD 1,000) or prosecution, with penalties referenced up to NZD 30,000 for companies and up to NZD 10,000 for individuals for Fair Trading Act breaches. These rules reinforce demand for transparent vehicle histories and push organized dealers and major listing platforms to standardize documentation and listing hygiene.
Value Chain Analysis
The used-car value chain in New Zealand starts with sourcing (local trade-ins, fleet disposals, and imports), then moves through inspection and compliance, reconditioning, listing and merchandising (yards and digital marketplaces), financing and insurance, and finally delivery and aftersales services. Dealer-to-dealer and dealer-to-consumer transactions rely on documentation controls, including requirements for traders to maintain sales records (for example, VIN and vehicle details) for at least six years, which raises the importance of dealer management systems and auditable processes.
Trust and title verification sit at the center of the chain for both dealers and consumers, with checks such as searching the Personal Property Securities Register (PPSR) to identify security interests before purchase or sale. On the corporate side, consolidation adds another layer of activity through adviser, legal, and governance workstreams (for example, takeover committees and independent advisers during bids), which can affect sourcing scale, inventory turn, and marketing reach for dealer groups and platforms.
Competitive Landscape
Turners Automotive Group leads with an integrated auction-retail-finance model that funds technology and nationwide branch expansion. Trade Me Motors dominates online eyeballs and deepens data-valuation capabilities following the full acquisition of AutoGrab in July 2024, sharpening pricing transparency for dealers.
Digital-only entrants offer subscription vehicles and doorstep delivery, unsettling traditional dealers who rely on foot traffic. Organized networks counter by bundling extended warranties, service contracts, and rapid finance approval to sweeten value propositions.
The unorganized segment stays relevant through low overheads and local relationships, yet concedes share as compliance regulations tighten. Overall, the New Zealand used car industry exhibits moderate concentration, leaving space for niche specialists such as rural-vehicle suppliers and classic-car restorers.
New Zealand Used Car Industry Leaders
-
AJ Motors Ltd
-
Turners Automotive Group
-
2Cheap Cars Group Limited
-
Trade Me Limited
-
Auto Trader Media Group Limited (Auto Trader)
- *Disclaimer: Major Players sorted in no particular order
New Zealand Used Car Market Companies Covered in this Report
- Turners Automotive Group
- Autoport.nz
- Andrew Simms Group
- Morrison Motor Group
- Miles Group
- Portage Cars
- AutoTrader NZ
- 2Cheap Cars Group Limited
- JustCar NZ
- NZ Car Ltd. (NZC)
- Enterprise Motor Group
- AJ Motors Ltd.
- Trade Me Limited
- Paul Kelly Motor Company
- Wheeler Motor Company
- Dayman's Motor Group
Market Opportunities and Future Outlook
Two near-term whitespace areas stand out: (1) compliance-led transparency services embedded in digital-to-physical journeys and (2) scaled consolidation plays that bring process discipline to a market still led by unorganized sellers. The CIN display regime and Commerce Commission enforcement under the Fair Trading Act increase the business value of standardized disclosures, verified ownership and lien checks (for example PPSR workflows), and listing tools that reduce errors for traders and platform operators.
Active corporate moves also signal where capital is being directed. Turners Automotive Group used its 24 March 2026 Institutional Investor Day to outline a five-year growth strategy and capital allocation priorities, indicating continued investment focus across retail, finance, and insurance capabilities. Separately, the 13 July 2026 takeover notice by Sena & Co Limited for 2 Cheap Cars Group Limited, alongside independent governance steps such as a takeover committee and an independent adviser, points to a live consolidation route and room for network scale, tighter reconditioning throughput, and stronger national marketing for high-volume used-car operators.
Recent Industry Developments in New Zealand Used Car Market
- May 2026: Turners Automotive Group released record FY26 results for the period ending 31 March 2026, reporting a normalised NPBT of $63.2 million, a 16% increase on FY25. The strong profitability supports expansion funding and a margin-driven growth plan across Auto Retail, Finance, and Insurance segments.
- May 2026: Turners Automotive Group reported the successful completion of three new Christchurch branches, now fully operational as part of the group's Auto Retail strategy. The expansion increases dealer network density and regional capacity, strengthening both vehicle sourcing and sale channels.
- May 2026: Turners Automotive Group confirmed the group's $65 million NPBT target has been brought forward into FY27, establishing a new $100 million NPBT target by FY31. The company said the change clarifies its long-term profitability trajectory and tightens capital planning ahead of communications to stakeholders.
New Zealand Used Car Market Report Scope and Research Methodology
Market Definition and Coverage
This market covers the value of used vehicle retail activity in New Zealand, where passenger vehicles are resold through organized dealers and independent channels, including online listings. Pricing reflects the typical transaction values observed in the resale channel.
Scope exclusions: This sizing excludes new vehicle sales and avoids counting non-vehicle services as market value when they are billed separately, such as financing charges, insurance premiums, and servicing-only revenue.
Segments Covered in This Report
- By Vehicle Type
- Hatchbacks
- Sedans
- Sport-Utility Vehicles (SUVs)
- Multi-Purpose Vehicles (MPVs)
- Others (Convertibles, Coupes, Crossovers, Sports Cars)
- By Vendor Type
- Organized
- Unorganized
- By Fuel Type
- Petrol
- Diesel
- Hybrid and Electric
- Others (LPG, CNG, etc.)
- By Vehicle Age
- 0 - 2 Years
- 3 - 5 Years
- 6 - 8 Years
- 9 - 12 Years
- Above 12 Years
- By Price Segment
- Below USD 10,000
- USD 10,000 - USD 14,999
- USD 15,000 - USD 19,999
- USD 20,000 - USD 29,999
- Greater than and Equals USD 30,000
- By Sales Channel
- Online
- Offline
- By Ownership
- First-owner Resale
- Multi-owner
Data Sources, Market Sizing, and Validation
Desk Research
Desk research was used to map the demand backdrop and the supply pipeline that shapes used car turnover in New Zealand. We referenced public and official sources such as NZ Transport Agency (Waka Kotahi) releases on vehicle policy, Statistics New Zealand macro series, and New Zealand Customs trade data to interpret imported used vehicle availability.
To keep assumptions realistic, we also reviewed Motor Industry Association reporting and other reputable automotive industry publications that discuss sales activity, price movements, and mix shifts, for example hybrids and SUVs. Company annual reports, investor presentations, and dealer group disclosures were used to understand revenue patterns and channel behavior. Selective paid subscriptions for company financials, news, and shipment level trade checks were then used to verify timelines and spot outliers. The desk sources listed here are illustrative only, and many other public sources were also reviewed for data collection, validation, and clarification.
Primary Interviews and Surveys
Primary work focused on validating what a used car transaction looks like in practice, including typical price realization, channel mix between yard and online, and how fast inventory turns by vehicle age and fuel type. We spoke with dealers, import-focused sellers, remarketing participants, and adjacent ecosystem experts across New Zealand to close gaps that desk research cannot fully answer, and then to align the final assumptions with current market behavior.
Distribution of primary research fieldwork respondents
| Company type | Respondent position |
|---|---|
| Top tier: 35% | CXOs: 13% |
| Mid tier: 51% | Functional/Unit leaders: 31% |
| Smaller Players: 14% | Managers: 56% |
Market-Sizing & Forecasting
Sizing started with a top-down build where the used car demand pool was reconstructed using New Zealand vehicle turnover signals, import availability indicators, and observed pricing bands in the resale channel. The model was then pressure-tested with selective bottom-up approximations, such as sampled listings and dealer checks that convert volumes into value using realistic price points. This helps adjust totals when any single data series appears stretched.
Key inputs used in the model included used vehicle sales momentum, mix shift toward SUVs and low-emission options, the share of used imports versus domestically sourced vehicles, typical age and mileage bands that influence price, and the sales channel split between dealer yards and online-led journeys. Where direct measures were not consistently available, we filled gaps by applying conservative ranges from interviews, then using sensitivity checks so the overall value does not overreact to short-term spikes.
For forecasting, scenario analysis was used because policy settings and affordability conditions can shift quickly, which then changes both unit demand and the average selling price trajectory. Assumptions on import supply, interest-rate sensitivity, and fuel-type preference were reviewed with market participants. The final forecast was kept traceable to a small set of drivers that can be revisited each year.
Data Validation & Update Cycle
Validation was done by triangulating model outputs against independent market signals, then running variance checks across time series so one unusual year does not distort the curve. When mismatches were found, the underlying drivers were re-checked. This was followed by analyst review steps where calculations, units, and currency timing were revalidated before sign-off.
Reports are refreshed annually, with interim updates triggered when material events occur, such as major policy changes affecting vehicle imports or EV-related ownership costs. Before delivery, a fresh review pass is completed so clients receive the latest updated view based on the most recent public data and expert feedback.
Mordor Intelligence's New Zealand Used Car Market Sizing Compared With Other Published Estimates
Published market values for used cars in New Zealand can vary even when the topic looks similar, because different studies may count different channels, use different price logic, or convert currency at different points in time. In a market that is sensitive to imported supply and fast-changing consumer preferences, small definition changes can create noticeable gaps.
The main gap comes from what gets counted as market value, where Mordor Intelligence treats the market as used vehicle transaction value only and keeps financing, insurance, and separate service revenue outside the total. Some publishers blend those add-ons into a single retailing figure, or use list prices from listings rather than realized selling prices. Differences also show up when one estimate leans on a more aggressive price progression, or does not revisit assumptions after demand shocks, which pushes the current-year value away from what channel checks and turnover signals suggest.
Benchmark comparison
| Source | Market Size | Gaps in Research Methodology |
|---|---|---|
| Mordor Intelligence | USD 306.85 M (2025) | |
| Industry Data Publisher A | USD 340.00 M (2025) | Often built using advertised prices and broader retailing add-ons, which can inflate value when listing-to-transaction discounts and separately billed services are not normalized. |
| Regional Consultancy B | USD 280.00 M (2025) | Tends to apply conservative demand assumptions tied to weaker unit momentum and slower ASP recovery, and may not fully capture the value contribution of imported hybrids and newer SUVs in the mix. |
The comparison points to definition and price-realization treatment as the biggest reasons for the spread, followed by how quickly assumptions are refreshed after policy and affordability shifts. By keeping the steps tied to turnover signals, channel checks, and a clear inclusion list, our estimate stays easier to reproduce and update without relying on one-off pricing spikes.
Key Questions Answered in the Report
What is the current value of the New Zealand used car market?
The New Zealand used car market is valued at USD 323.37 million in 2026.
Which vehicle type leads the market?
Sport-utility vehicles lead with 45.12% share and are growing at a 5.88% CAGR through 2031.
How fast are hybrid and electric used-car sales growing?
Hybrid and electric models are the fastest-growing fuel category, advancing at a 13.78% CAGR to 2031.
Why are organized dealers gaining share?
Organized dealers offer warranties, financing, and digital services, enabling 6.42% CAGR growth while improving customer trust and convenience.