API Management Market Size and Share
Market Overview
| Study Period | 2020 - 2031 |
|---|---|
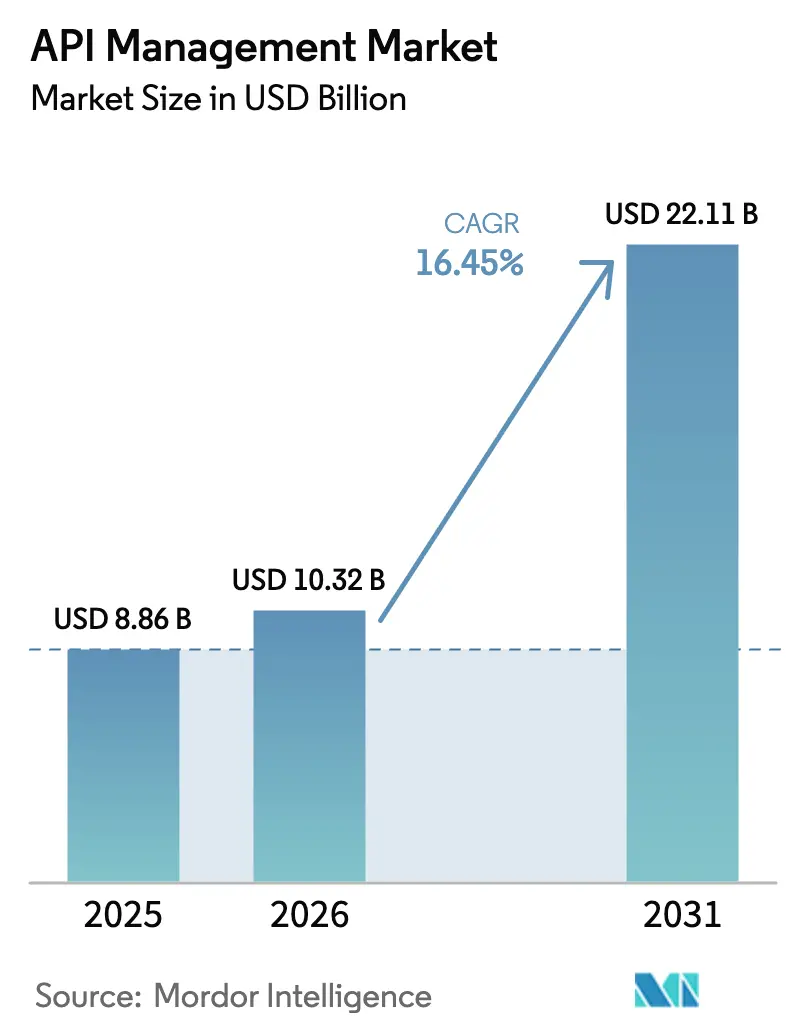
| Market Size (2026) | USD 10.32 Billion |
| Market Size (2031) | USD 22.11 Billion |
| Growth Rate (2026 - 2031) | 16.45% CAGR |
| Fastest Growing Market | Asia Pacific |
| Largest Market | North America |
| Market Concentration | Medium |
Major Players *Disclaimer: Major Players sorted in no particular order Image © Mordor Intelligence. Reuse requires attribution under CC BY 4.0. | |
API Management Market Analysis by Mordor Intelligence
The API Management Market size was valued at USD 8.86 billion in 2025 and estimated to grow from USD 10.32 billion in 2026 to reach USD 22.11 billion by 2031, at a CAGR of 16.45% during the forecast period (2026-2031).
Demand reflects enterprises’ shift from integration-centric deployments to API-first business models where each interface is treated as a revenue-generating digital product. Volume growth is anchored in cloud migrations that have matured into microservices, containers, and serverless ecosystems requiring full-lifecycle governance. Competitive intensity is rising as generative AI forces vendors to embed semantic caching, token management, and policy automation directly into gateways, raising the functional baseline for all contenders. Geographic momentum is strongest in Asia-Pacific, where large-scale 5G rollouts, government digitization programs, and the GSMA Open Gateway framework are accelerating multi-industry API uptake.
Key Report Takeaways
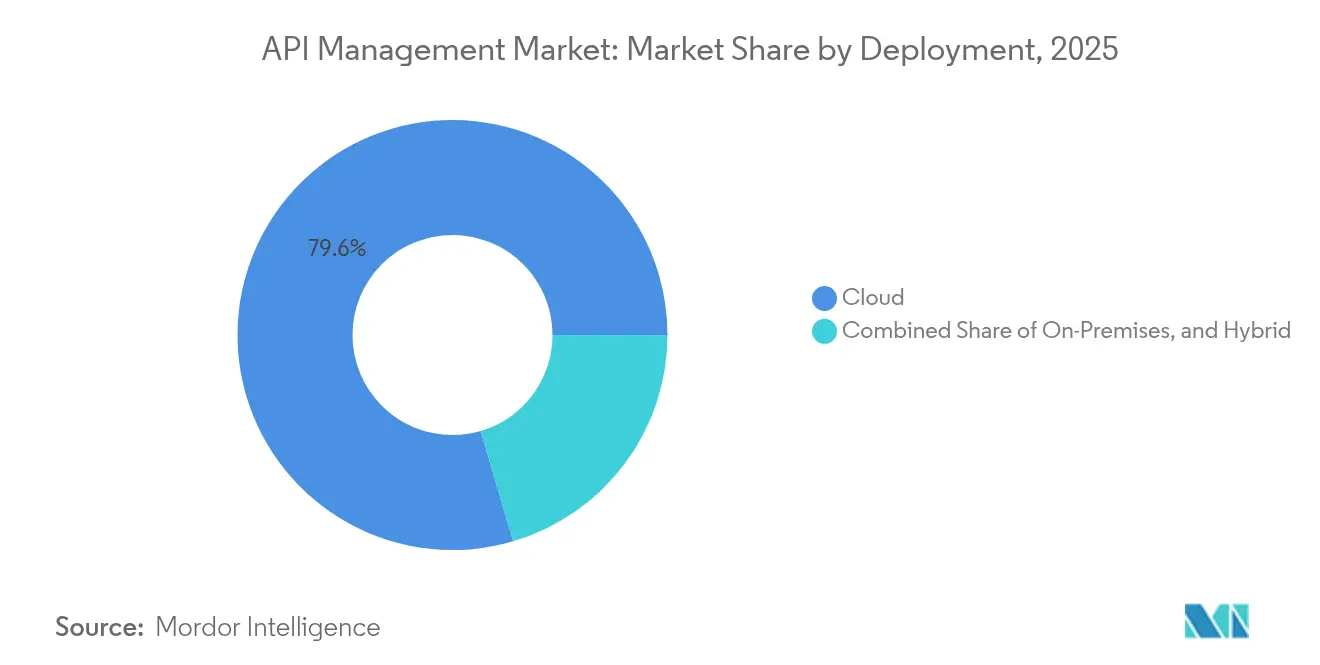
- By deployment model, cloud platforms held 79.55% of the API management market share in 2025, while hybrid architectures are projected to post a 21.10% CAGR through 2031.
- By offering, platform solutions accounted for 61.35% of the 2025 API management market size, whereas services are expected to expand at a 26.70% CAGR to 2031.
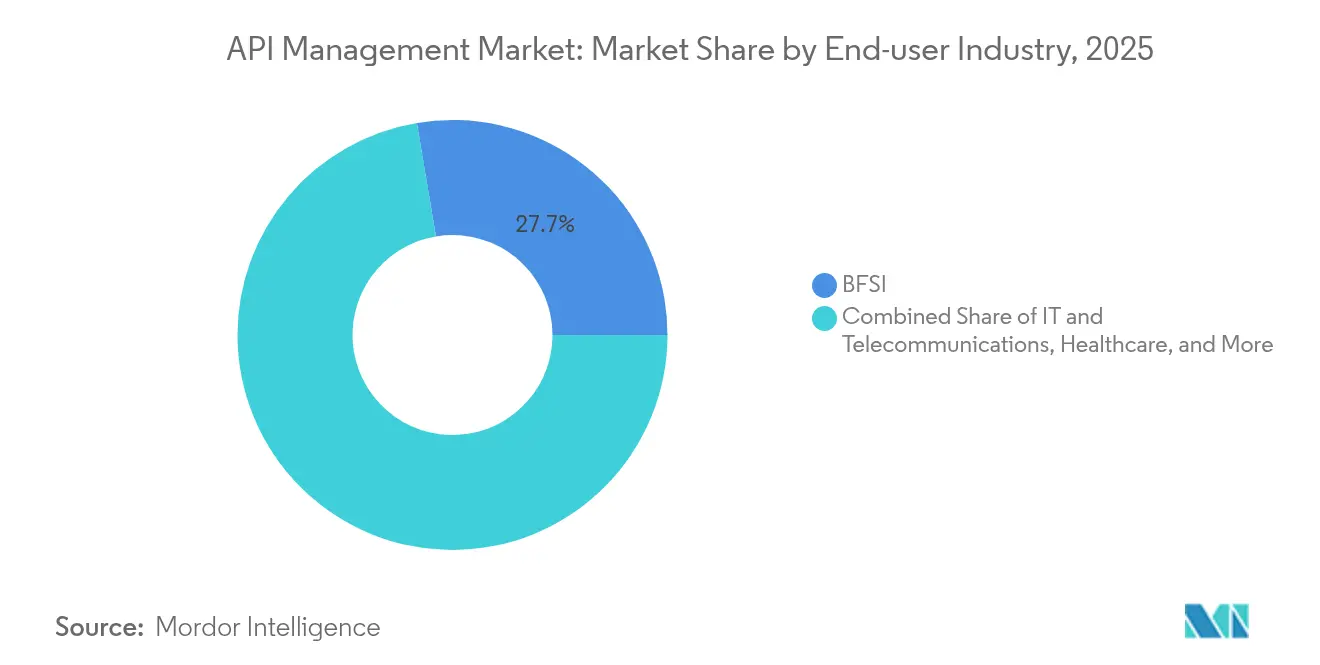
- By end-user industry, the banking, financial services, and insurance segment led with 27.65% revenue share in 2025; healthcare is set to grow fastest at 18.65% CAGR to 2031.
- By enterprise size, large companies captured 57.90% of the API management market size in 2025, while SMEs are advancing at a 25.55% CAGR through 2031.
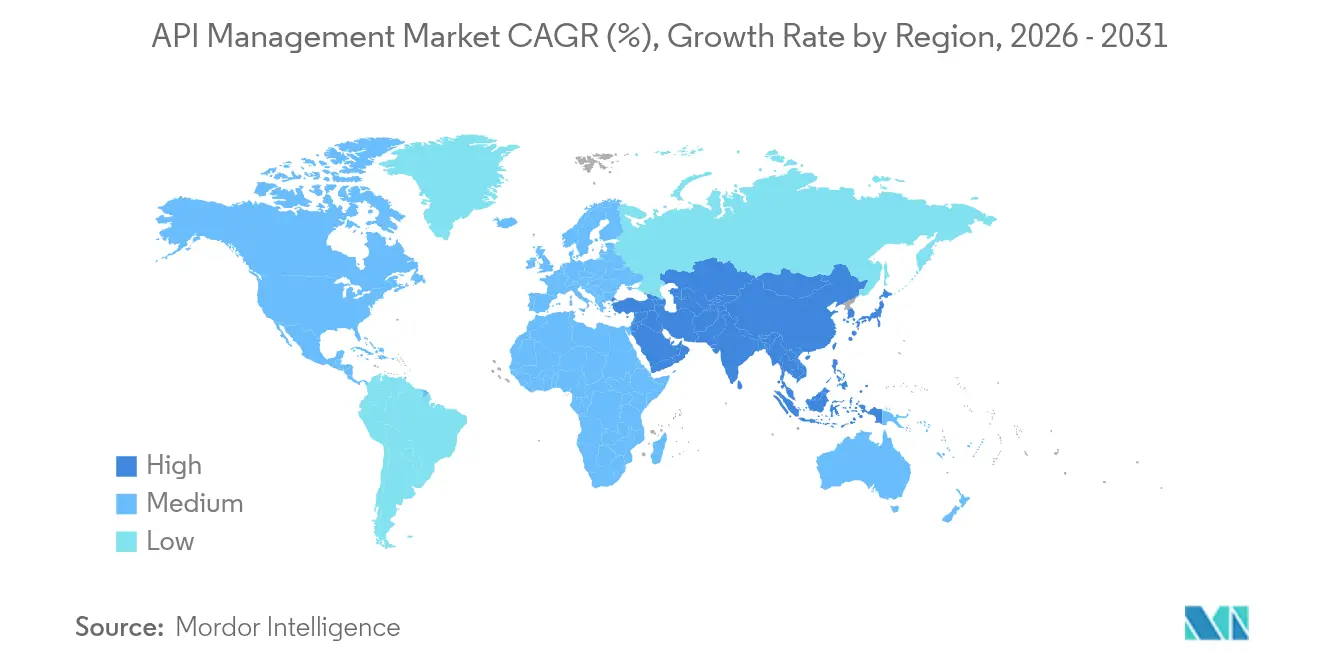
- By geography, North America dominated with 39.75% share in 2025; Asia-Pacific is forecast to register a 17.20% CAGR up to 2031.
Note: Market size and forecast figures in this report are generated using Mordor Intelligence’s proprietary estimation framework, updated with the latest available data and insights as of 2026.
Global API Management Market Trends and Insights
Drivers Impact Analysis*
| Driver | (~) % Impact on CAGR Forecast | Geographic Relevance | Impact Timeline |
|---|---|---|---|
| Cloud-native digital transformation | +4.2% | Global, concentrated in North America and EU | Medium term (2-4 years) |
| Surge in mobile and web applications | +3.8% | Asia-Pacific core, spill-over to global | Short term (≤ 2 years) |
| Investments in multi-cloud and hybrid IT | +3.1% | North America and EU enterprise markets | Medium term (2-4 years) |
| Generative-AI-driven code-assist APIs | +2.9% | Global, early adoption in tech hubs | Long term (≥ 4 years) |
| ESG pressure for “green” low-latency APIs | +1.4% | EU regulatory markets, expanding globally | Long term (≥ 4 years) |
| Monetisation of public API catalogues | +1.9% | Global, concentrated in digital economies | Medium term (2-4 years) |
| Source: Mordor Intelligence | |||
Cloud-native digital transformation
Mass adoption of containers and microservices makes full-lifecycle governance mandatory across build, deploy, and run phases. Microsoft’s Azure API Management now processes over 2 trillion monthly calls, underscoring the scale at which enterprises are re-platforming workloads. Companies adopting cloud-native architectures report 75% shorter release cycles once APIs are centrally governed. Serverless functions such as AWS Lambda are normalising event-driven endpoints, which require gateways that auto-scale and route traffic in real time. Kubernetes has become the de facto orchestration layer, driving demand for side-car gateways that support dynamic service discovery. The cumulative effect is a substantial uplift in the API management market as budgets move from legacy ESB refreshes to cloud-native tooling.
Surge in mobile and web applications
Mobile apps now embed 25–50 external calls per workflow, amplifying the need for granular throttling, schema versioning, and offline caching. Progressive web applications and single-page frameworks have popularised GraphQL, which demands fine-grained query cost analysis within gateways. Edge deployment is moving compute closer to users so that high-churn mobile traffic experiences sub-50 ms latency, a level unattainable with centralised clouds alone. AI-infused features such as real-time transcription and on-device vision further inflate payload sizes, reinforcing platform requirements for dynamic quota management. As a result, the API management market experiences sustained double-digit growth in regions with dense mobile penetration.
Investments in multi-cloud and hybrid IT
Enterprises using two or more hyperscalers now represent the majority of Fortune 500 organisations. Google Cloud’s USD 75 billion multi-year infrastructure program is designed to court these buyers by offering Apigee-native connectivity across regions [1]Google Cloud Blog, “Apigee: Native Kubernetes Operator Reaches GA,” cloud.google.com. Hybrid models integrate on-premises ERP with cloud analytics, compelling gateways to enforce consistent policies across heterogeneous runtimes. Sovereign cloud mandates in Europe obligate data to remain within national borders, making location-aware routing a gating feature for vendor selection. Vendors that unify traffic management, identity brokering, and observability across clouds capture premium share in the API management market
Generative-AI-driven code-assist APIs
Large language model services expose per-token pricing that can surge without granular usage telemetry. Modern gateways therefore bundle real-time cost dashboards, token bucket rate control, and prompt auditing so finance teams can predict spend. Semantic caching uses embeddings to deduplicate similar prompts, cutting latency and spend simultaneously. Identity overlays integrate with OIDC to ensure that sensitive prompts are only issued by authorised roles. These AI-specific capabilities catalyse upgrades among existing users, lifting the API management market size further into enterprise core budgets.
Restraints Impact Analysis*
| Restraint | (~) % Impact on CAGR Forecast | Geographic Relevance | Impact Timeline |
|---|---|---|---|
| Implementation complexity and legacy lock-in | -2.8% | Global, acute in large enterprises | Short term (≤ 2 years) |
| API security and governance gaps | -3.2% | Global, concentrated in regulated sectors | Medium term (2-4 years) |
| Skill shortage in event-driven async APIs | -1.9% | Global, severe in emerging markets | Medium term (2-4 years) |
| API cost sprawl in pay-as-you-go models | -1.6% | Cloud-first organisations globally | Short term (≤ 2 years) |
| Source: Mordor Intelligence | |||
Implementation complexity and legacy lock-in
Mainframes resist modular decomposition, driving projects to exceed budgets and deadlines. Three-quarters of large enterprises report security incidents traceable to legacy endpoints inadequately shielded by modern controls [2]Traceable, “2025 Global API Security Report,” traceable.ai. Expensive per-core pricing of incumbent ESBs discourages parallel API gateways, extending technical debt. Organisations often lack platform engineering teams capable of stitching Kubernetes ingress, service mesh, and API governance into a coherent whole, delaying full adoption. These factors temper growth in the short term even as strategic intent remains high.
API security and governance gaps
Shadow endpoints proliferate as teams release microservices without registering them, creating blind-spots that automated scanners miss. More than half of security teams still review API logs less than once per day, leaving ample dwell time for adversaries. Regulatory updates such as PCI DSS 4.0 impose explicit API controls, escalating compliance costs. Multi-cloud estates magnify the challenge because each provider offers different native WAF and IAM primitives, complicating centralised governance. Despite these headwinds, the need for protection ultimately reinforces demand for platforms that embed zero-trust patterns.
*Our forecasts treat driver/restraint impacts as directional, not additive. The impact forecasts reflect baseline growth, mix effects, and variable interactions.
Segment Analysis
By Deployment: Hybrid Architectures Drive Innovation
Cloud deployments held 79.55% of the API management market share in 2025 on the back of hyperscaler platforms that bundle gateways as managed services. Hybrid models, however, are advancing at a 21.10% CAGR and are expected to shift the API management market size materially by 2031. The rise stems from privacy regulations that require sensitive data to remain on-premises while still benefiting from elastic public cloud capacity. Microsoft’s Arc-enabled API Management allows containerised gateways to run anywhere while centralising policy orchestration.
Edge rollouts amplify the hybrid theme by placing lightweight gateways in regional POPs so latency-sensitive mobile and IoT traffic bypasses long back-haul routes. Financial services institutions adopt sovereign cloud regions to process payments domestically, driving incremental spend in hybrid tooling. Manufacturing firms use hybrid gateways to bridge plant-floor OT systems with cloud analytics, illustrating sector-agnostic relevance. Consequently, vendors that package runtime agnosticism, central dashboards, and location-aware routing consolidate share in the API management market.


By Offering: Services Acceleration Reflects Complexity
Platform suites dominated with 61.35% of 2025 revenue, yet services lines are forecast to compound at 26.70% through 2031 as enterprises outsource architecture reviews, policy authoring, and 24/7 operations. This trajectory positions managed services as the fastest measure of expansion for the API management industry. The rapid uptake comes from skill shortages in AI policy generation, GraphQL optimisation, and distributed tracing. Vendors differentiate by bundling developer portals with revenue-split billing engines that simplify external monetisation initiatives.
API lifecycle modules such as contract testing and spec-first design have reached feature parity across top providers, nudging buyers toward vendors that offer consulting accelerators. Security services post the highest attach rates because enterprises struggle with schema-aware firewall tuning. As pipelines standardise around OpenAPI and AsyncAPI, advisory teams help industrialise style guides and governance templates, enlarging the API management market size devoted to professional services.
By End-user Industry: Healthcare Momentum Accelerates
Financial services continued to lead with 27.65% share of the API management market size in 2025, a legacy of open-banking regulations that mandated secure third-party access. Healthcare, however, is charting a 18.65% CAGR as interoperability rules under the 21st Century Cures Act take hold. Hospital networks deploy FHIR-compliant APIs to meet patient-access deadlines, translating to bulk gateway purchases. Remote patient monitoring and telemedicine platforms rely on low-latency APIs to stream real-time vitals, raising throughput requirements.
Retail and e-commerce invest heavily in personalisation engines that call dozens of services per page render, but the absolute spend remains lower than finance and healthcare. Manufacturing adoption focuses on asset-tracking microservices that bridge shop-floor OPC-UA messages to cloud analytics. As digital twins and predictive maintenance scale, the API management market sees incremental demand from industrial IoT workloads.
By Enterprise Size: SME Democratisation Continues
Large enterprises accounted for 57.90% of 2025 expenditure because their sprawling system estates require granular policy controls and high-availability clusters. SMEs, however, are expanding at 25.55% CAGR thanks to subscription tiers that scale from free community editions to pay-as-you-grow SKUs. The entry of VC-backed start-ups that are API-first from inception accelerates this trend, compressing the timeline from experimentation to enterprise-grade consumption.
Self-service onboarding, credit-card billing, and SaaS-native gateways remove procurement friction historically associated with heavyweight platforms. Documentation generators and low-code wizards reduce the need for full-time architects, aligning with SME staffing realities. Consequently, the API management market garners a rising fraction of spend from companies with fewer than 1,000 employees, even as Fortune 500 renewals keep absolute large-enterprise share high.
Geography Analysis
North America retained 39.75% of 2025 revenue on the strength of early cloud adoption, venture funding, and a deep pool of platform engineers. The region benefits from aggressive AI experimentation, driving premium purchases that bundle semantic caching and fine-grained cost metrics. The United States federal government’s zero-trust memo has further accelerated public-sector gateway deployments, reinforcing regional leadership.
Asia-Pacific is on track for a 17.20% CAGR through 2031, the highest globally. Telecom operators participating in the GSMA Open Gateway initiative are exposing network APIs that enable quality-of-service controls, location verification, and carrier billing. Governments in India, Indonesia, and Vietnam are funding digital public infrastructure that relies heavily on standardised APIs for citizen services. Mobile-first consumer behaviour multiplies traffic loads, prompting hyperscalers to open new zones across Southeast Asia, which in turn grows the API management market.
Europe registers steady growth anchored in GDPR compliance and sovereign cloud strategies that privilege local hosting. Vendors that certify to EU Cybersecurity Act criteria win strategic accounts, particularly in Germany and France. Latin America and the Middle East remain nascent yet fast-growing, driven by fintech and smart-city initiatives respectively. Combined, these emerging markets contribute a small but rising slice of the global API management market size.

Competitive Landscape
The market shows moderate consolidation. Microsoft, Amazon, and Google each bundle gateways with adjacent cloud services, creating natural pull-through demand. Azure alone handles over 2 trillion calls per month, while AWS capitalises on its USD 100 billion run-rate to embed API Gateway and EventBridge ubiquitously. Google leans on Apigee’s AI auto-classification to simplify spec onboarding and differentiate from pure-play rivals.
Specialists such as Kong emphasise service-mesh integration and have secured USD 175 million Series E financing to expand globally. Tyk, WSO2, and Gravitee compete on open-source transparency, attracting developers who want code visibility and community plugins. Security-first vendors are acquisition targets, evidenced by Akamai’s USD 450 million purchase of Noname Security to harden its cloud perimeter [3] Akamai Technologies, “Akamai to Acquire Noname Security for API Protection,” akamai.com.
Generative AI drives the next wave of feature differentiation. Providers now ship prompt-safety filters, token-level rate controls, and model-audit logs as first-class options. Partnerships with Nvidia and Anthropic embed GPU inference endpoints directly inside gateways, aligning observability and cost-tracking in a single pane. Vertical packs for healthcare, finance, and telecoms accelerate time to value, giving incumbents fresh upsell levers while raising the bar for new entrants.
API Management Industry Leaders
Google LLC
IBM Corporation
Amazon Web Services, Inc.
MuleSoft (Salesforce Inc.)
Microsoft Corporation
- *Disclaimer: Major Players sorted in no particular order


Recent Industry Developments
- May 2025: WSO2 completed the acquisition of Moesif to enhance API analytics and monetisation capabilities.
- May 2025: Google Cloud announced general availability of APIM Operator for Apigee, enabling Kubernetes-native deployments.
- November 2024: Kong raised USD 175 million in Series E financing at USD 2 billion valuation to accelerate AI-powered platform expansion.
- November 2024: Nokia acquired Rapid to strengthen API marketplace offerings.


Research Methodology Framework and Report Scope
Market Definitions and Key Coverage
Our study treats the API management market as all software platforms and related services that design, publish, secure, monitor, and monetize application programming interfaces, whether those APIs connect internal micro-services or expose data to outside partners.
Scope exclusions: Toolkits limited to single-application orchestration or pure API security scanners are not counted.
Segmentation Overview
- By Deployment
- Cloud
- On-premise
- Hybrid
- By Offering
- Platform
- API Lifecycle Management
- API Analytics and Monitoring
- API Gateway
- API Security
- Developer Portal
- Others
- Services
- Platform
- By End-user Industry
- BFSI
- IT and Telecommunications
- Healthcare
- Retail and E-commerce
- Manufacturing
- Government and Public Sector
- Media and Entertainment
- Others
- By Enterprise ize
- Large Enterprises
- Small and Medium-sized Enterprises (SMEs)
- By Geography
- North America
- United States
- Canada
- Mexico
- South America
- Brazil
- Argentina
- Rest of South America
- Europe
- Germany
- United Kingdom
- France
- Italy
- Spain
- Russia
- Rest of Europe
- Asia-Pacific
- China
- Japan
- India
- South Korea
- Australia and New Zealand
- Rest of Asia-Pacific
- Middle East and Africa
- Middle East
- Saudi Arabia
- United Arab Emirates
- Turkey
- Rest of Middle East
- Africa
- South Africa
- Nigeria
- Egypt
- Rest of Africa
- Middle East
- North America
Detailed Research Methodology and Data Validation
Primary Research
Mordor analysts completed interviews and short surveys with platform architects at banks, telecom operators, SaaS vendors, and regional cloud specialists in North America, Europe, and Asia-Pacific. Those conversations clarified average deployment sizes, the shift toward multi-cloud, and realistic pay-per-call pricing, filling data gaps left by desk work and shaping scenario inputs.
Desk Research
We began by mapping the global stock of APIs and spending patterns using open datasets from sources such as the US Digital Services Catalog, EU Open Data Portal, the World Bank's ICT indicators, and trade filings housed in EDGAR. Industry-specific adoption cues were drawn from organizations such as GSMA, Open Banking Implementation Entity, and CNCF reports on micro-service prevalence. Financial cut-through came from D&B Hoovers and news screening through Dow Jones Factiva, which helped flag unusual revenue swings. These sources provided the first demand envelope, the typical price corridors, and early growth signals. The sources listed are illustrative; many other public and proprietary references informed the evidence base.
Market-Sizing & Forecasting
A top-down read of vendor revenue disclosures, public procurement data, and API call volume statistics established the 2025 revenue pool. Results were cross-checked with selective bottom-up roll-ups of sample contracts and average selling price multiplied by active account counts. Key variables like the number of public APIs per enterprise, share of workloads in containerized environments, average micro-services count, digital payment volume, and timing of open-banking regulations drive both base year value and growth deltas. Multivariate regression combined with scenario analysis projects each driver to 2030; outliers are smoothed using three-year moving averages where primary respondents signal one-off spikes.
Data Validation & Update Cycle
Outputs pass variance checks against external macro indicators, then senior reviewers challenge anomalies before sign-off. The dataset refreshes annually, with ad-hoc updates whenever policy shifts or material acquisitions alter demand, and one final sweep is run just prior to publication so clients receive the latest view.
Why Mordor's API Management Baseline Deserves Your Trust
Published figures often diverge because firms apply different scope filters, currency year bases, and refresh cadences.
Key gap drivers here include: some publishers blend adjacent network API spend, others assume uniform price drops, while a few rely on five-year-old adoption ratios. Our study reports the full stack of management platforms and paid services only, applies current regional ASPs, and is re-benchmarked each year against live usage indicators.
Benchmark comparison
| Market Size | Anonymized source | Primary gap driver |
|---|---|---|
| USD 8.86 B (2025) | Mordor Intelligence | - |
| USD 7.67 B (2024) | Global Consultancy A | Includes gateway-only revenue and older currency base |
| USD 5.42 B (2024) | Industry Publisher B | Uses limited cloud-only scope and static price erosion |
These comparisons show that when scope breadth, data freshness, and multi-source validation align, Mordor offers the most balanced and repeatable starting point for strategic decisions.


Key Questions Answered in the Report
What is the current size of the API management market?
The market is valued at USD 10.32 billion in 2026 and is projected to reach USD 22.11 billion by 2031.
Which deployment model is growing fastest?
Hybrid architectures are the fastest, expanding at a 21.10% CAGR as organisations balance on-premises control with cloud scalability.
Why is healthcare adoption accelerating?
Regulations that mandate FHIR-based interoperability and the rise of digital health platforms are driving a 18.65% CAGR in healthcare demand.
How are generative AI tools affecting API management platforms?
Vendors are embedding semantic caching, token-level billing, and prompt governance to manage large language model APIs efficiently.
Which region offers the greatest growth potential?
Asia-Pacific shows the highest forecast CAGR at 17.20%, propelled by 5G rollouts, telco API initiatives, and government digitisation programs.
What are the main security challenges in API ecosystems?
Shadow endpoints, inconsistent multi-cloud controls, and business-logic attacks are the leading issues, prompting greater investment in zero-trust gateways.
Page last updated on:


