Network Automation Market Size and Share
Market Overview
| Study Period | 2019 - 2030 |
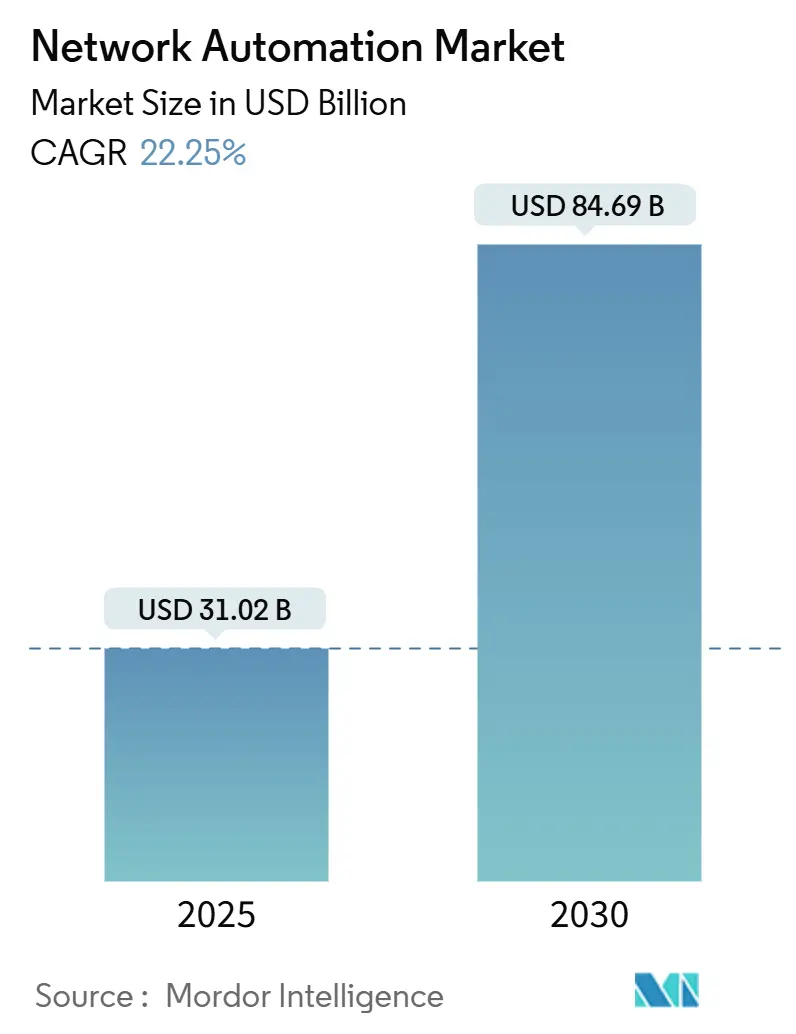
| Market Size (2025) | USD 31.02 Billion |
| Market Size (2030) | USD 84.69 Billion |
| Growth Rate (2025 - 2030) | 22.25% CAGR |
| Fastest Growing Market | Asia Pacific |
| Largest Market | North America |
| Market Concentration | Medium |
Major Players*Disclaimer: Major Players sorted in no particular order Image © Mordor Intelligence. Reuse requires attribution under CC BY 4.0. |
|
Network Automation Market Analysis by Mordor Intelligence
The network automation market size is estimated at USD 31.02 billion in 2025 and is on track to reach USD 84.69 billion by 2030, translating into a vigorous 22.25% CAGR. Growth is propelled by enterprises racing to tame sprawling hybrid environments, trim operating costs, and eliminate configuration errors through policy-driven orchestration. Cloud-first migration, widespread SD-WAN adoption, and surging investment in 5G network slicing are creating a perfect backdrop for automation uptake. At the same time, AI-enabled self-healing capabilities are shifting expectations from basic scripting to autonomous operations. Vendors that seamlessly blend intent-based networking with multi-cloud visibility advance fastest, while customers prioritize open APIs to prevent lock-in and speed DevOps integration.
Key Report Takeaways
- By network infrastructure, hybrid architectures held 47.6% of network automation market share in 2024 while advancing at a 22.9% CAGR toward 2030.
- By component, solutions contributed 69.3% revenue in 2024; services are expanding at 22.7% CAGR as firms outsource complex rollouts.
- By deployment mode, cloud delivery captured 52.7% share of network automation market size in 2024 and is set to compound at 24.1% CAGR.
- By organization size, large enterprises commanded 72.7% demand in 2024 yet SMEs are the fastest-growing cohort at 23.9% CAGR.
- By end-user industry, IT and telecom led with 23.2% share in 2024, while banking and financial services post the highest 24.3% CAGR through 2030.
- By geography, North America commanded 27.5% demand in 2024 yet Asia-Pacific are the fastest-growing at 22.4% CAGR
Global Network Automation Market Trends and Insights
Drivers Impact Analysis
| Driver | (~) % Impact on CAGR Forecast | Geographic Relevance | Impact Timeline |
|---|---|---|---|
| Surge in data-center network upgrades | +4.20% | Global, with concentration in North America and Asia-Pacific | Medium term (2-4 years) |
| IoT and connected-device proliferation | +3.80% | Global, strongest in Asia-Pacific manufacturing hubs | Long term (≥ 4 years) |
| Rapid SD-WAN and virtualization roll-outs | +3.50% | North America and Europe, expanding to Asia-Pacific | Short term (≤ 2 years) |
| Cloud and multi-cloud migration wave | +4.10% | Global, led by North America and Europe | Medium term (2-4 years) |
| AI-driven self-healing intent-based nets | +3.20% | North America and Europe early adoption, Asia-Pacific following | Long term (≥ 4 years) |
| Zero-touch 5G network-slicing monetization | +2.70% | Asia-Pacific and Europe 5G leaders, selective North America | Long term (≥ 4 years) |
Source: Mordor Intelligence
Surge in data-center network upgrades
Spiking AI workloads are forcing operators to install 400 G, 800 G, and soon 1.6 T switching fabrics to interconnect GPU clusters efficiently. Amazon’s USD 30 billion outlay across Pennsylvania and North Carolina underscores how hyperscalers rely on advanced automation to coordinate massive leaf-spine fabrics. Enterprises outside hyperscale are upgrading too; traditional 10 G links no longer support data-intensive analytics, accelerating demand for intent-based configuration of optical and packet layers. Operators deploy software-defined telemetry that triggers remediation workflows without human review. Fiber provider Zayo earmarked USD 4 billion for long-haul expansion aligned to this upgrade cycle, reflecting confidence in doubled AI data-center capacity by 2030.[1]Rich Miller, “AI Workloads Drive $100B Data Center Boom,” Data Center Frontier, datacenterfrontier.com
IoT and connected-device proliferation
Factory floors now host thousands of sensors demanding deterministic latency, forcing managers to replace manual VLAN provisioning with closed-loop segmentation. Ericsson’s Nanjing plant saw ROI in twelve months after connecting 500 screwdrivers via LTE-M, saving USD 10,000 in annual maintenance. [2]Ericsson Corporate Newsroom, “PANDA Factory Realizes 50% ROI with Cellular IoT,” ericsson.com Smart-meter rollouts illustrate similar impact: Honeywell embeds Verizon 5G to enable remote metering that eliminates technician visits and improves grid forecasting. Such deployments multiply device counts and micro-flows that only programmable networks can police effectively. As smart-city and grid projects scale across APAC, the network automation market benefits from persistent investment in real-time traffic engineering and rapid policy diffusion.
Rapid SD-WAN and virtualization roll-outs
Enterprises are retiring MPLS in favor of SD-WAN to optimize SaaS performance. Lotte Group lowered branch connectivity costs 40% across 120 Korean retail sites while gaining application-level failover managed centrally. [3]Cisco Case Library, “Lotte Group Cuts WAN Costs by 40%,” cisco.com Hardware abstraction extends beyond WAN routing: companies virtualize firewalls and load balancers on commodity servers, shrinking branch footprints. AutoNation rolled Cisco SD-WAN to 300 dealerships, cutting deployment cycles from weeks to hours and gaining granular analytics. This shift positions SD-WAN as an on-ramp for broader policy-driven automation in LAN, wireless, and data-center domains.
Cloud and multi-cloud migration wave
As workloads scatter across AWS, Azure, Google Cloud, and edge locations, operators need one policy fabric that spans all execution venues. Salesforce orchestrates traffic for 150 offices through automated intent pipelines that optimize routes per app SLA in real time. Containers and microservices amplify east-west flows, exposing perimeter-centric security as inadequate. Automation now adjusts routing, encryption, and QoS at per-service granularity, ensuring compliance while preventing shadow IT. Multi-cloud complexity keeps driving spending on unified controllers that program cloud VPCs and on-prem switches from the same template, reinforcing long-run adoption momentum.
Restraints Impact Analysis
| Restraint | (~)% Impact on CAGR Forecast | Geographic Relevance | Impact Timeline |
|---|---|---|---|
| Shortage of automation-skilled engineers | -2.80% | Global, most acute in North America and Europe | Short term (≤ 2 years) |
| Legacy infrastructure integration issues | -2.10% | Global, particularly in established enterprises | Medium term (2-4 years) |
| Proprietary platform vendor-lock-in risk | -1.40% | Global, affecting multi-vendor environments | Long term (≥ 4 years) |
| Cross-border change-control compliance | -1.20% | Europe and regulated industries globally | Medium term (2-4 years) |
Source: Mordor Intelligence
Shortage of automation-skilled engineers
Atomitech’s 2025 survey shows 92.2% of ops staff struggle with skills shortages even as 75% already deploy AI for incident triage. Automation expertise now spans Python, RESTful APIs, and infrastructure-as-code, leaving traditional CCNA-level administrators behind. Firms accelerate in-house training and partner with universities, yet the learning curve delays projects and inflates wages. Semiconductor talent deficits deepen the gap because specialized NICs and accelerators underpin high-performance automation pipelines. Vendors reply with low-code orchestration and GenAI copilots, but adoption still hinges on a labor pool not growing fast enough to match demand.
Legacy infrastructure integration issues
Brownfield networks piled up over decades feature proprietary CLI syntax and brittle change-control rules. CDO Trends reports that phased infrastructure-as-code pilots help enterprises swap manual configurations for automated pipelines without downtime. Gluware’s template discovery identifies golden configs then generates automation artifacts, easing transition for Fortune 500 operators. Ciena advocates digital-twin modeling so planners test policy changes against a virtual copy before touching production. Despite tool advances, overlapping vendor syntax and undocumented custom scripts slow replacements, reducing ROI potential in the near term.
Segment Analysis
By Network Infrastructure: Hybrid Dominance Drives Integration
Hybrid architectures delivered USD 14.8 billion in 2024, representing 47.6% of network automation market share and expanding at a 22.9% CAGR toward 2030. The hybrid mix lets organizations preserve sunk investments in fixed chassis switches while overlaying virtual fabrics for bursty cloud workloads. Early migrations focus on edge device auto-provisioning, followed by spine-leaf policy automation in the core. Financial trading desks and industrial plants keep deterministic, non-virtual links for latency-sensitive functions, illustrating why physical assets endure. At the same time, virtual overlays carry micro-services traffic, shrinking change windows from days to minutes.
Hybrid deployments also mitigate outage risk by phasing legacy retirement behind automated fault domains. DENSO updated 400 factories using Cisco DNA Center without halting production, showcasing how event-driven templates handle simultaneous firmware refresh across continents. Service providers embed performance telemetry in both physical and virtual nodes, feeding AI engines that pre-empt SLA violations. Consequently, the network automation market registers recurring license revenue as customers scale controllers across hybrid estates.

Note: Segment shares of all individual segments available upon report purchase
By Component: Solutions Lead While Services Accelerate
Solutions produced 69.3% of 2024 revenue, equal to USD 21.5 billion, yet services grow faster at 22.7% CAGR. Enterprises buy orchestration suites spanning configuration, assurance, and analytics, but success depends on tailored playbooks, thus fueling services expansion. Intent-based engines need topology discovery, policy modeling, and integration with ITSM platforms, tasks many internal teams defer to specialists.
Professional services break into three categories: advisory, build, and managed operations. Telecom Italia teamed with Itential to compress service rollouts by 70%, illustrating co-innovation where integrators script domain-specific workflows. Meanwhile, post-deployment managed services monetize recurring compliance checks and patch automation. Vendors with consulting arms differentiate by packaging best-practice libraries that cut onboarding time, reinforcing their software base and driving subscription renewals.
By Deployment Mode: Cloud-Native Architecture Momentum
Cloud delivery captured 52.7% of 2024 revenue, underscoring how SaaS controllers offload appliance upkeep and enable global policy propagation within minutes e. At 24.1% CAGR, cloud-hosted platforms outpace on-prem competitors by bundling AI diagnostics, continuous updates, and elastic licensing. Enterprise architects favor API-driven pipelines where Terraform modules spin up overlay policies across public VPCs and branch routers simultaneously.
Yet regulated sectors keep selective functions on-prem to satisfy data-sovereignty mandates. Hybrid cloud rises as a bridging model: controllers run in vendor SaaS while sensitive flow logs stay local. Extreme Networks integrates Fabric Connect with its cloud manager so European hospitals maintain records on site yet enjoy remote orchestration. Zero Trust Edge services accelerate cloud pull by delivering per-session authentication without VPN hardware, evidenced when NTT DATA deployed Zscaler for 50,000 users in one month.

By Organization Size: Enterprise Foundation, SME Growth Engine
Enterprises contributed 72.7% of 2024 spending as their vast device counts demand automated remediation to maintain uptime, making them early adopters. Fortune 100 banks push multi-vendor scripts into CI/CD pipelines, reducing overnight maintenance windows from eight hours to two. Nonetheless, SMEs post 23.9% CAGR through 2030 as low-code SaaS lowers entry friction.
Cost remains top concern for SMEs, driving appetite for network-as-a-service bundles that replace capex hardware with subscription Wi-Fi, routing, and security managed by vendor cloud. Milesight’s smart-factory kit targets mid-size manufacturers with pre-integrated IoT gateways that auto-register to a central console, shrinking deployment to one day. As SMEs adopt hybrid work and e-commerce, simplified policy templates become decisive, steering competition toward intuitive dashboards rather than feature bloat.
By End-User Industry: Telecom Leadership, Financial Services Momentum
IT and telecommunications represented 23.2% of 2024 revenue, validating new features before they diffuse to other sectors . Operators automate 5G core slicing so enterprise customers order bandwidth-as-code, bypassing manual provisioning delays. Deutsche Telekom’s demos highlight revenue potential once SLA enforcement becomes programmatic. Banking follows with 24.3% CAGR because algorithmic trading and real-time fraud analytics cannot tolerate human-induced latency.
Manufacturing, energy, healthcare, and government each build automation for compliance and efficiency. Delaware State University adopted campus-wide fabric with micro-segmentation to safeguard hybrid learning while cutting operational tickets by half. Collectively, diverse verticals drive vendors to modularize offerings for quick vertical tailoring, thereby widening network automation market adoption worldwide.

Note: Segment shares of all individual segments available upon report purchase
Geography Analysis
North America controlled 27.5% of 2024 revenue, anchored by hyperscale cloud operators and defense agencies that demand continuous compliance automation Amazon’s USD 30 billion infrastructure build demonstrates scale economics, while the US Marine Corps’ Comply-to-Connect program achieved 95% patch success and freed audit personnel for higher-value tasks. An ecosystem of venture-backed startups further enriches the regional stack, shortening innovation cycles.
Asia-Pacific is the fastest climber, expanding at 22.4% CAGR through 2030 on the back of Industry 4.0 initiatives and expansive 5G footprints. SoftBank committed USD 960 million to AI compute tied to network automation that governs multi-cloud connectivity for Japanese conglomerates Meanwhile, NTT tests autonomous 5G optimization using AI, illustrating how telcos treat automation as revenue enabler, not just cost lever nec.com.
Europe maintains steady momentum, blending stringent GDPR compliance with green IT mandates that favor energy-aware routing. Elisabeth-TweeSteden Hospital centralized operations via Extreme Networks Fabric, meeting healthcare data-protection rules while reducing onsite visits . Governments across the region back joint research into sovereign cloud stacks, spurring demand for open-source orchestration.

Competitive Landscape
The network automation market is moderately concentrated, with incumbents leveraging installed bases while cloud hyperscalers and AI-native upstarts intensify rivalry. Cisco, Juniper, and Arista ship full-stack platforms combining wired, wireless, and WAN orchestration. They reinforce moats through custom ASICs that expose open APIs, ensuring software differentiation. Still, hardware commoditization shifts value toward analytics and closed-loop assurance.
Strategic merger activity illustrates portfolio expansion. Hewlett Packard Enterprise’s USD 14 billion purchase of Juniper seeks to fuse Aruba edge services with Juniper’s Mist AI for end-to-end intent engines . This arms-race responds to hyperscalers building in-house fabrics, pressuring vendors to match cloud agility. Meanwhile, startup Meter raised USD 170 million to deliver plug-and-play wired and wireless infrastructure that includes fully managed automation out of the box.
Emerging disruptors carve niches. DevAI develops autonomous agents that write remediation code without human prompts, enabling small teams to oversee vast estates. Blue Planet digital twin models won Lumen Technologies’ inventory overhaul, signaling telco trust in specialist software. Vendors differentiate through security integration, multi-cloud reach, and packaged vertical playbooks rather than raw through-put numbers, anticipating a customer base seeking outcome-oriented solutions.
Network Automation Industry Leaders
-
Cisco Systems Inc.
-
Juniper Networks Inc.
-
IBM Corporation
-
Hewlett Packard Enterprise Company
-
Solarwinds Corporation
- *Disclaimer: Major Players sorted in no particular order

Recent Industry Developments
- June 2025: Meter, backed by Sam Altman, raised USD 170 million to accelerate AI-based network automation offerings.
- May 2025: Arista Networks posted record quarterly revenue above USD 2 billion, unveiled a USD 1.5 billion buyback, and secured a Leader spot in the Gartner 2025 Data Center Switching Magic Quadrant.
- March 2025: ServiceNow agreed to acquire Moveworks for USD 2.85 billion to deepen AI-powered automation within its workflow platform.
- March 2025: Gluware launched a GenAI Co-Pilot claimed to speed NetDevOps code creation 100×, integrating NetBox and GitHub for continuous delivery.
Global Network Automation Market Report Scope
Network automation is the process of automating the configuration, management, and operations of a computer network. With most applications relying on data centers, supporting them through increased virtualization, standardization, and automation has become a key factor for better performance, higher capacity, and throughput.
The scope of the study covers network automation solutions and service types around the globe, and the market size encompasses the revenue generated from network automation solutions and service types offered by various players operating in the market. The study also tracks the key market parameters, underlying growth influencers, and major vendors operating in the industry, which supports the market estimations and growth rates over the forecast period.
The network automation market is segmented by network type (physical, virtual, and hybrid), component (solution type [network automation tools, SD-WAN and network virtualization, and intent-based networking] and service type [managed service and professional service]), deployment (cloud, on-premise, and hybrid), end-user industry (IT and telecom, manufacturing, energy and utility, banking and financial services, education, and other end-user industries), and geography (North America, Europe, Asia-Pacific, Latin America, and Middle East and Africa). The report offers market forecasts and size in value in USD for all the above segments.
| By Network Infrastructure | Physical | |||
| Virtual | ||||
| Hybrid | ||||
| By Component | Solutions | |||
| Services | ||||
| By Deployment Mode | Cloud | |||
| On-premise | ||||
| By Organization Size | Large Enterprises | |||
| Small and Medium Enterprises | ||||
| By End-user Industry | IT and Telecom | |||
| Banking and Financial Services | ||||
| Manufacturing | ||||
| Energy and Utilities | ||||
| Education | ||||
| Healthcare | ||||
| Government and Defense | ||||
| Other Industries | ||||
| By Geography | North America | United States | ||
| Canada | ||||
| Mexico | ||||
| South America | Brazil | |||
| Argentina | ||||
| Rest of South America | ||||
| Europe | Germany | |||
| United Kingdom | ||||
| France | ||||
| Italy | ||||
| Spain | ||||
| Rest of Europe | ||||
| Asia-Pacific | China | |||
| India | ||||
| Japan | ||||
| South Korea | ||||
| Australia | ||||
| Rest of Asia-Pacific | ||||
| Middle East and Africa | Middle East | Saudi Arabia | ||
| United Arab Emirates | ||||
| Turkey | ||||
| Rest of Middle East | ||||
| Africa | South Africa | |||
| Egypt | ||||
| Nigeria | ||||
| Rest of Africa | ||||
| Physical |
| Virtual |
| Hybrid |
| Solutions |
| Services |
| Cloud |
| On-premise |
| Large Enterprises |
| Small and Medium Enterprises |
| IT and Telecom |
| Banking and Financial Services |
| Manufacturing |
| Energy and Utilities |
| Education |
| Healthcare |
| Government and Defense |
| Other Industries |
| North America | United States | ||
| Canada | |||
| Mexico | |||
| South America | Brazil | ||
| Argentina | |||
| Rest of South America | |||
| Europe | Germany | ||
| United Kingdom | |||
| France | |||
| Italy | |||
| Spain | |||
| Rest of Europe | |||
| Asia-Pacific | China | ||
| India | |||
| Japan | |||
| South Korea | |||
| Australia | |||
| Rest of Asia-Pacific | |||
| Middle East and Africa | Middle East | Saudi Arabia | |
| United Arab Emirates | |||
| Turkey | |||
| Rest of Middle East | |||
| Africa | South Africa | ||
| Egypt | |||
| Nigeria | |||
| Rest of Africa | |||
Key Questions Answered in the Report
What is the current size of the network automation market?
The network automation market stands at USD 31.02 billion in 2025 and is forecast to hit USD 84.69 billion by 2030.
Which segment is growing fastest within the network automation market?
Cloud deployment leads growth, expanding at a 24.1% CAGR thanks to scalable SaaS controllers and zero-touch edge security.
Why are hybrid infrastructures dominant?
Hybrid setups let enterprises preserve legacy switching while layering virtual fabrics, giving 47.6% 2024 market share and mitigating rip-and-replace costs.
How do skills shortages impact adoption?
A global lack of automation-savvy engineers trims the CAGR by an estimated 2.8% in the near term, pushing vendors to deliver low-code and AI-assisted tooling.

