Market Overview
| Study Period | 2021 - 2031 |
|---|---|
| Forecast Data Period | 2026 - 2031 |
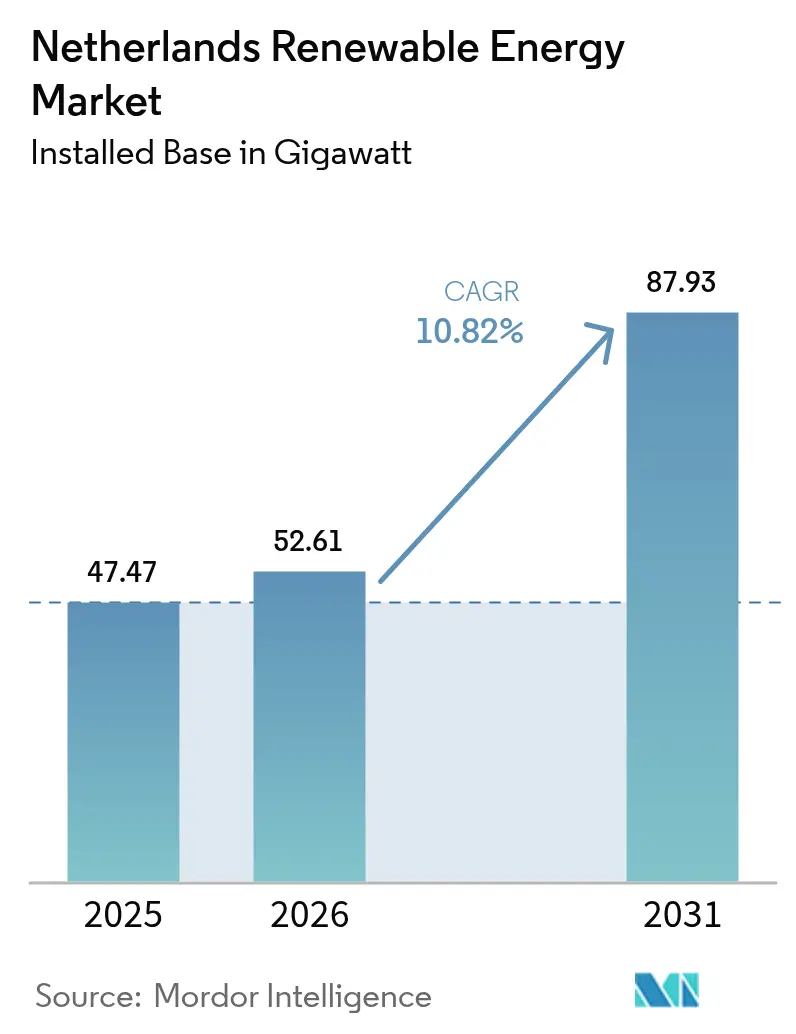
| Base Year Market Size (2025) | 47.47 gigawatt |
| Market Volume (2026) | 52.61 gigawatt |
| Market Volume (2031) | 87.93 gigawatt |
| Growth Rate (2026 - 2031) | 10.82% CAGR |
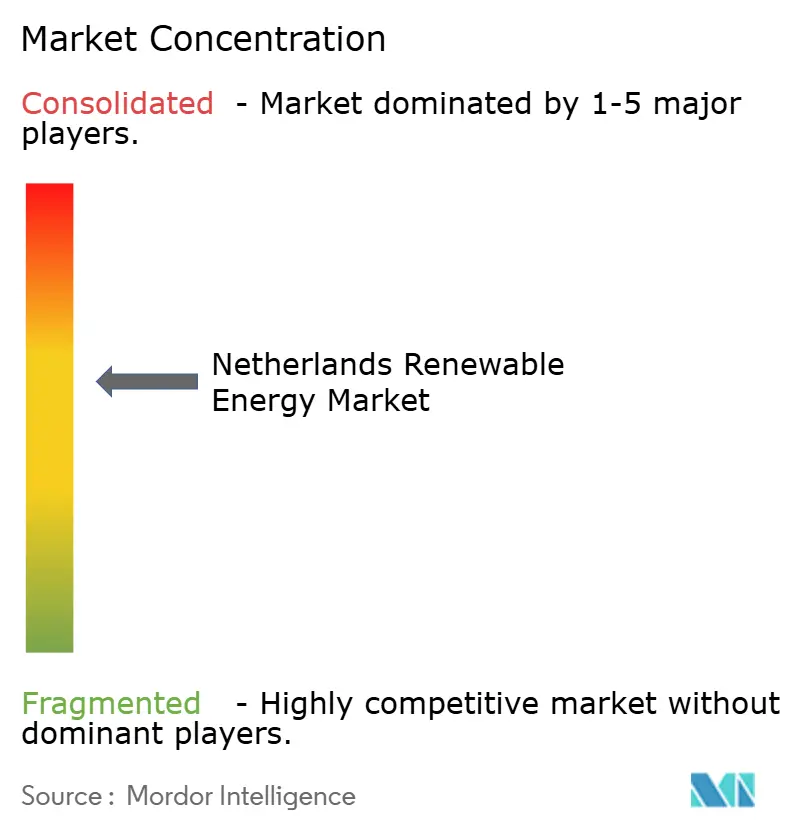
| Market Concentration | Medium |
Major Players *Disclaimer: Major Players sorted in no particular order Image © Mordor Intelligence. Reuse requires attribution under CC BY 4.0. | |
Netherlands Renewable Energy Market Analysis by Mordor Intelligence
The Netherlands Renewable Energy Market size is expected to grow from 47.47 gigawatt in 2025 to 52.61 gigawatt in 2026 and is forecast to reach 87.93 gigawatt by 2031 at 10.82% CAGR over 2026-2031.
A rapid pivot from incremental rooftop solar to industrial-scale offshore wind is reshaping the capacity mix, and policy mandates to phase out coal by 2030 align with the national 2050 climate-neutral target. Rooftop solar demand is accelerating ahead of the 2027 net-metering sunset, while offshore wind developers race to lock in scarce turbine and cabling slots, driving cost inflation in the supply chain. Corporate power-purchase agreements (PPAs) signed by data-center operators stabilize developer cash flows yet compress utility margins. Grid congestion in inland provinces has already curtailed 2.3 TWh of output, prompting a 3.5 GW battery storage tender and hydrogen-ready grid upgrades that will underpin future variable renewable-energy (VRE) penetration.
Key Report Takeaways
- By technology, solar energy commanded 68.74% of the Netherlands' Renewable Energy market share in 2025, while ocean energy is projected to register a 36.90% CAGR through 2031.
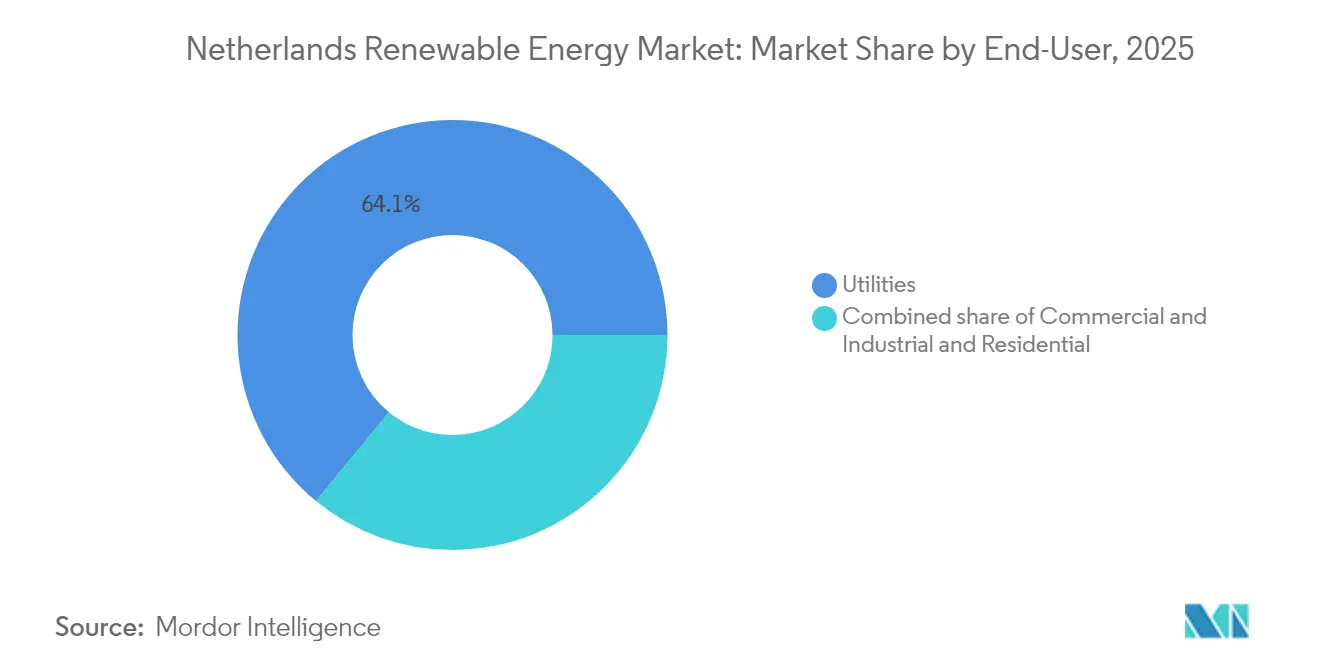
- By end-user, utilities held 64.05% of the Netherlands Renewable Energy market size in 2025, whereas commercial and industrial buyers are forecast to expand at a 13-15% CAGR through 2031.
Note: Market size and forecast figures in this report are generated using Mordor Intelligence’s proprietary estimation framework, updated with the latest available data and insights as of 2026.
Netherlands Renewable Energy Market Trends and Insights
Drivers Impact Analysis*
| Driver | (~) % Impact on CAGR Forecast | Geographic Relevance | Impact Timeline |
|---|---|---|---|
| Accelerated offshore-wind build-out commitments to 2030 | +4.20% | National, North Sea zones (IJmuiden Ver, Hollandse Kust) | Medium term (2-4 years) |
| Corporate-PPA boom led by Amsterdam data-center cluster | +2.10% | National, concentrated in Noord-Holland & Zuid-Holland | Short term (≤2 years) |
| Hydrogen-ready grid upgrades enabling higher VRE penetration | +1.80% | National, Rotterdam-Antwerp industrial corridor | Long term (≥4 years) |
| Energy-island concept pilot in Dutch section of North Sea | +1.50% | National, 60 km offshore | Long term (≥4 years) |
| Escalating EU carbon-price trajectory lifting renewable project economics | +1.20% | EU-wide, strongest effect on energy-intensive provinces | Medium term (2-4 years) |
| Large-scale battery-storage tenders easing inland grid congestion | +1.00% | Flevoland, Noord-Brabant, Gelderland | Short term (≤2 years) |
| Source: Mordor Intelligence | |||
Accelerated Offshore-Wind Build-Out Commitments to 2030
The Netherlands has committed to 21 GW of offshore wind capacity by 2030, with a long-term target of 70 GW by 2050, positioning the country as a North Sea renewable energy hub. This acceleration reflects the government's strategic pivot from natural gas extraction toward marine renewable resources, leveraging existing offshore infrastructure and port capabilities.(1)Netherlands Enterprise Agency, “Offshore Wind Roadmap 2030,” netherlandsenterpriseagency.com The IJmuiden Ver wind zones alone will contribute 4 GW through projects like IJmuiden Ver Beta, awarded to Vattenfall and Copenhagen Infrastructure Partners. TenneT's Target Grid initiative represents a EUR 200 billion investment program to create offshore transmission infrastructure capable of handling 72 GW by 2045, fundamentally restructuring the country's energy architecture. The offshore wind pipeline includes innovative energy island concepts in the Dutch North Sea section, designed to aggregate multiple wind farms and enable power-to-hydrogen conversion at sea. This build-out timeline creates predictable capacity additions that underpin the market's growth trajectory while establishing the Netherlands as a renewable energy exporter to neighboring countries.
Corporate-PPA Boom Led by Amsterdam Data-Center Cluster
Amsterdam's emergence as a major European data center hub has catalyzed corporate renewable energy procurement, with hyperscale operators driving long-term power purchase agreements that provide revenue certainty for new renewable projects. The concentration of energy-intensive digital infrastructure in the Randstad region creates demand for approximately 2.5 GW of renewable capacity, equivalent to 3.6% of the country's 2030 target. Corporate buyers increasingly prefer bundled renewable energy solutions that combine solar, wind, and storage to ensure 24/7 clean power delivery, driving innovation in hybrid project development. Google's 250 MW wind deal with Copenhagen Infrastructure Partners exemplifies this trend, where tech companies secure dedicated renewable capacity through direct agreements rather than traditional utility contracts.(2)Eneco, “Google Signs Long-Term PPA,” eneco.com The data center sector's growth trajectory, supported by Amsterdam's strategic location and fiber connectivity, ensures sustained demand for renewable energy beyond 2030. This corporate procurement model reduces project financing risks and accelerates deployment timelines, creating a virtuous cycle that supports the market's expansion.
Hydrogen-Ready Grid Upgrades Enabling Higher VRE Penetration
The Netherlands is constructing a national hydrogen network spanning 1,200 kilometers by 2030, with EUR 2.8 billion in subsidies allocated for hydrogen production and a 4% mandate for industrial hydrogen use. This infrastructure development enables higher renewable energy penetration by providing long-term storage solutions for excess wind and solar generation during peak production periods. Projects like Shell's Holland Hydrogen I (200 MW) and Equinor's H2M Eemshaven facility demonstrate the integration of renewable electricity with hydrogen production, creating new revenue streams for renewable generators. The hydrogen network's design prioritizes industrial clusters in Rotterdam, Amsterdam, and Groningen, where existing chemical and refining facilities can utilize green hydrogen as feedstock. Grid operators are installing hydrogen-ready electrolysis facilities at strategic locations, enabling the real-time conversion of surplus renewable electricity into storable hydrogen. This flexibility mechanism reduces curtailment risks and improves the economic viability of variable renewable energy projects, particularly during periods of high wind and solar output.
Large-scale battery-storage tenders easing inland grid congestion
The Netherlands has launched multiple large-scale battery energy storage tenders to address grid congestion, with projects like Giga Storage's 1.2 GWh facility and Lion Storage's 1.4 GWh installation providing grid balancing services. These battery systems enable higher integration of renewable energy by storing excess generation during low-demand periods and releasing power during peak consumption, thereby reducing the need for fossil fuel backup generation. Eneco's deployment of the country's largest battery energy storage system in 2025 demonstrates the commercial viability of grid-scale storage solutions. The battery tender process prioritizes projects that provide multiple grid services, including frequency regulation, voltage support, and congestion management, creating stacked revenue opportunities for storage operators. Alfen's 100 MW/200 MWh Project Antares represents the growing sophistication of Dutch battery projects, incorporating advanced grid integration technologies and predictive control systems. These storage deployments reduce renewable energy curtailment and improve grid stability, enabling higher renewable penetration rates without compromising system reliability.
Restraints Impact Analysis*
| Restraint | (~) % Impact on CAGR Forecast | Geographic Relevance | Impact Timeline | |
|---|---|---|---|---|
| Offshore cabling bottlenecks and port-capacity limits | -1.90% | IJmuiden, Eemshaven, Rotterdam ports | Short term (≤2 years) | |
| Rising curtailment risk in congested inland provinces | -1.30% | Noord-Brabant, Gelderland, Flevoland | Medium term (2-4 years) | |
| Net-metering phase-out dampening residential solar additions after 2027 | -1.10% | National, strongest in urban residential areas | Medium term (2-4 years) | |
| Supply-chain inflation for turbines, cables, and vessels | -1.00% | National, linked to global OEM hubs | Short term (≤2 years) | |
| Source: Mordor Intelligence | ||||
Offshore Cabling Bottlenecks and Port-Capacity Limits
The 21 GW offshore wind roadmap requires approximately 2,100 km of high-voltage submarine cabling by 2030; however, Europe's aggregate annual production capacity is capped at 1,500 km for all markets, leaving a sizable shortfall. Dutch staging ports, such as IJmuiden and Eemshaven, are already near saturation, with limited berth availability for specialized cable-laying vessels. Scheduling conflicts across contiguous North Sea projects compress viable weather windows, potentially delaying commissioning by up to 18 months for farms entering construction after 2027.(3)Ørsted, “Borssele III/IV Project Update,” orsted.com TenneT's Target Grid concept seeks to standardise 2 GW platform modules and shared export cables, but supply-chain execution remains vulnerable to steel and XLPE insulation lead times. Protracted delays would defer the Netherlands' anticipated additions to its renewable energy market size, which were expected in the late-decade surge.
Rising Curtailment Risk in Congested Provinces
Provinces with high variable-renewable penetration, notably North Holland, South Holland, and Groningen, experienced curtailment episodes where individual onshore wind plants lost 15-20% of their potential output during the 2024 peaks. Transmission bottlenecks between northern generation nodes and Randstad demand centres compel system operators to issue redispatch orders to maintain grid stability. Although regional DSOs increased reinforcement spending by 35% in 2024, transformer and cable upgrades typically require a three-year lead time, thereby prolonging the mismatch. Solar arrays in agricultural zones face even steeper export constraints because local power grids were not designed for bidirectional power flows. Persistent curtailment erodes project IRRs and could deter investment, especially for subsidy-free merchant plants reliant on full-capture revenue.
*Our forecasts treat driver/restraint impacts as directional, not additive. The impact forecasts reflect baseline growth, mix effects, and variable interactions.
Segment Analysis
By Technology: Offshore Wind Industrialization Reshapes Capacity Mix
Offshore wind additions will increase total wind capacity from 3.55 GW in 2025 to 13.1 GW by 2031, representing the largest absolute increase in the Netherlands' Renewable Energy market. Solar energy held 68.74% of the installed capacity in 2025; however, its growth moderates once net-metering subsidies phase out in 2027. Ocean energy, although currently under 10 MW, is forecast to grow at a 36.90% CAGR, driven by EU Innovation Fund grants, making it the fastest-growing segment. Bioenergy declines as pellet co-firing subsidies come to an end, and geothermal energy gains moderate traction in greenhouse clusters. Hydropower remains negligible due to flat topography.
Utility-scale repowering of onshore turbines, the deployment of 15-20 MW offshore machines, and the uptake of tidal arrays jointly diversify the Netherlands' Renewable Energy market, protecting overall growth even as rooftop solar incentives taper. The Netherlands' Renewable Energy market share of offshore wind is expected to climb from 19.05% in 2025 to 33.10% by 2031, confirming the structural ascendancy of offshore wind.


By End-User: Corporate Buyers Erode Utility Dominance
Utilities commanded 64.05% of the 2025 capacity, yet the segment grew at only an 10.15% CAGR, trailing the Netherlands Renewable Energy market rate. Commercial and industrial (C&I) buyers signed 1.2 GW of PPAs in 2024, a triple of the 2023 volume, and are on track for the fastest expansion as EU reporting rules tighten. The Netherlands' Renewable Energy market size for commercial and industrial (C&I) offtake is projected to rise from 5.75 GW in 2025 to 14.05 GW by 2031. Data-center clusters, chemical plants, and logistics hubs anchor demand in Noord-Holland, Zuid-Holland, and Noord-Brabant, where grid capacity can absorb large PPAs without curtailment. Residential demand plateaus once net metering is phased out, pushing suppliers toward consolidation, as exemplified by Vattenfall's acquisition of Pure Energie.
Geography Analysis
North Sea coastal provinces anchor the offshore wind build-out, with North Holland and South Holland leveraging ports at IJmuiden and Rotterdam for turbine staging, operation, and maintenance. Combined, these provinces are forecast to host more than 10.7 GW of offshore capacity by 2031, underpinning nearly 39.84% of the Netherlands' renewable energy market. The Randstad conurbation drives consumption growth, led by hyperscale data centres and electrified transport corridors that raise baseload demand. Groningen's transition away from natural gas is accompanied by sizeable onshore wind and solar permits, repositioning the province as a renewable exporter into national grids.
Northern provinces, such as Friesland and Drenthe, provide favourable sites for onshore wind energy due to their superior wind speeds and lower population density. Here, agrivoltaics trials combine dairy operations with elevated panels, creating new revenue streams for farmers. In contrast, the southern provinces of North Brabant and Limburg focus on large rooftop solar installations across industrial estates, taking advantage of their vast warehouse footprints. Grid operators Alliander and Stedin increased capital expenditure by 35% in 2024 to accommodate distributed resources, particularly network-connected batteries that mitigate feeder congestion. Floating-solar concentrations in water-rich South Holland illustrate adaptive land-use, where solar coverage on reservoirs, such as Havikerwaard, reaches 24 MW.
Geographic dispersion creates north-to-TenneT 'smission imbalances, propelling TenneT's EUR 10 billion annual investment programme to reinforce 380 kV lines linking generation nodes to Randstad demand clusters. The phased Target Emphasizes 2 GW DC links that provide controllable flows and ancillary service capabilities. Regional DSOs concurrently fortify medium-voltage circuits to manage rooftop PV backfeed and accommodate EV charging load growth, aligning distributed energy evolution with overarching system adequacy objectives.
Regulatory Landscape
The Netherlands updated its primary energy-market framework with the Energiewet (Energy Act) entering into force on January 1, 2026, replacing the Electricity Act 1998 and the Gas Act. It also creates a clearer legal basis for storage and local flexibility. Implementing rules were further detailed through the Energiebesluit (Energy Decree), established on November 3, 2025, including provisions around grid-operator investment planning and operational exemptions for system maintenance.
On market design and network regulation, the Autoriteit Consument en Markt (ACM) set out a 2026 agenda focused on combating grid congestion and enabling infrastructure investment. This includes updated methods for setting system-operator tariff revenues and 2026 tariff proposals covering DSOs and TenneT. In parallel, the Ministry of Climate and Green Growth advanced a two-way contract (CfD-style) approach for large-scale sustainable generation, with parliamentary communications in March 2026 and a legislative proposal submitted in June 2026. The proposal positions revenue-stabilization tools alongside the existing support landscape, including SDE++ rounds, for wind and solar deployment.
Competitive Landscape
The top five players, Vattenfall, Eneco, Ørsted, Shell, and RWE, control approximately 60% of the installed capacity, resulting in a moderate concentration profile for the Netherlands' Renewable Energy market. Integrated utilities are moving downstream into battery storage and operations and maintenance (O&M) to defend their margins, while pure-play developers recycle capital by selling projects at the notice-to-proceed stage. Vattenfall's 2024 purchase of Pure Energie removed a price-aggressive competitor and granted access to 250,000 households, lowering acquisition costs by 30%. Eneco's joint venture with Mitsubishi secures Japanese equipment finance for 1.5 GW of offshore assets.
Disruptors such as Tesla Energy undercut storage tenders by 18% through upstream battery cell integration, while Siemens Gamesa's 15 MW turbine raises annual energy output by 20% compared to legacy models, justifying price premiums of 10-12%.(4) Regulatory power rests with the Netherlands Enterprise Agency, which allocates seabed leases, and TenneT, which dictates grid connection timing and curtailment payments. White-space remains in agrivoltaics, where dual-use greenhouse projects total under 200 MW despite 12-15% crop-yield gains in Zeeland pilots.(5)Wageningen University & Research, “Agrivoltaic Pilots in Zeeland,” wur.nl
Netherlands Renewable Energy Industry Leaders
Vattenfall AB
Orsted A/S
Eneco Groep NV
Shell Renewables & Energy Solutions
TenneT Holding BV*
- *Disclaimer: Major Players sorted in no particular order

Market Opportunities and Future Outlook
Offshore wind remains the clearest system-scale buildout lever. In 2026, the government moved from zero-subsidy tenders to a temporary subsidy-backed tender model to keep projects bankable under tighter supply-chain and financing conditions. The 2026 tender design also creates a near-term activity window for developers and OEMs around IJmuiden Ver Gamma-A and Gamma-B (2 GW total). The raised subsidy ceilings, EUR 117/MWh for Gamma-A and EUR 116/MWh for Gamma-B, point to where pricing and risk allocation are being reset for North Sea buildouts.
Grid congestion and curtailment have opened near-term whitespace for flexibility, congestion-aware connections, and co-located solutions. The June 2026 financial close for Novar and Westermeerweg Zon Holding's 148 MWp Westermeerdijk Solar Park, using a private grid connection (NNWZ) to bypass congestion, shows how project structuring and connection strategy are becoming differentiators for utility-scale PV. Separately, hydrogen infrastructure is taking clearer shape for industrial offtake and long-duration balancing, illustrated by Gasunie inaugurating a 32-km hydrogen transport pipeline in the Port of Rotterdam (Maasvlakte to Pernis) in June 2026. This supports the Rotterdam industrial cluster as a renewable-electricity-to-molecules demand center.
Recent Industry Developments
- July 2026: Ecowende (Shell, Chubu, and Eneco) delivered first power from the 760 MW Hollandse Kust West VI offshore wind farm and connected the project to TenneT’s offshore grid. The milestone advances the Netherlands offshore wind build-out with a high-visibility project, while reinforcing demand for offshore grid capacity, commissioning services, and downstream offtake structures for large volumes of variable generation.
- July 2026: Vopak took final investment decision on a 200 MW/800 MWh battery energy storage system (BESS) in Oosterhout, with operations scheduled for H1 2028. The project adds a large, stand-alone storage anchor to the Dutch pipeline and supports congestion management, while creating a bankable reference for merchant and contracted battery revenues alongside growing variable wind and solar output.
- October 2025: TenneT completed its 700 MW standard AC offshore grid connection programme, including the Hollandse Kust West Beta connection, and received a readiness certificate for the Dutch offshore grid. Standardization of offshore connection assets reduces execution risk across multiple wind zones and tightens the link between seabed-lease awards and achievable grid-connection timelines.


Research Methodology Framework and Report Scope
Market Definition and Coverage
For this study, the Netherlands renewable energy market is defined as installed renewable power capacity in the country, expressed in gigawatts, across major renewable technologies that contribute to grid and behind-the-meter generation over time.
Scope exclusions: This sizing excludes non-renewable generation capacity and does not count general electricity sales or retail tariffs unless they are directly tied to renewable capacity additions.
Segmentation Overview
- By Technology
- Solar Energy (PV and CSP)
- Wind Energy (Onshore and Offshore)
- Hydropower (Small, Large, PSH)
- Bioenergy
- Geothermal
- Ocean Energy (Tidal and Wave)
- By End-User
- Utilities
- Commercial and Industrial
- Residential
Data Sources, Market Sizing, and Validation
Desk Research
Desk research started with building a clean fact base for Netherlands energy supply, demand, and policy direction, since those inputs determine the speed of capacity build-out. We mainly relied on public datasets and filings that show installed capacity, generation, auctions, and grid constraints.
Typical sources included official statistics and energy balances, such as CBS and Eurostat, system operator publications, such as TenneT, and national policy and permitting information, such as RVO and relevant ministry releases. We also used cross-country renewable indicators, such as IEA and IRENA. Company annual reports and investor presentations helped anchor project timelines, and we used a paid subscription for financials, news tracking, and patent lookups where it supported technology shift checks. The specific sources above are illustrative only, and additional references were used for data collection, validation, and clarification.
Primary Interviews and Surveys
Primary inputs were collected through expert interviews and structured surveys with developers, utilities, EPC and O&M participants, equipment ecosystem contacts, grid and permitting specialists, and large power buyers in the Netherlands. These conversations helped confirm the realistic commissioning pipeline, typical utilization assumptions by technology, and how policy timelines translate into actual capacity additions.
Distribution of primary research fieldwork respondents
| Company type | Respondent position | Region |
|---|---|---|
| Top tier: 28% | CXOs: 12% | |
| Mid tier: 55% | Functional/Unit leaders: 33% | |
| Smaller Players: 17% | Managers: 55% |
Market-Sizing & Forecasting
Sizing was built using a top-down capacity reconstruction for the Netherlands, where policy targets, auction and tender volumes, grid connection readiness, and project permitting status are translated into annual commissioned capacity. After setting that pathway, we corroborated the totals with selective bottom-up approximations, such as sampling project pipelines by technology, checking typical MW build rates, and validating implied additions against publicly visible commissioning announcements.
Key inputs that moved the model included annual installed capacity additions (GW), offshore and onshore wind build schedules, solar PV deployment pace, bioenergy and geothermal project lead times, and grid congestion and connection queue signals. To keep forecasting practical, we ran scenario analysis around a central case, using expert feedback on variables such as permitting duration, curtailment risk, and expected project delays. Where bottom-up visibility was weaker for smaller projects, we used adoption-rate assumptions anchored to historic build patterns, then cross-checked implied additions against the top-down totals.
Data Validation & Update Cycle
Outputs were checked against independent signals, including official capacity statistics, grid operator outlooks, and policy and auction calendars, and then variances were reviewed before sign-off. When a technology total moved too far from expected build constraints, for example grid connection limits, assumptions were revisited and relevant experts were re-contacted.
The report is refreshed annually, and interim updates are added when material events occur, such as major tender outcomes, policy rule changes, or large project delays. Before delivery, we run a final review pass to ensure the latest public releases and field inputs are reflected consistently across the model.
Mordor Intelligence's Netherlands Renewable Energy Market Estimate Compared With Other Published Estimates
Published market sizes for Netherlands renewable energy can look far apart because the underlying unit of measurement is not always the same, and because some sources mix capacity with revenue, generation, or only one technology. Timing also matters, since capacity additions can be lumpy when large offshore projects connect.
By tracking commissioning timelines, grid-connection readiness, and technology-level installed capacity in gigawatts, Mordor Intelligence keeps the estimate aligned to what is actually coming online in the Netherlands, instead of mixing in power price assumptions or a single sub-segment view.
Benchmark comparison
| Source | Market Size | Gaps in Research Methodology |
|---|---|---|
| Mordor Intelligence | USD 47.47 B (2025) | |
| Industry Report A | USD 18.50 B (2024) | This estimate is scoped to offshore wind only and is reported as a value number, which makes it structurally smaller than an all-renewables capacity-based total, and also sensitive to pricing and investment assumptions. |
| Trade Summary B | USD 62.10 B (2024) | This type of estimate commonly values renewable electricity output using wholesale prices, so the result can move with power prices and generation yield, even if installed capacity changes more steadily. |
The spread in the table is mainly explained by what is being counted, since one number isolates offshore wind and another relies on electricity value calculations, while the capacity-based approach stays tied to additions that can be checked year by year. With clear boundaries and repeatable checks, clients can reconcile differences quickly and use the model as a practical planning input.


Key Questions Answered in the Report
What capacity will Dutch offshore wind add by 2031?
Offshore wind is expected to reach 13.1 GW by 2031, up from 3.55 GW in 2025.
Why is curtailment rising in Noord-Brabant and Gelderland?
Local 150 kV grids hit thermal limits during solar-generation peaks, curtailing 2.3 TWh in 2024 and triggering storage tenders.
When does net-metering end for Dutch rooftop solar?
The incentive phases out in 2027, lengthening residential solar payback to 10-12 years without batteries.
How large is the planned North Sea energy island?
The pilot will aggregate 1 GW of offshore capacity and host 500 MW of electrolyzers, with first power targeted for 2029.
Which segment is growing fastest among end-users?
Commercial and industrial buyers are expanding at about 13-15% CAGR as corporate PPAs accelerate.
What is the outlook for ocean energy in the Netherlands?
Tidal and wave projects are poised for a 36.90% CAGR through 2031, supported by EU Innovation Fund grants.
Page last updated on:


