Market Overview
| Study Period | 2020 - 2031 |
|---|---|
| Forecast Data Period | 2026 - 2031 |
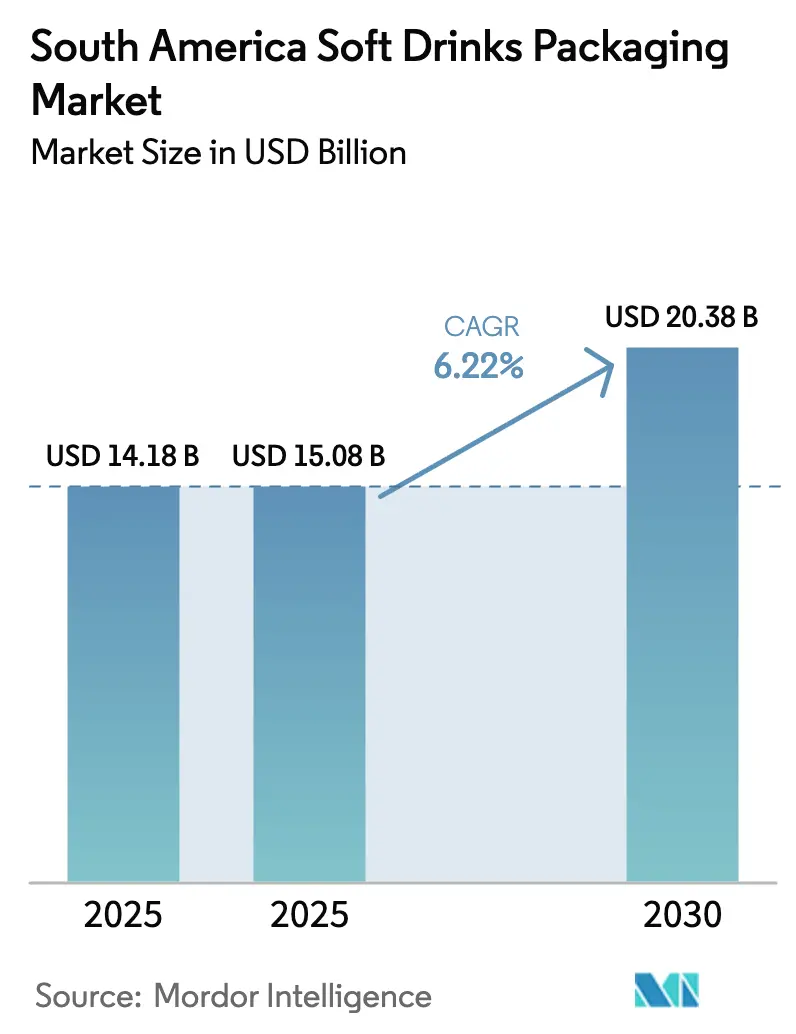
| Base Year Market Size (2025) | USD 14.18 Billion |
| Market Size (2025) | USD 15.08 Billion |
| Market Size (2030) | USD 20.38 Billion |
| Growth Rate (2026 - 2031) | 6.22% CAGR |
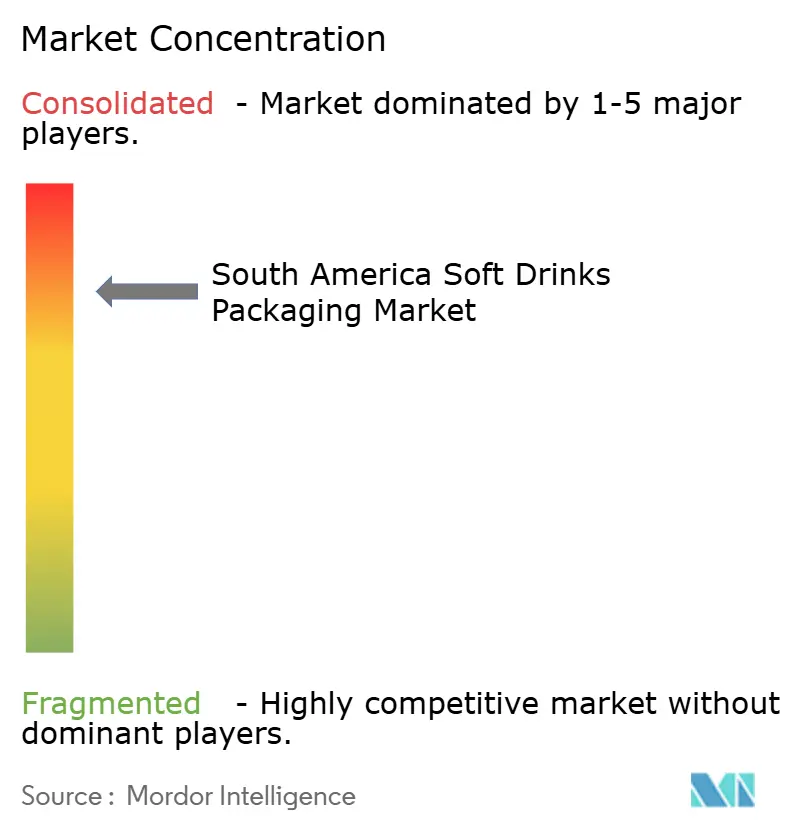
| Market Concentration | High |
Major Players *Disclaimer: Major Players sorted in no particular order Image © Mordor Intelligence. Reuse requires attribution under CC BY 4.0. | |
South America Soft Drinks Packaging Market Analysis by Mordor Intelligence
The South America soft drinks packaging market size was valued at USD 14.18 billion in 2025 and is estimated to grow from USD 15.08 billion in 2026 to USD 20.38 billion by 2031, at a CAGR of 6.22% over 2026-2031. Mandatory recycled-content laws in Brazil and harmonized food-contact rules in MERCOSUR are prompting early investments in rPET, lightweighting, and reverse-logistics networks, giving first movers cost advantages and stronger retail ties. Rapid income growth in Peru and Colombia, expanding e-commerce grocery penetration in Brazil and Argentina, and persistent demand for hygienic single-serve packs continue to lift unit volumes even as consumers trade down to value beverages. At the same time, volatile resin and aluminum prices, fragmented deposit-return roll-outs, and bans on multi-material laminates are squeezing converter margins and accelerating consolidation. Competitive intensity remains moderate because the top five converters control only about 45% of regional revenue, leaving space for mid-tier specialists in pouches, aseptic cartons, and glass.
Key Report Takeaways
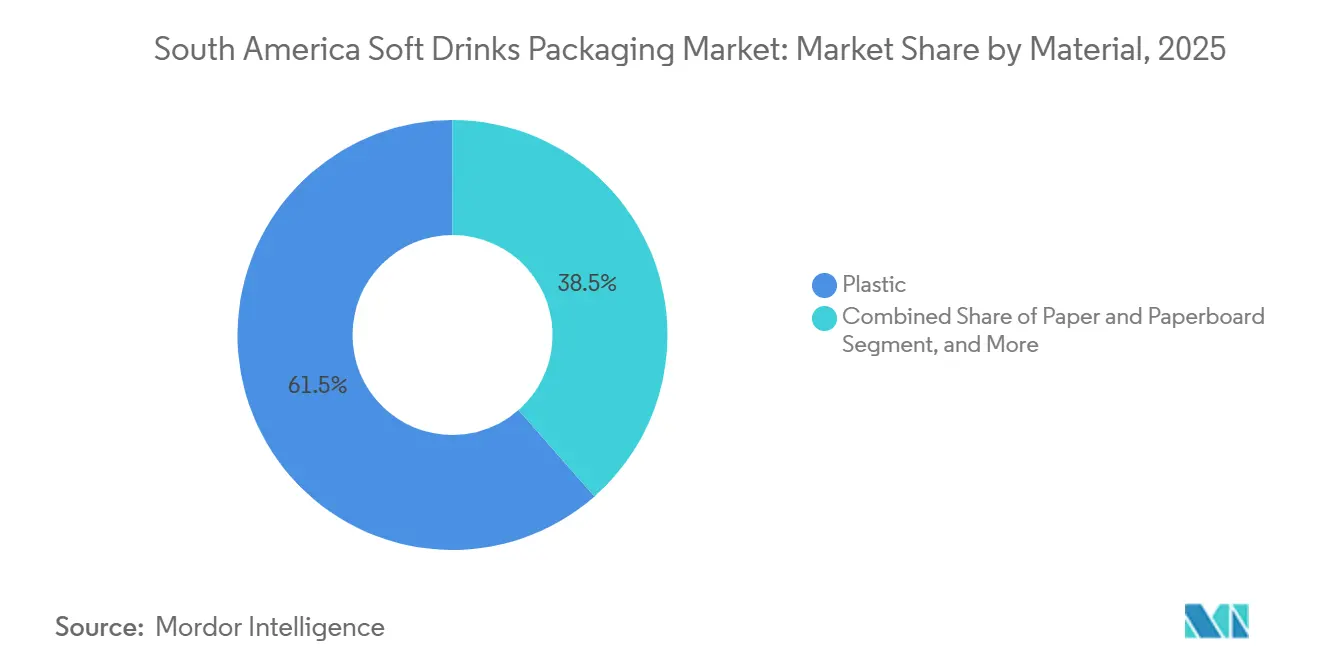
- By material, plastic captured 61.48% share of the South America soft drinks packaging market in 2025, and recycled PET plastic is forecast to advance at a 6.98% CAGR through 2031.
- By packaging format, bottles led with 44.98% revenue share in 2025, while pouches and sachets are projected to expand at a 6.95% CAGR to 2031.
- By beverage type, carbonated soft drinks accounted for 41.32% of demand in 2025, whereas sports and isotonic drinks are positioned to grow at a 7.19% CAGR to 2031.
- By pack size, the 251-500 ml segment accounted for 44.78% of the South America soft drinks packaging market in 2025, yet packs below 250 ml are set to grow at a 6.93% CAGR between 2026-2031.
- By country, Brazil held 57.87% of the South America soft drinks packaging market share in 2025, and Peru is expected to post the fastest 7.39% CAGR through 2031.
Note: Market size and forecast figures in this report are generated using Mordor Intelligence’s proprietary estimation framework, updated with the latest available data and insights as of January 2026.
South America Soft Drinks Packaging Market Trends and Insights
Drivers Impact Analysis*
| Driver | (~) % Impact on CAGR Forecast | Geographic Relevance | Impact Timeline |
|---|---|---|---|
| Rising Disposable Income and Middle-Class Expansion | +1.2% | Brazil, Peru, Colombia, Paraguay | Medium term (2–4 years) |
| Surge in PET Bottled-Water Consumption | +1.4% | Brazil, Argentina, Chile, Peru | Short term (≤ 2 years) |
| Post-COVID Demand for Hygienic Single-Serve Packs | +0.9% | Urban South America | Short term (≤ 2 years) |
| Sustainability Push, rPET and Lightweighting Mandates | +1.6% | Brazil, Chile, Peru | Long term (≥ 4 years) |
| E-commerce Grocery Growth Spurring Shelf-Ready Formats | +0.7% | Brazil, Argentina | Medium term (2–4 years) |
| Standardized Refillable Bottle Programs | +0.5% | Chile, Colombia | Long term (≥ 4 years) |
| Source: Mordor Intelligence | |||
Rising Disposable Income And Middle-Class Expansion
Real wage gains of 4.2% in 2025 lifted household purchasing power in Peru and Colombia, creating a two-tier demand pattern that splits premium functional drinks in large cities from value carbonated offerings in secondary towns.[1]International Labour Organization, “Labour Market Statistics for South America 2025,” ilo.org Brazil added 3.1 million middle-class families, yet higher food and transport inflation nudged shoppers toward larger multi-serve bottles, which lower per-liter costs. The pack-size dichotomy helps explain why 251-500 ml formats still dominate while smaller single-serve packs post faster growth. In Peru’s mining hubs, such as Arequipa, 500 ml isotonic bottles gained share among shift workers seeking on-the-go hydration solutions. Colombia’s new labor rules, formalizing gig-economy jobs, expanded tax-based income, boosting demand for cans and pouches popular with delivery riders.
Surge In PET Bottled-Water Consumption
Persistent gaps in municipal water supply leave 22% of Argentine and 31% of Peruvian urban households without reliable tap water, driving daily bottled-water use and consistent 500 ml single-serve purchases.[2]Pan American Health Organization, “Water and Sanitation Infrastructure Survey 2024-2025,” paho.org Coca-Cola reported a 7% volume jump in its regional water portfolio during 2025 and invested USD 85 million in PET preform capacity at Jundiaí, Brazil, to meet demand. Lightweighting cut the 500 ml bottle weight to 24 grams, saving 14% in resin but requiring stricter quality checks. Chile tightened microbiological rules, raising compliance costs for small brands yet accelerating consolidation. Out-of-home consumption in Brazil’s Northeast, where temperatures exceed 30 °C year-round, underpins sustained growth in single-serve water formats.
Post-COVID Demand For Hygienic Single-Serve Packs
A 2025 Euromonitor survey found 68% of South American consumers prefer sealed single-serve beverages over fountain options, a preference that remains even as infection rates subside. Brazil’s quick-service restaurants adopted 250 ml aluminum cans that eliminate dishwashing and lower breakage losses. Argentina’s updated health guidelines recommend disposable packs in hospitals, boosting aseptic carton and pouch sales. Peru’s street-vendor ecosystem, representing 38% of Lima beverage sales, pivoted to 300 ml PET bottles and sachets, cutting theft but worsening collection challenges. Across metropolitan areas, impulse-buy channels reward converters that can supply tamper-evident closures and smaller pack sizes aligned with hygiene concerns.
Sustainability Push, rPET And Lightweighting Mandates
Brazil’s Decree 12,688 sets a 22% recycled-content floor for PET bottles starting January 2026, a target that climbs to 32% by 2028. With domestic rPET capacity at just 180,000 t against 310,000 t demand, spot prices in São Paulo rose 34% over virgin PET, prompting multi-year supply contracts and chemical-recycling pilots. Chile’s extended producer responsibility law obliges a 55% PET collection rate by 2027, pushing Coca-Cola and Ambev to co-fund deposit kiosks in Santiago and other cities. Peru’s draft plastics regulation proposes banning PET bottles under 500 ml in protected parks by 2028, meeting resistance from tourism bottlers. Concurrent lightweighting rules in Argentina cut 500 ml bottle weight caps to 22 g, pressuring converters to upgrade stretch-blow lines and adopt barrier coatings.
Restraints Impact Analysis*
| Restraint | (~) % Impact on CAGR Forecast | Geographic Relevance | Impact Timeline |
|---|---|---|---|
| Stringent Bans on Non-Recyclable Plastics | -0.8% | Chile, Peru, Brazil | Medium term (2–4 years) |
| Volatile Resin and Aluminum Prices | -1.1% | Region-wide | Short term (≤ 2 years) |
| Slow Deposit-Return Roll-Out Outside Brazil | -0.6% | Argentina, Colombia, Peru, Chile | Long term (≥ 4 years) |
| Limited Recycling Infrastructure in Andean Nations | -0.7% | Peru, Colombia, Bolivia, Ecuador | Long term (≥ 4 years) |
| Source: Mordor Intelligence | |||
Volatile Resin And Aluminum Prices
PET prices fluctuated between USD 1,050-1,380 per t in 2025 due to crude swings and plant outages, squeezing converter margins as beverage brands resisted mid-season price hikes. Aluminum averaged USD 2,420 per t on the LME, with South American can makers paying freight premiums of USD 180 per t and facing local currency volatility.[3]London Metal Exchange, “Aluminum Price Data 2025,” lme.com Brazil’s Novelis and Argentina’s Aluar ran near full capacity, so Colombian coil importers paid a 22% cost penalty that slowed can adoption. Spot volatility forces converters to hedge or accept thinner margins, reinforcing the appeal of rPET, whose pricing increasingly decouples from virgin resin.
Stringent Bans On Non-Recyclable Plastics
Chile’s 2024 law bans multi-material laminates for beverage packs from 2027, compelling juice brands to shift to mono-PE films that shorten shelf life from 12 to 8 months.[4]Ministerio del Medio Ambiente de Chile, “Marco de Responsabilidad Extendida del Productor,” mma.gob.cl Peru’s draft rules would outlaw PVC shrink labels by 2028 to improve PET recycling purity, adding USD 0.02-0.04 per unit for alternative decorations. Brazil’s São Paulo ban on expanded polystyrene cups took effect in 2025 but suffers lax enforcement, creating uneven compliance costs. Fragmented local bans in Argentina create complexity for multi-regional distributors and deter investment in flexible-film upgrades.
*Our forecasts treat driver/restraint impacts as directional, not additive. The impact forecasts reflect baseline growth, mix effects, and variable interactions.
Segment Analysis
By Material: Plastic Retains Leadership While rPET Gains Share
Plastic held 61.48% of 2025 revenue, anchored by PET bottles that combine clarity, cost, and distribution efficiency. Within plastics, the rPET subsegment is set to expand at a 6.98% CAGR through 2031 as mandates raise demand for recycled content, supporting integrated supply contracts and chemical-recycling pilots. Metal formats, chiefly aluminum cans, captured 23% despite price volatility because of their infinite recyclability, which resonates with urban millennial shoppers. Glass maintained a 9% niche in premium juice and craft soda, reinforced by Verallia’s new oxy-combustion furnace that runs on 55% cullet feed and lowers carbon intensity by 18% versus legacy melts. Paperboard-based aseptic cartons rounded out 6.7%, benefiting from ambient logistics and shelf-ready e-commerce designs promoted by Tetra Pak. Lightweighting trimmed 500 ml PET bottles from 26 g in 2023 to 23 g in 2025, and Amcor’s oxygen-scavenger patents aim to drop them another 12% without compromising shelf life.
Cost pressure and sustainability branding continue to tilt converter capex toward rPET, barrier coatings, and hybrid paper-plastic structures that broaden end-of-life options. MERCOSUR’s unified PET standard adds compliance hurdles for small plants lacking ISO 22000 labs but enhances cross-border trade for multinationals. As a result, the South America soft drinks packaging market size tied to plastic is forecast to widen even while metal and carton formats defend their own growth lanes through technical upgrades and marketing that highlights recyclability.


By Packaging Format: Bottles Dominate As Pouches Accelerate
Bottles commanded 44.98% in 2025, with PET accounting for nearly three-quarters of volume owing to familiarity and high filling speeds. Yet pouches and sachets are on track for a 6.95% CAGR, propelled by online grocery fulfillment that values cube efficiency and lighter last-mile payloads. Aluminum cans held 28% and gained share in quick-service restaurants where single-serve hygiene and no-rinse benefits outweigh metal premiums. Cartons and aseptic boxes, at 18%, leverage ambient stability to compete in juice and plant-based drinks but face perception hurdles in Argentina, where consumers regard paperboard as lower tier.
Pouches excel in informal retail, especially in Peru, where 300 ml flexible packs undercut PET by 35% per serving. Brazil’s restaurant chains standardized 250 ml cans to cut breakage, boosting can volume 9% despite metal costs. Meanwhile, pilot refillable-glass programs in Santiago achieved only 41% return rates, underscoring the challenge of changing consumer habits without a robust deposit infrastructure. As converters push robotic case-packers and easy-open tear notches, pouches look poised to erode share from bottles in impulse and e-commerce channels, reinforcing the South America soft drinks packaging market’s shift toward lightweight flexible formats.
By Beverage Type: Sports Drinks Expand Faster Than CSDs
Carbonated soft drinks still made up 41.32% of volume in 2025, but their growth slowed to 2.1% as sugar-reduction policies steered consumers toward zero-calorie lines and smaller cans. Sports and isotonic beverages are projected to grow at a 7.19% CAGR through 2031, buoyed by an expanding gym culture in Lima, Bogotá, and Santiago, and institutional demand from Peru’s high-altitude mining sector. Juices and nectars, concentrated in aseptic cartons and PET bottles, hold 24% and ride premium cold-pressed trends in Brazil’s top metros. Ready-to-drink coffee, tea, and energy drinks accounted for 19%, lifted by convenience-store footprints and digital can printing that enables limited-edition craft labels.
PepsiCo’s Gatorade and Coca-Cola’s Powerade dominate isotonic shelf space, yet regional challengers priced 15% lower are stealing share via grassroots soccer sponsorships. Warning labels in Chile cut carbonated soft drink consumption by 3.2% in 2025, but sparkling water and flavored seltzers partially backfill volume. The South America soft drinks packaging industry benefits as converters pivot line flexibility to handle both carbonated and still functional drinks in diversified formats.

By Pack Size: Impulse-Friendly Small Formats Gather Pace
The 251-500 ml band accounted for 44.78% of 2025 revenue because it balances affordability and portability, especially in convenience and gas-station channels. Packs below 250 ml will rise at a 6.93% CAGR through 2031 as hygiene concerns sustain demand for sealed single-serve units and portion control appeals to calorie-aware shoppers. Mid-size 501-1000 ml bottles make up 28% for at-home consumption but face substitution from multi-packs of smaller cans shipped via e-grocers. Large 1.5-2.5 l PET formats retain a 19% stronghold in Brazil’s Northeast and Argentina’s interior, where household sizes are larger, and refrigeration space is available.
Returnable 200 ml glass bottles in Brazil achieved 92% take-back rates, yet brand owners hesitate to expand this to PET due to contamination risk. Peru’s street-vendor pivot to disposable 300 ml PET bottles reveals the tension between hygiene and rising waste volumes. Aluminum can shortages during peak Argentine summers forced restaurant chains to revert to 500 ml PET, underscoring supply-chain fragility. Collectively, format and size choices mirror shifting lifestyles, income segmentation, and regulatory nudges across the South America soft drinks packaging market.
Geography Analysis
Brazil produced 57.87% of regional value in 2025, underpinned by the nationwide bottling lattices of Ambev and Coca-Cola FEMSA and by ample in-country converting capacity. The impending 22% rPET mandate has already inflated São Paulo spot prices 34% above virgin PET, pushing brand owners into long-term offtakes and chemical-recycling pilots that could temper cost escalation once scale is reached. Crown Holdings plans additional can lines in 2026 to chase energy-drink growth even though beer downtrading has softened premium can demand. Verallia’s new cullet-rich furnace should appeal to beverage marketers under pressure to reduce scope 3 emissions.
Peru, forecast to expand at 7.39% CAGR to 2031, benefits from mining-sector wage hikes that elevate beverage spend in Arequipa and Moquegua. Informal vendors in Lima are switching to 300 ml PET single-serves, boosting converter volumes but exacerbating litter in districts lacking organized collection. The pending plastics draft law that targets bottles under 500 ml could dampen small-pack momentum in protected regions if enacted.
Colombia’s market growth is hampered by deposit-return delays and imported aluminum premiums that leave can formats 22% costlier than in Brazil. CAN-PACK’s 2027 Bogotá plant aims to localize supply, but power-purchase contracts remain a swing factor. Argentina’s peso volatility led converters to dollarize resin contracts, preserving margins yet limiting agility to chase spot price dips. Chile’s EPR framework compels beverage firms to hit 55% PET collection by 2027, catalyzing joint investments in reverse-vending infrastructure across Santiago, Valparaíso, and Concepción.
The rest of South America, Paraguay, Uruguay, Bolivia, Ecuador, and the Guianas, accounts for 8% of demand and grows at roughly 5.9% CAGR, restrained by smaller populations and thin converting bases. PepsiCo’s USD 100 million Montevideo distribution hub underscores expectations for smoother MERCOSUR flows, while dollarized Ecuador offers currency stability offset by higher labor costs. Bolivia’s informal beverage economy, 42% of volume by some estimates, leans on refillable glass and bulk PET, limiting upside for formal converters.
Competitive Landscape
The South America soft drinks packaging market remains moderately consolidated because the five largest converters, namely Amcor, Ball Corporation, Crown Holdings, Tetra Pak and Verallia, together account for roughly 45% of regional revenue. A sizable long-tail of mid-tier specialists continues to compete in niches such as mono-material pouches, aseptic cartons for premium juice and aluminum aerosol cans for energy shots, which prevents the leaders from exerting outsized pricing power. This structure leaves brand owners with multiple sourcing options while allowing innovators to differentiate through speed to market, short print runs and flexible contract-packing services.
Strategic investment is clustering around vertical integration and sustainability. Coca-Cola and Ambev are adding captive PET preform lines to lock in recycled-content supply ahead of Brazil’s 2026 mandate, while Crown and Ball are expanding digital printing and lightweight can bodies to meet promotional demands without increasing metal use. Verallia commissioned an oxy-combustion glass furnace that uses 55% cullet, reducing energy consumption and positioning the company as a preferred partner for premium juice fillers seeking lower-carbon packaging. Flexible-film converters are installing solvent-free lamination assets to deliver mono-PE pouches that comply with Chile’s 2027 recyclability rules and undercut legacy multilayer films on both cost and regulation.
Regulation is now a key battleground because ISO 22000 food-safety certification and Brazil’s ANVISA rules limit tender eligibility for smaller plants that lack in-house testing labs. Deposit-return schemes in Chile and pilot projects in Colombia are shifting post-consumer collection costs from municipalities to producers, a trend that favors vertically integrated bottlers with dense distribution routes and data analytics to manage reverse logistics. Start-ups offering deposit-tracking software, smart bins and rPET offtake aggregation are attracting converter partnerships, while chemical recyclers are courting beverage brands that need food-grade feedstock but prefer an asset-light route. Collectively, these regulatory and technology shifts are accelerating consolidation and sharpening the competitive differentiation between scale leaders and agile specialists.
South America Soft Drinks Packaging Industry Leaders
Ball Corporation
Amcor plc
Graham Packaging Company L.P.
Crown Holdings, Inc.
Tetra Pak International S.A.
- *Disclaimer: Major Players sorted in no particular order

Recent Industry Developments
- January 2026: Brazil’s Ministry of Environment released final guidelines for Decree 12,688, confirming the 22% rPET mandate for all PET beverage bottles and outlining penalties beginning Q2 2026.
- November 2025: Verallia completed a EUR 111 million (USD 111 million) oxy-combustion furnace in Campo Bom, Brazil, reaching 820 t-per-day capacity with 55% cullet input.
- September 2025: PepsiCo committed USD 100 million to a 120,000 m² automated distribution center in Montevideo, Uruguay, to consolidate MERCOSUR warehousing.
- August 2025: CAN-PACK announced a USD 180 million aluminum can plant in Bogotá, Colombia, targeting a 2027 start-up with 1 billion-can annual capacity.


South America Soft Drinks Packaging Market Report Scope
The South America Soft Drinks Packaging Market Report is Segmented by Material (Plastic, Metal, Glass, Paper and Paperboard), Packaging Format (Bottles, Cans, Cartons and Aseptic Boxes, Pouches and Sachets), Beverage Type (Carbonated Soft Drinks, Juices and Nectars, Ready-to-Drink Beverages, Sports and Isotonic Drinks, Other Beverage Types), Pack Size (Less Than Equal To 250 ml, 251-500 ml, 501-1000 ml, More Than 1 L), and Geography (Brazil, Argentina, Chile, Colombia, Peru, Rest of South America). The Market Forecasts are Provided in Terms of Value (USD).
By Material
| Plastic |
| Metal |
| Glass |
| Paper and Paperboard |
By Packaging Format
| Bottles |
| Cans |
| Cartons and Aseptic Boxes |
| Pouches and Sachets |
By Beverage Type
| Carbonated Soft Drinks (CSDs) |
| Juices and Nectars |
| Ready-to-Drink (RTD) Beverages |
| Sports and Isotonic Drinks |
| Other Beverage Types |
By Pack Size
| Less Than Equal To 250 ml |
| 251 – 500 ml |
| 501 – 1000 ml |
| More Than 1 L |
By Country
| Brazil |
| Argentina |
| Chile |
| Colombia |
| Peru |
| Rest of South America |
| By Material | Plastic |
| Metal | |
| Glass | |
| Paper and Paperboard | |
| By Packaging Format | Bottles |
| Cans | |
| Cartons and Aseptic Boxes | |
| Pouches and Sachets | |
| By Beverage Type | Carbonated Soft Drinks (CSDs) |
| Juices and Nectars | |
| Ready-to-Drink (RTD) Beverages | |
| Sports and Isotonic Drinks | |
| Other Beverage Types | |
| By Pack Size | Less Than Equal To 250 ml |
| 251 – 500 ml | |
| 501 – 1000 ml | |
| More Than 1 L | |
| By Country | Brazil |
| Argentina | |
| Chile | |
| Colombia | |
| Peru | |
| Rest of South America |


Key Questions Answered in the Report
What is the current value of the South America soft drinks packaging market?
It was valued at USD 14.18 billion in 2025 and is projected to reach USD 20.38 billion by 2031.
Which country contributes most to regional packaging demand?
Brazil accounted for 57.87% of revenue in 2025 thanks to nationwide bottling networks and extensive converter capacity.
Which packaging material is growing the fastest?
Recycled PET is forecast to rise at a 6.98% CAGR through 2031, outpacing virgin PET and metal formats.
How will new Brazilian regulations affect PET bottles?
Decree 12,688 mandates 22% recycled content from January 2026, forcing brand owners to secure long-term rPET supply and invest in recycling technology.
Which beverage type offers the highest growth opportunity?
Sports and isotonic drinks is expected to expand at a 7.19% CAGR to 2031 on the back of fitness and wellness trends.
What is the key restraint facing converters today?
Volatile prices for PET resin and imported aluminum compress margins and create pricing friction with beverage brand owners.
Page last updated on:


