Netherlands Pet Food Market Size and Share
Market Overview
| Study Period | 2018 - 2031 |
|---|---|
| Forecast Data Period | 2026 - 2031 |
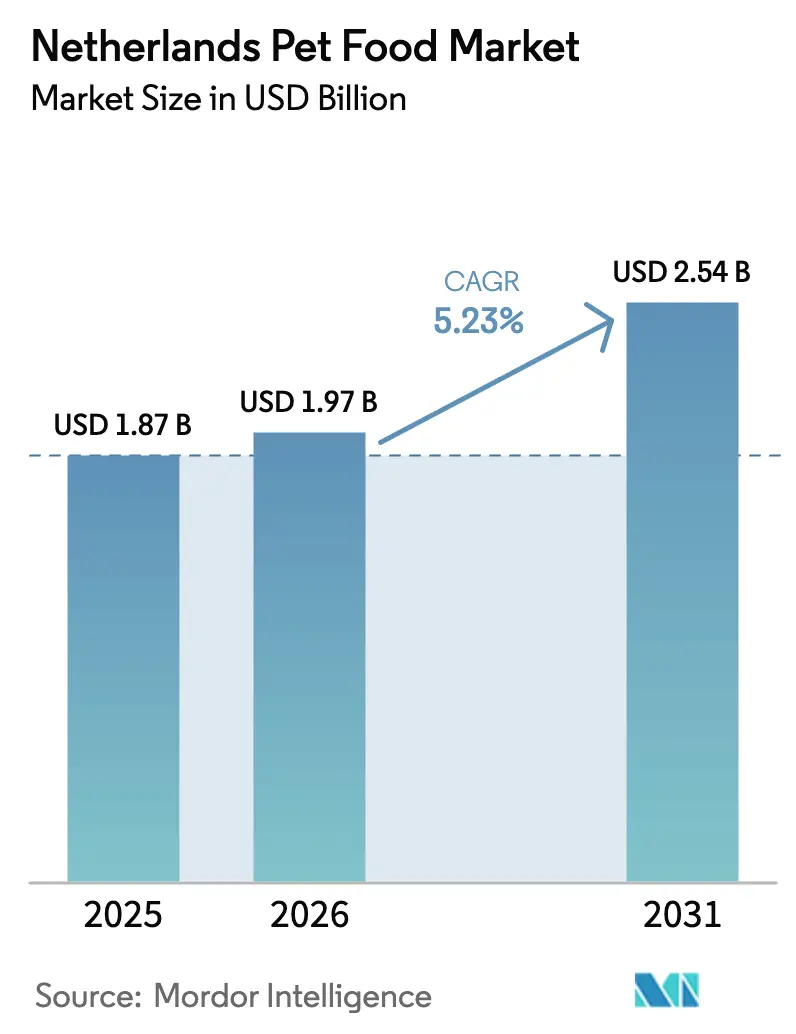
| Base Year Market Size (2025) | USD 1.87 Billion |
| Market Size (2026) | USD 1.97 Billion |
| Market Size (2031) | USD 2.54 Billion |
| Growth Rate (2026 - 2031) | 5.23% CAGR |
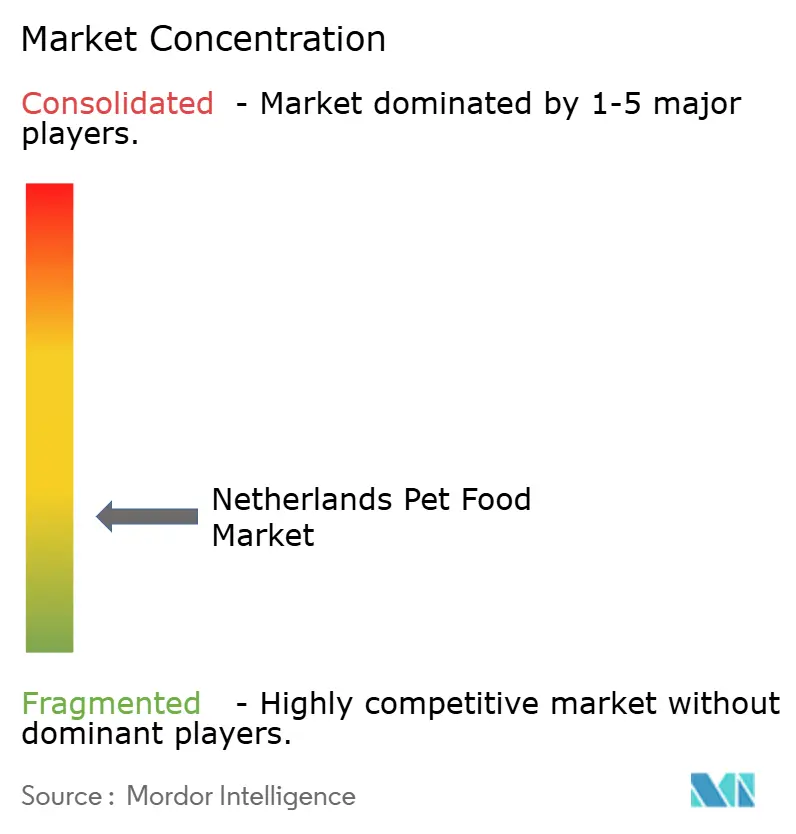
| Market Concentration | Low |
Major Players *Disclaimer: Major Players sorted in no particular order Image © Mordor Intelligence. Reuse requires attribution under CC BY 4.0. | |
Netherlands Pet Food Market Analysis by Mordor Intelligence
The Netherlands' pet food market size was valued at USD 1.87 billion in 2025 and estimated to grow from USD 1.97 billion in 2026 to reach USD 2.54 billion by 2031, at a CAGR of 5.23% during the forecast period (2026-2031). Solid household penetration, premium nutrition trends, and resilient discretionary spending underpin growth even as consumers scrutinize value. Ingredient transparency, functional health claims, and circular‐economy sourcing now guide product development, widening the competitive gap between innovators and price followers. Online subscription services are reshaping purchasing behavior by combining convenience with veterinary guidance, while stringent sustainability rules are pushing manufacturers toward recyclable packaging and verified low-carbon ingredients. Private label gains ground when inflation bites, yet super-premium wet and treat lines retain momentum to single-household owners who treat pets as family.
Key Report Takeaways
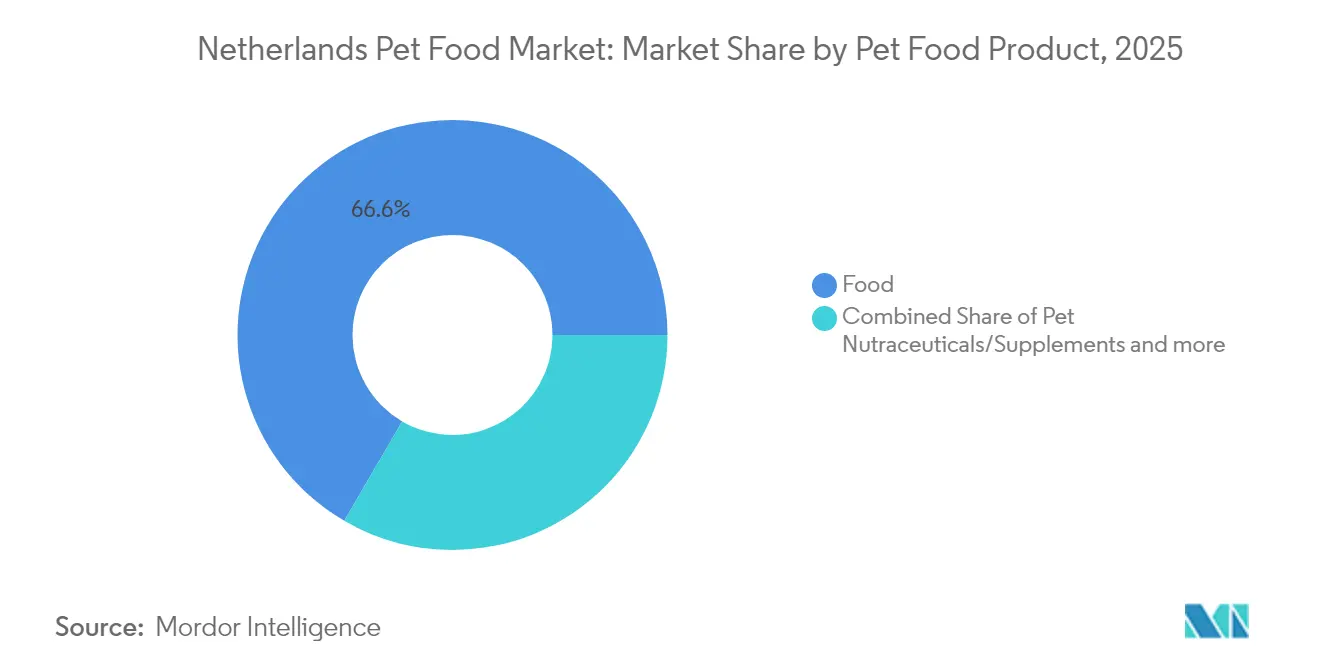
- By pet food product type, the Food segment commanded 66.60% revenue share in 2025, while Pet Nutraceuticals and Supplements are projected to expand at an 10.8% CAGR through 2031.
- By pet type, the Cats segment led with a 42.40% share of the Netherlands' pet food market in 2025, while the dogs segment is set to grow at a 6.55% CAGR through 2031.
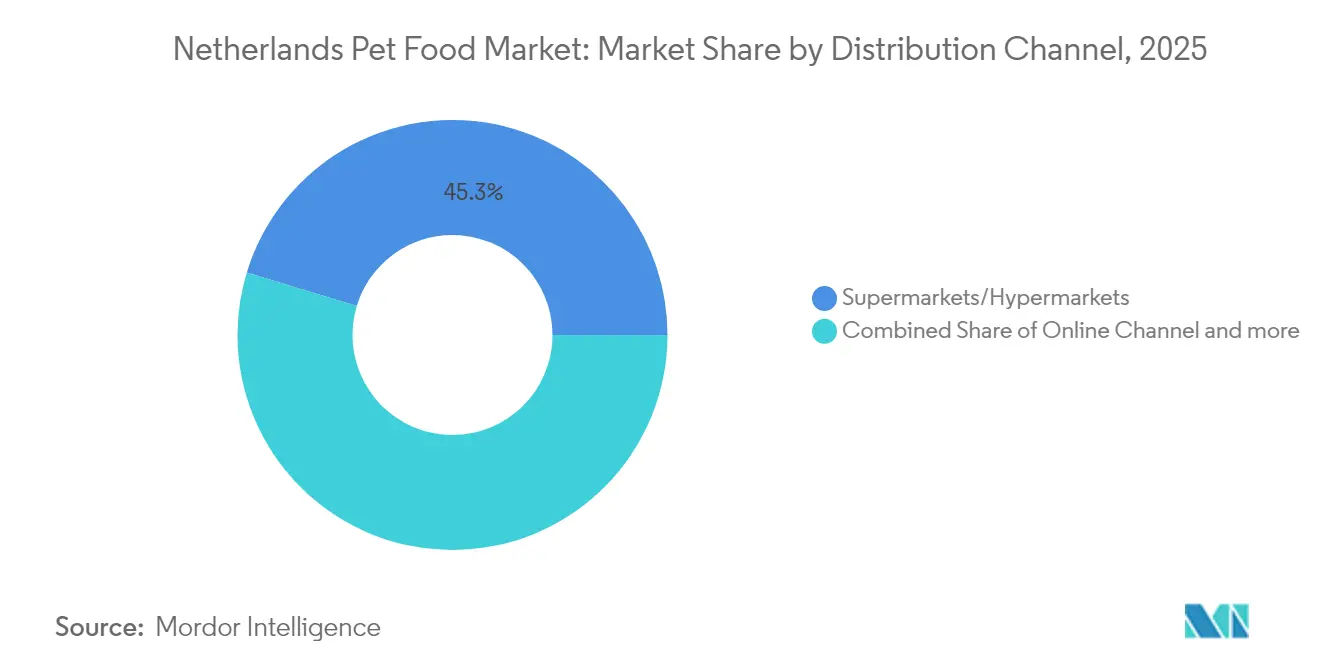
- By distribution channel, the Supermarkets and Hypermarkets segment held 45.30% share of the Netherlands pet food market size in 2025, whereas the Online Channel segment is forecasted to progress at a 6.95% CAGR through 2031.
- The top five players, including Mars, Incorporated, Colgate-Palmolive Company (Hill's Pet Nutrition, Inc.), Farmina Pet Foods, VAFO Group a.s., and Schell & Kampeter, Inc. (Diamond Pet Foods), accounted for a 33.05% share in 2025.
Note: Market size and forecast figures in this report are generated using Mordor Intelligence’s proprietary estimation framework, updated with the latest available data and insights as of 2026.
Netherlands Pet Food Market Trends and Insights
Drivers Impact Analysis*
| Driver | (~) % Impact on CAGR Forecast | Geographic Relevance | Impact Timeline |
|---|---|---|---|
| Human-grade ingredient adoption | + 1.8% | Netherlands, with spillover to the Benelux region | Medium term (2-4 years) |
| Premiumization and functional nutrition | +1.5% | National, concentrated in urban areas | Long term (≥ 4 years) |
| Rise in single-household pet ownership | + 0.9% | Netherlands, particularly Amsterdam, Rotterdam, and Utrecht | Short term (≤ 2 years) |
| Circular-economy protein sourcing | + 0.7% | Netherlands and Northern Europe | Long term (≥ 4 years) |
| Veterinarian subscription e-commerce bundles | + 0.6% | National, early adoption in major cities | Medium term (2-4 years) |
| Smart-packaging enabling personalized dosing | +0.4% | The Netherlands, with Europe's expansion potential | Long term (≥ 4 years) |
| Source: Mordor Intelligence | |||


Human-Grade Ingredient Adoption
The shift toward human-grade formulations represents a fundamental transformation in Dutch pet food manufacturing, with ingredient transparency becoming a primary driver of purchase rather than a secondary consideration. This trend extends beyond marketing claims to actual production processes, as manufacturers invest in human-food-grade facilities and supply chain certifications to meet consumer demands for ingredient traceability. Nutreco's Circular Feed initiative demonstrates how established players are repositioning their ingredient sourcing strategies to capture premium pricing opportunities. The regulatory framework supports this evolution, with the Netherlands Food and Consumer Product Safety Authority (NVWA) implementing comprehensive feed establishment registration systems that ensure ingredient quality standards align with human food safety protocols.
Premiumization and Functional Nutrition
Functional nutrition has evolved from niche supplements to mainstream product integration, with joint-care, digestive health, and age-specific formulations becoming standard offerings rather than specialized products. This transformation reflects a deeper understanding among consumers of preventive pet healthcare, driven by veterinary education and increased spending patterns on pet healthcare. The market has witnessed sophisticated product launches, such as Champion Petfoods' new Benelux strategy, introduced in June 2024, which aims for premium positioning through direct market entry and specialized wholesale partnerships[1]Source: Champion Petfoods, “Benelux Market Entry Strategy 2024,” championpetfoods.com. Regulatory influence from Europe feed additive regulations ensures that functional claims are substantiated by scientific evidence, creating barriers to entry for smaller players while validating the category's legitimacy.
Rise in Single-Household Pet Ownership
The demographic shift toward single-person households has fundamentally altered the economics of pet ownership, with solo pet parents exhibiting higher per-pet spending patterns and a stronger emotional attachment to premium products. This trend is particularly pronounced in Dutch urban areas, where housing constraints favor single-pet ownership but with elevated care standards and discretionary spending capacity. Just Russel's expansion into the Netherlands market, serving approximately 10,000 pets monthly with personalized subscription food, highlights how companies are capitalizing on this demographic shift through direct-to-consumer models.
Circular-Economy Protein Sourcing
Alternative protein development has transitioned from experimental concepts to commercial viability, with insect meal and algae-based proteins gaining regulatory approval and consumer acceptance in the Dutch market. Looop company's provision of organic circular ingredients from potato processing waste demonstrates how food industry byproducts are being transformed into premium pet food components. MicroHarvest's partnership with Vegdog for microbial protein dog treats illustrates how biotechnology companies are scaling production to meet growing demand. Regulatory frameworks under the European Novel Food Regulations provide clear pathways for the approval of alternative proteins, while consumer education campaigns are successfully addressing initial resistance to insect-based ingredients.
Restraints Impact Analysis*
| Restraint | (~) % Impact on CAGR Forecast | Geographic Relevance | Impact Timeline |
|---|---|---|---|
| Inflation-driven trade-down to private label | -1.2% | Netherlands, with a broader European context | Short term (≤ 2 years) |
| Strict Dutch sustainability labeling rules | -0.8% | Netherlands, with European regulatory spillover | Medium term (2-4 years) |
| Veterinary skepticism toward nutraceutical claims | -0.5% | National, concentrated in traditional practices | Medium term (2-4 years) |
| Protein-source volatility from insect farming scale-ups | -0.3% | Netherlands and Northern Europe | Long term (≥ 4 years) |
| Source: Mordor Intelligence | |||
Inflation-Driven Trade-Down to Private Label
Consumer price sensitivity has intensified significantly, with private label pet food gaining EUR 3.6 billion (USD 3.9 billion) across six major European markets, including the Netherlands, representing 18% growth that outpaces branded alternatives. This trade-down behavior reflects broader economic pressures, as the Netherlands' real wages remained below 2019 levels through the end of 2023, constraining discretionary spending on premium pet products [2]Source: Statistics Netherlands, “Dutch Wage and Price Trends 2024,” cbs.nl. The impact extends beyond simple price competition to fundamental changes in purchase behavior, with consumers increasingly comparing price-per-serving metrics rather than focusing on premium ingredient claims. Retailers are responding by expanding private label offerings and promotional activities, creating margin pressure throughout the value chain.
Strict Dutch Sustainability Labeling Rules
The Europe Packaging and Packaging Waste Regulation (PPWR), which enters into force in February 2025 with obligations starting in August 2026, represents a fundamental shift in packaging requirements that will significantly impact cost structures across the pet food industry. The Dutch implementation of these regulations is expected to be among the most stringent in Europe, with additional national requirements for carbon footprint disclosure and the use of circular materials. The regulatory framework creates competitive advantages for larger players, who can absorb compliance costs, while potentially disadvantaging innovative, smaller brands that drive category growth. Food Waste Free United's advocacy for separating pet food standards from human food standards highlights industry concerns about regulatory burden limiting raw material flexibility
*Our forecasts treat driver/restraint impacts as directional, not additive. The impact forecasts reflect baseline growth, mix effects, and variable interactions.
Segment Analysis
By Product Type: Nutraceuticals Drive Innovation Beyond Core Food
Food maintains a dominant market share of 66.60% in 2025. This growth differential reflects a sophisticated understanding of preventive pet healthcare among consumers and their willingness to invest in functional nutrition solutions beyond basic sustenance. Wet Pet Food within the broader Food category benefits from premiumization trends and the adoption of human-grade ingredients, while Dry pet food faces margin pressure from private label competition and commodity ingredient cost inflation.
Pet Nutraceuticals and Supplements are projected to command the fastest growth trajectory at an 10.8% CAGR through 2031. This remarkable growth is primarily attributed to increasing awareness among pet owners about the importance of preventive healthcare and nutrition for their pets. The segment is experiencing strong demand for products containing vitamins, minerals, probiotics, and omega-3 fatty acids, as pet owners become increasingly aware of their pets' overall health and wellness. The growth is further supported by the rising availability of specialized supplements targeting specific health conditions and age-related issues in pets.


By Pet Type: Dogs Accelerate Premium Adoption
Cats maintained a larger market share at 42.40% in 2025. Cat nutrition faces unique challenges related to the requirements of obligate carnivores and consumer price sensitivity in the traditional dry food category. The premiumization of wet food and functional treats targeting hairball control and urinary health continues to maintain growth momentum. Cat owners in the Netherlands are increasingly focusing on providing high-quality commercial pet food products, including both wet and dry food options, to ensure optimal nutrition for their pets. The segment's strong performance is also supported by the wide availability of cat-specific products through various distribution channels, including supermarkets, specialty stores, and online platforms, making it convenient for cat owners to access a diverse range of food products tailored to their pets' needs.
Dogs represent the fastest-growing pet segment, with a 6.55% CAGR through 2031. This growth differential stems from dog owners' higher engagement with premium nutrition trends and their greater willingness to invest in functional health solutions. The demographic shift toward single-household pet ownership particularly benefits dog-focused products, as solo pet parents demonstrate elevated spending patterns and stronger emotional attachment to premium offerings. The expanding range of dog food products, including specialized veterinary diets and natural ingredient-based options, is contributing to the segment's rapid growth trajectory in the Dutch market.
By Distribution Channel: Online Disrupts Traditional Retail
Supermarkets and Hypermarkets maintain a 45.30% market share in 2025, owing to their convenience and impulse purchase advantages. The digital transformation accelerated by subscription models and direct-to-consumer brands creates new competitive dynamics that bypass traditional retail markup structures. Major retail chains, such as Albert Heijn, Jumbo, Lidl, and PLUS, have established themselves as primary destinations for pet food purchases, with dedicated pet sections offering extensive product ranges for dogs, cats, and other pets. These channels have gained significant traction among consumers due to their convenience in allowing pet owners to combine grocery shopping with pet food purchases.
Online Channel growth at a 6.95% CAGR through 2031, E-commerce platforms are revolutionizing pet food distribution by offering an extensive selection of products, with most platforms featuring over 5,000 different pet food items, including specialized diets, organic options, and premium brands. The segment's growth is further supported by competitive pricing, doorstep delivery services, and the ease of comparing products and prices. Online retailers are also enhancing their service offerings with features such as subscription-based models, personalized recommendations, and detailed product information, making it increasingly attractive for pet owners to purchase their pet food requirements through digital channels.
Geography Analysis
The Netherlands represents a mature pet food market characterized by high pet ownership penetration, sophisticated consumer preferences, and stringent regulatory standards that influence product development and market entry strategies. In 2024, according to Dibevo industry surveys, 45% of households own pets, demonstrating stable demand fundamentals supported by a strong emotional attachment to companion animals and discretionary spending capacity.
Dutch regulatory leadership in sustainability requirements presents both challenges and opportunities for market participants, as the Netherlands often implements European directives ahead of mandatory timelines and adds national requirements that exceed minimum standards. The NVWA's (Netherlands Food and Consumer Product Safety Authority) comprehensive feed establishment registration system and active supervision of raw pet food safety demonstrate regulatory sophistication that ensures product quality while creating compliance barriers for international entrants . This regulatory environment favors established players with compliance infrastructure while creating opportunities for specialized companies that can navigate complex requirements to access premium market segments.
The Netherlands' role as a European logistics hub influences competitive dynamics through import/export flows and manufacturing location decisions, with companies like United Petfood leveraging Dutch operations to serve broader European markets. The December 2023 acquisition of De Haan Petfood by United Petfood illustrates how consolidation is reshaping the competitive landscape while maintaining local production capabilities.
Competitive Landscape
Market Structure Shows Mixed Competition Dynamics
The Netherlands pet food market exhibits moderate fragmentation; the top five players, including Mars, Incorporated, Colgate-Palmolive Company (Hill's Pet Nutrition, Inc.), Farmina Pet Food, VAFO Group a.s., and Schell & Kampeter, Inc. (Diamond Pet Foods), accounted for a 33.4% share in 2024. Global companies leverage their extensive research capabilities, established brand portfolios, and economies of scale to maintain market leadership, while local specialists capitalize on their understanding of regional preferences and ability to offer customized solutions. The market demonstrates moderate consolidation, with major players controlling significant market share while leaving room for numerous smaller competitors in specialized niches. The presence of both premium and mass-market brands creates multiple competitive tiers, enabling companies to effectively target different consumer segments.
Market dynamics are shaped by the increasing focus on premium and specialized product segments, driving companies to invest in research and development capabilities. The competitive landscape is evolving with the rise of direct-to-consumer channels and specialized pet stores, challenging traditional distribution models. Companies are increasingly competing on factors beyond price, including product quality, ingredient sourcing, and nutritional expertise. The market exhibits limited merger and acquisition activity, with companies opting for organic growth through product innovation and market expansion. The growing importance of veterinary partnerships and scientific validation of product claims further influences the competitive environment.
Market contenders can gain ground by focusing on underserved niches and developing innovative products that address specific pet health concerns. Success factors include building a strong local brand identity, establishing direct relationships with pet owners through specialized retail channels, and leveraging digital platforms for customer engagement. Companies must navigate potential regulatory changes regarding ingredient sourcing and product claims while maintaining competitive pricing strategies.
Netherlands Pet Food Industry Leaders
Mars, Incorporated
Colgate-Palmolive Company (Hill's Pet Nutrition, Inc.)
FARMINA PET FOODS
VAFO Group a.s.
Schell & Kampeter, Inc. (Diamond Pet Foods)
- *Disclaimer: Major Players sorted in no particular order

Recent Industry Developments
- July 2023: Hill's Pet Nutrition introduced its new MSC (Marine Stewardship Council) certified pollock and insect protein products for pets with sensitive stomachs and skin lines. They contain vitamins, omega-3 fatty acids, and antioxidants.
- May 2023: Vafo Praha, s.r.o. launched its new range of Brit RAW Freeze-dried treats and toppers for dogs. These products are made up of high-quality proteins and minimally processed ingredients for potential health benefits.
- May 2023: Vafo Praha, s.r.o. launched its new line of functional snacks for dogs called Brit Dental Stick. The products are available in four different varieties, each with seven sticks per package.


Netherlands Pet Food Market Report Scope
Food, Pet Nutraceuticals/Supplements, Pet Treats, Pet Veterinary Diets are covered as segments by Pet Food Product. Cats, Dogs are covered as segments by Pets. Convenience Stores, Online Channel, Specialty Stores, Supermarkets/Hypermarkets are covered as segments by Distribution Channel.
| Food | By Sub Product | Dry Pet Food | By Sub Dry Pet Food | Kibbles |
| Other Dry Pet Food | ||||
| Wet Pet Food | ||||
| Pet Nutraceuticals/Supplements | By Sub Product | Milk Bioactives | ||
| Omega-3 Fatty Acids | ||||
| Probiotics | ||||
| Proteins and Peptides | ||||
| Vitamins and Minerals | ||||
| Other Nutraceuticals | ||||
| Pet Treats | By Sub Product | Crunchy Treats | ||
| Dental Treats | ||||
| Freeze-dried and Jerky Treats | ||||
| Soft & Chewy Treats | ||||
| Other Treats | ||||
| Pet Veterinary Diets | By Sub Product | Diabetes | ||
| Digestive Sensitivity | ||||
| Oral Care Diets | ||||
| Renal | ||||
| Urinary tract disease | ||||
| Obesity Diets | ||||
| Derma Diets | ||||
| Other Veterinary Diets |
| Cats |
| Dogs |
| Other Pets |
| Convenience Stores |
| Online Channel |
| Specialty Stores |
| Supermarkets/Hypermarkets |
| Other Channels |
| Pet Food Product | Food | By Sub Product | Dry Pet Food | By Sub Dry Pet Food | Kibbles |
| Other Dry Pet Food | |||||
| Wet Pet Food | |||||
| Pet Nutraceuticals/Supplements | By Sub Product | Milk Bioactives | |||
| Omega-3 Fatty Acids | |||||
| Probiotics | |||||
| Proteins and Peptides | |||||
| Vitamins and Minerals | |||||
| Other Nutraceuticals | |||||
| Pet Treats | By Sub Product | Crunchy Treats | |||
| Dental Treats | |||||
| Freeze-dried and Jerky Treats | |||||
| Soft & Chewy Treats | |||||
| Other Treats | |||||
| Pet Veterinary Diets | By Sub Product | Diabetes | |||
| Digestive Sensitivity | |||||
| Oral Care Diets | |||||
| Renal | |||||
| Urinary tract disease | |||||
| Obesity Diets | |||||
| Derma Diets | |||||
| Other Veterinary Diets | |||||
| Pets | Cats | ||||
| Dogs | |||||
| Other Pets | |||||
| Distribution Channel | Convenience Stores | ||||
| Online Channel | |||||
| Specialty Stores | |||||
| Supermarkets/Hypermarkets | |||||
| Other Channels | |||||


Market Definition
- FUNCTIONS - Pet foods are usually intended to provide complete and balanced nutrition to the pet but are primarily used as functional products. The scope includes the food and supplements consumed by pets including veterinary diets. Supplements/nutraceuticals that are directly supplied to pets are considered within the scope.
- RESELLERS - Companies engaged in reselling of pet food without value addition have been excluded from the market scope, in order to avoid double counting.
- END CONSUMERS - Pet owners are considered to be the end-consumers in the market studied.
- DISTRIBUTION CHANNELS - Supermarkets/hypermarkets, specialty stores, convenience stores, online channels and other channels are considered within the scope. The stores which are exclusively providing pet related basic and custom products are considered within the scope of specialty stores.
| Keyword | Definition |
|---|---|
| Pet Food | The scope of pet food includes the food that is eatable by pets including food, treats, veterinary diets, and nutraceuticals/supplements. |
| Food | Food is animal feed intended for consumption by pets. It is formulated to provide essential nutrients and meet the dietary needs of various types of pets, including dogs, cats, and other animals. These are generally segmented into dry and wet pet foods. |
| Dry Pet Food | Dry pet foods may be extruded/baked (kibbles) or flaked. They have a lower moisture content, typically around 12-20%. |
| Wet Pet Food | Wet pet food, also known as canned pet food or moist pet food, generally has a higher moisture content compared to dry pet food, often ranging from 70-80%. |
| Kibbles | Kibbles are dry, processed pet food in small, bite-sized pieces or pellets. They are specifically formulated to provide balanced nutrition for various domestic animals, such as dogs, cats, and other animals. |
| Treats | Pet Treats are special food items or rewards given to pets, to show affection, and encourage good behavior. They are especially used during training. Pet treats are made from various combinations of meat or meat-derived materials with other ingredients. |
| Dental Treats | Pet dental treats are specialized treats that are formulated to promote good oral hygiene in pets. |
| Crunchy Treats | It is a type of pet treat that has a firm and crispy texture which can be a good source of nutrition for pets. |
| Soft and chewy treats | Soft and Chewy pet treats are a type of pet food product that is formulated to be easy to chewy and digest. They are usually made from soft and pliable ingredients, such as meat, poultry, or vegetables, that have been blended and formed into bite-sized pieces or strips. |
| Freeze-dried & Jerky Treats | Freeze-dried and jerky treats are snacks given to pets, that are prepared through a special preservation process, without damaging the nutritional content, resulting in long-lasting, nutrient-rich treats. |
| Urinary Tract Disease Diets | These are commercial diets that are specifically formulated to promote urinary health and reduce the risk of urinary tract infections and other urinary problems. |
| Renal Diets | These are specialized pet foods formulated to support the health of pets with kidney disease or renal insufficiency. |
| Digestive Sensitivity Diets | Digestive-sensitive diets are specially formulated to meet the nutritional needs of pets with digestive issues such as food intolerances, allergies, and sensitivities. These diets are designed to be easily digestible and to reduce the symptoms of digestive problems in pets. |
| Oral Care Diets | Oral care diets for pets are specially formulated diets produced to promote oral health and hygiene in pets. |
| Grain-Free Pet Food | Pet food that does not contain common grains like wheat, corn, or soy. Grain-free diets are often preferred by pet owners seeking alternative options or if their pets have specific dietary sensitivities. |
| Premium Pet Food | High-quality pet food formulated with superior ingredients often offers additional nutritional benefits compared to standard pet food. |
| Natural Pet Food | Pet food made from natural ingredients, with minimal processing and without artificial preservatives. |
| Organic Pet Food | Pet food is produced using organic ingredients, free from synthetic pesticides, hormones, and genetically modified organisms (GMOs). |
| Extrusion | A manufacturing process used to produce dry pet food, where ingredients are cooked, mixed, and shaped under high pressure and temperature. |
| Other Pets | Other pets include birds, fish, rabbits, hamsters, ferrets, and reptiles. |
| Palatability | The taste, texture, and aroma of pet food influence its appeal and acceptance by pets. |
| Complete and Balanced Pet Food | Pet food that provides all essential nutrients in appropriate proportions to meet the nutritional needs of pets without additional supplementation. |
| Preservatives | These are the substances that are added to pet food to extend its shelf life and prevent spoilage. |
| Nutraceuticals | Food products that offer health benefits beyond basic nutrition, often contain bioactive compounds with potential therapeutic effects. |
| Probiotics | Live beneficial bacteria that promote a healthy balance of gut flora, supporting digestive health and immune function in pets. |
| Antioxidants | Compounds that help neutralize harmful free radicals in the body, promoting cellular health and supporting the immune system in pets. |
| Shelf-Life | The duration of which pet food remains safe and nutritionally viable for consumption after its production date. |
| Prescription diet | Specialized pet food formulated to address specific medical conditions under veterinary supervision. |
| Allergen | A substance that can cause allergic reactions in some pets, leading to food allergies or sensitivities. |
| Canned food | Wet pet food that is packed in cans and contains higher moisture content than dry food. |
| Limited ingredient diet (LID) | Pet food formulated with a reduced number of ingredients to minimize potential allergens. |
| Guaranteed Analysis | The minimum or maximum levels of certain nutrients present in pet food. |
| Weight management | Pet food designed to help pets maintain a healthy weight or support weight loss efforts. |
| Other Nutraceuticals | It includes prebiotics, antioxidants, digestive fiber, enzymes, essential oils and herbs. |
| Other Veterinary Diets | It includes weight management diets, skin and coat health, cardiac care, and joint care. |
| Other Treats | It includes rawhides, mineral blocks, lickables, and catnips. |
| Other Dry Foods | It includes cereal flakes, mixers, meal toppers, freeze-dried foods, and air-dried foods. |
| Other Animals | It includes birds, fish, reptiles, and small animals (rabbits, ferrets, hamsters). |
| Other Distribution Channels | It includes veterinary clinics, local unregulated stores, and feed and farm stores. |
| Proteins and Peptides | Proteins are large molecules composed of basic units called amino acids which help in the growth and development of pets. Peptides are the short string of 2 to 50 amino acids. |
| Omega-3 fatty acids | Omega-3 fatty acids are essential polyunsaturated fats that play a crucial role in the overall health and well-being of Pets |
| Vitamins | Vitamins are the essential organic compounds that are essential for vital physiological functioning. |
| Minerals | Minerals are naturally occurring inorganic substances that are essential for various physiological functions in pets. |
| CKD | Chronic Kidney Disease |
| DHA | Docosahexaenoic Acid |
| EPA | Eicosapentaenoic Acid |
| ALA | Alpha-linolenic Acid |
| BHA | Butylated Hydroxyanisol |
| BHT | Butylated Hydroxytoluene |
| FLUTD | Feline Lower Urinary Tract Disease |


Research Methodology
Mordor Intelligence follows a four-step methodology in all our reports.
- Step-1: IDENTIFY KEY VARIABLES: In order to build a robust forecasting methodology, the variables and factors identified in Step-1 are tested against available historical market numbers. Through an iterative process, the variables required for market forecast are set and the model is built on the basis of these variables.
- Step-2: Build a Market Model: Market-size estimations for the forecast years are in nominal terms. Inflation is not a part of the pricing, and the average selling price (ASP) is kept constant throughout the forecast period.
- Step-3: Validate and Finalize: In this important step, all market numbers, variables and analyst calls are validated through an extensive network of primary research experts from the market studied. The respondents are selected across levels and functions to generate a holistic picture of the market studied.
- Step-4: Research Outputs: Syndicated Reports, Custom Consulting Assignments, Databases & Subscription Platforms


