Netherlands Last Mile Delivery Market Size and Share
Market Overview
| Study Period | 2020 - 2031 |
|---|---|
| Forecast Data Period | 2026 - 2031 |
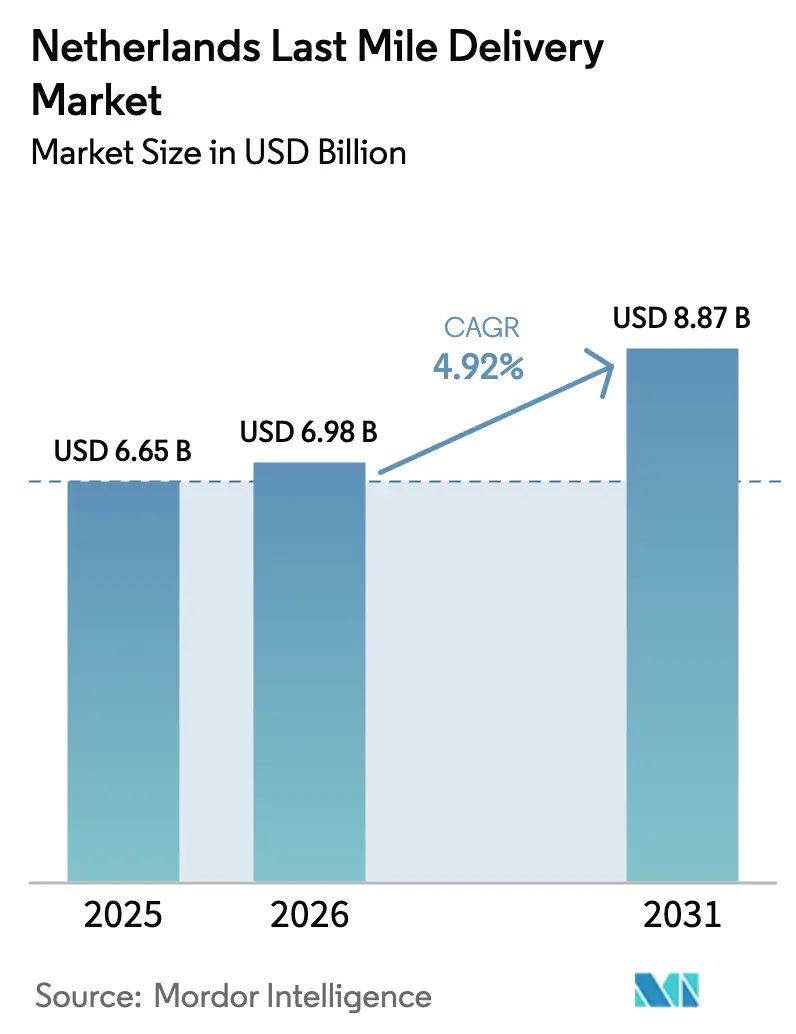
| Base Year Market Size (2025) | USD 6.65 Billion |
| Market Size (2026) | USD 6.98 Billion |
| Market Size (2031) | USD 8.87 Billion |
| Growth Rate (2026 - 2031) | 4.92% CAGR |
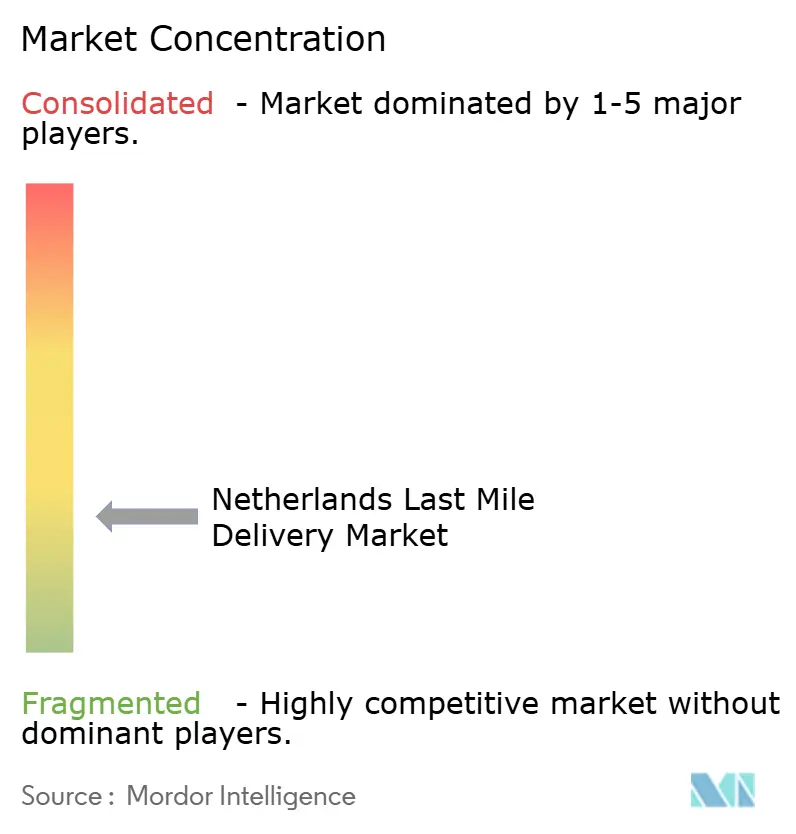
| Market Concentration | Low |
Major Players *Disclaimer: Major Players sorted in no particular order Image © Mordor Intelligence. Reuse requires attribution under CC BY 4.0. | |
Netherlands Last Mile Delivery Market Analysis by Mordor Intelligence
The Netherlands last mile market size was valued at USD 6.65 billion in 2025 and estimated to grow from USD 6.98 billion in 2026 to reach USD 8.87 billion by 2031, at a CAGR of 4.92% during the forecast period (2026-2031). This steady trajectory reflects a maturing delivery ecosystem shaped by emission-free-zone mandates, e-commerce scale effects, and intensifying labor constraints. Operators able to absorb electrification costs, implement route-optimization software, and secure scarce labor are positioned to protect margins while others face structural headwinds. Demand remains volume-dense in the Randstad, yet secondary regions attract new distribution centers because real-estate costs are lower and highway connectivity is strong. A measured rise in higher-value segments such as healthcare logistics signals a pivot from commoditized parcel flows toward premium niches that defend yields.
Key Report Takeaways
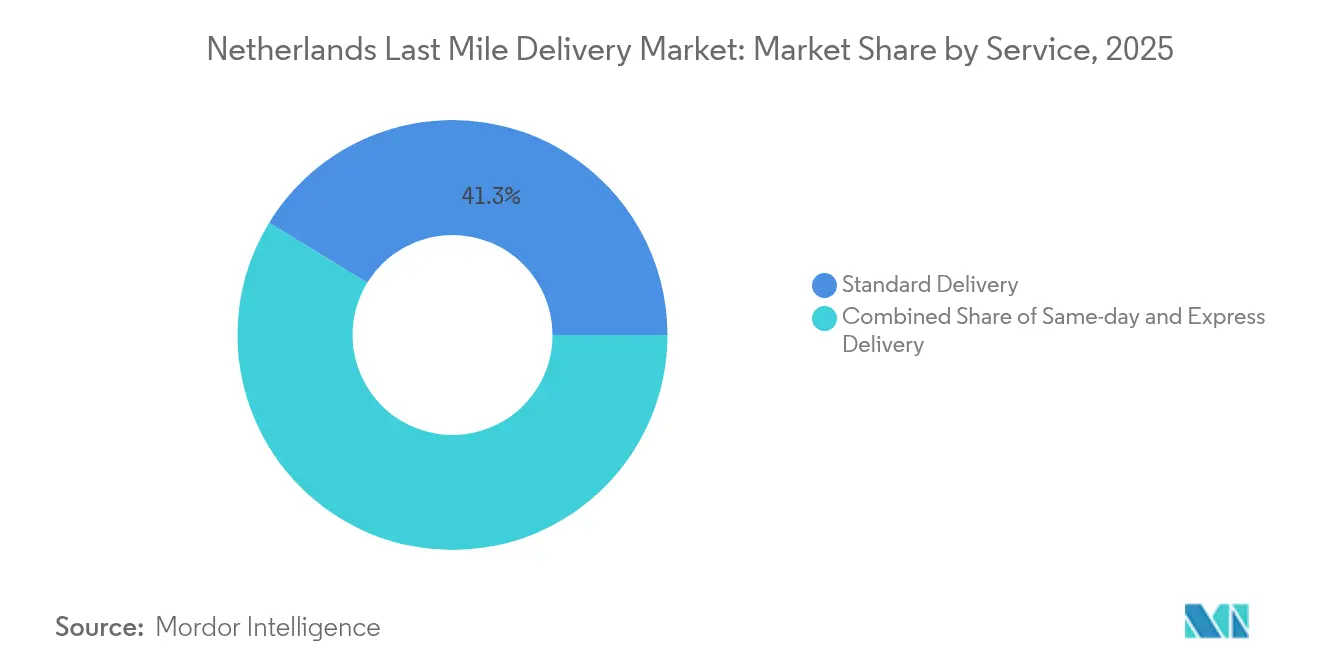
- By service, standard delivery held 41.25% of the Netherlands last mile market share in 2025; same-day delivery is forecast to post a 4.02% CAGR through 2031.
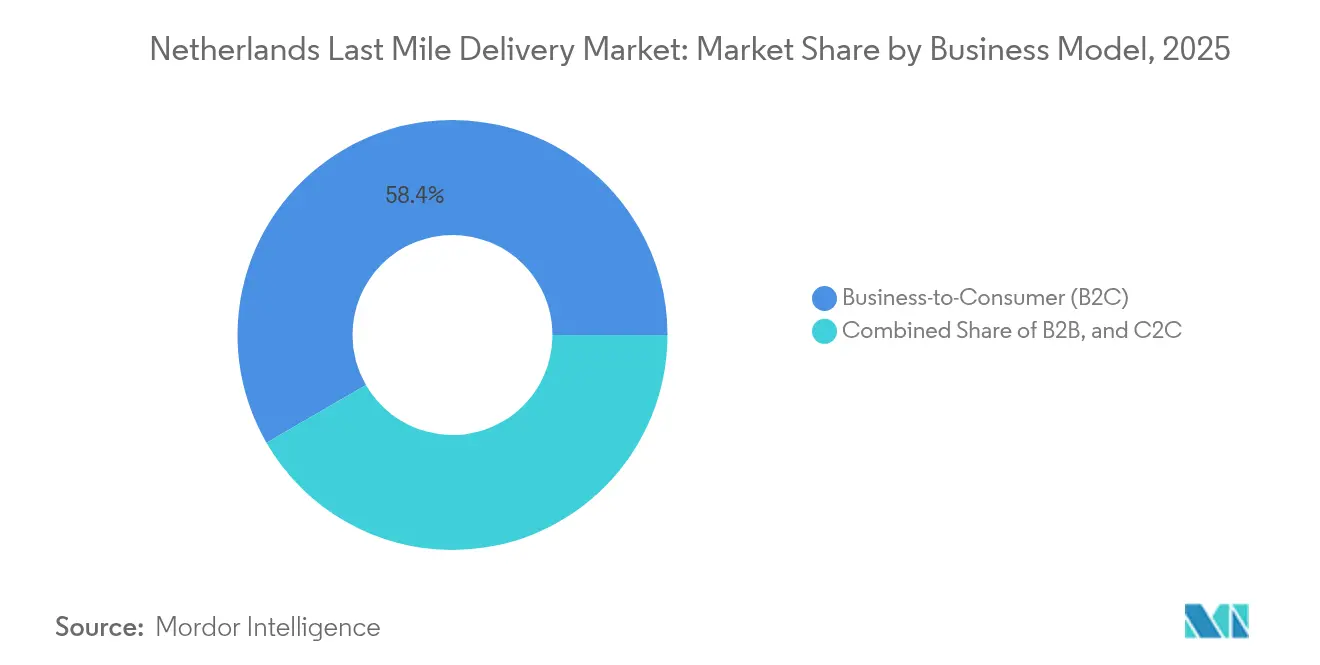
- By business model, the B2C segment commanded 58.35% of the Netherlands last mile market size in 2025, while C2C operations are projected to expand at a 3.78% CAGR between 2026-2031.
- By end-user industry, healthcare & medical supplies accounted for a 4.42% CAGR-the fastest within the Netherlands last mile market over the forecast horizon.
- By region, the Randstad retained a dominant 57.35% revenue position in 2025, but East Netherlands is projected to grow at 4.61% CAGR to 2031.
Note: Market size and forecast figures in this report are generated using Mordor Intelligence’s proprietary estimation framework, updated with the latest available data and insights as of 2026.
Netherlands Last Mile Delivery Market Trends and Insights
Drivers Impact Analysis*
| Driver | (~) % Impact on CAGR Forecast | Geographic Relevance | Impact Timeline |
|---|---|---|---|
| Growing online grocery penetration | +0.8% | National, concentrated in Randstad urban areas | Medium term (2-4 years) |
| Explosive e-commerce parcel volumes | +1.2% | National, with spillover to cross-border flows | Short term (≤2 years) |
| Same-day delivery culture among consumers | +0.6% | Amsterdam, Rotterdam, Utrecht, The Hague | Short term (≤2 years) |
| Government-mandated zero-emission zones | +0.9% | 16 municipalities, rising to 31 by end-2025 | Medium term (2-4 years) |
| Micro-fulfillment & dark-store expansion | +0.5% | Dense urban areas, chiefly Randstad | Long term (≥4 years) |
| Automation to counter rising labor scarcity | +0.7% | National, early pilots in major hubs | Long term (≥4 years) |
| Source: Mordor Intelligence | |||
Growing Online Grocery Penetration
Online grocery’s rapid adoption reshapes fulfillment patterns as Dutch households increasingly include bulky items such as beverages and cleaning supplies in digital baskets. Albert Heijn’s leadership in scheduled home delivery yields parcel density that lowers unit costs for contracted carriers, yet the rise of marketplaces like Amazon and Bol.com fragments routes by adding alternative pick-up addresses. Last-mile providers answer by re-routing electric vans toward micro-hubs near supermarkets and expanding insulated-box capacity to mitigate load-mix challenges. A mid-term lift in revenue stems from recurring weekly food orders that stabilize demand profiles across seasons while strengthening contractual lock-ins with retailers[1]“Tariefruimte universele postdienst 2025,” Autoriteit Consument & Markt, acm.nl.
Explosive E-commerce Parcel Volumes
Dutch online spending reached EUR 36 billion (USD 39.73 billion) in 2024, translating into 345 million transactions even after a modest decline in order count. Higher ticket values improve stop density, allowing vans to average more parcels per drive and improving fuel-adjusted margins. Cross-border demand worth EUR 4.4 billion (USD 4.85 billion) requires harmonized customs pre-clearance, a capability large integrators already possess. Out-of-home channels such as parcel lockers multiplied 1.5× year on year, yet 70-90% of shoppers still insist on doorstep service. Providers therefore couple dynamic routing with predictive demand tools to balance consumer convenience against traffic bottlenecks in dense urban cores.
Same-day Delivery Culture Among Dutch Consumers
Delivery speed is now inseparable from brand perception: 91% of shoppers weigh convenience in purchase decisions, while 75% attach similar importance to speed. The challenge surfaces because willingness to pay premiums lags expectations, compressing yield per stop. Larger operators therefore refine city-hub models that concentrate late-evening cut-offs, letting pick-waves reach 22:00 while maintaining early-morning delivery windows. CityHub sites processing 10,000 + parcels daily offer fixed-route advantages that smaller couriers struggle to replicate[2]“Dutch online shopping trends: An international comparison,” ChannelEngine, channelengine.com.
Government-Mandated Zero-Emission City Logistics Zones
Zero-emission zones effective from January 2025 impose EUR 120 fines on non-compliant vans and EUR 310 on trucks once grace periods lapse. PostNL and DHL pre-emptively electrified large shares of fleets, translating regulatory risk into competitive moat. Vehicle turnover accelerates as BPM purchase tax was scrapped on the same date, making once-costly battery vans more attainable. Operators yet to modernize face capital expenditure surges that elevate barriers to entry and catalyze industry consolidation[3]“Rising Last-Mile Delivery Costs Pose Challenges for European E-Commerce Retailers,” ESM Magazine, esmmagazine.com.
Restraints Impact Analysis*
| Restraint | (~) % Impact on CAGR Forecast | Geographic Relevance | Impact Timeline |
|---|---|---|---|
| Persistent delivery-cost inflation | -1.1% | National, strongest in large metros | Short term (≤2 years) |
| Urban congestion & curb-space restrictions | -0.6% | Amsterdam, Rotterdam, Utrecht, The Hague | Medium term (2-4 years) |
| Stringent working-hour rules for couriers | -0.4% | National | Long term (≥4 years) |
| Fragmented micro-hub real-estate availability | -0.3% | High-density urban zones | Long term (≥4 years) |
| Source: Mordor Intelligence | |||
Persistent Delivery-Cost Inflation
Fuel volatility, driver wage hikes, and compliance outlays have pushed average European last-mile costs up to 90% since 2023; 35% of Dutch retailers passed fees to shoppers whereas another 35% uplifted product prices. The Dutch postal regulator raised the 2025 universal-service tariff ceiling to EUR 2.9084, underscoring a pass-through mechanism yet highlighting capped upside for parcel rates. Operators with diversified locker networks mitigate home-delivery surcharges, but universal preference for doorstep service limits large-scale migration to cheaper modes.
Urban Congestion and Curb-Space Restrictions
Major Dutch cities enforce timed access windows and vehicle-class bans to mitigate congestion. Couriers respond with cargo bikes and sidewalk robots, yet deployment scales slowly given limited curb allocation and uncertain consumer adoption. Each restriction compresses routing flexibility, forcing denser load consolidation that lengthens cycle times and risks same-day SLAs. Operators owning proprietary locker grids secure partial relief, while smaller firms reliant on on-street stops face schedule slippage and rising parking penalties.
*Our forecasts treat driver/restraint impacts as directional, not additive. The impact forecasts reflect baseline growth, mix effects, and variable interactions.
Segment Analysis
By Service: Standard Delivery Retains the Bulk of Demand
Standard delivery captured 41.25% revenue share in 2025, anchored by predictable two-day expectations and favorable vehicle utilization rates. The Netherlands last mile market size for this tier eclipses that of faster segments by monetizing wide urban and rural coverage without premium surcharges. Same-day demand is ramping at a 4.02% CAGR on the back of urban consumer impatience, yet operators protect profitability by slotting these parcels into end-of-run consolidation waves. Express delivery maintains a stable mid-single-digit slice, primarily serving B2B time-critical flows where service guarantees justify higher fees.
Operators leaning on standard delivery optimize asset turns through consolidated milk-run routing, often integrating parcel lockers that cut failed-delivery rates below 4%. Meanwhile, growth in same-day is funneled through city-hubs equipped with electric vans and cargo bikes that navigate zero-emission zones seamlessly. The twin-track approach enables carriers to hedge margin dilution risk while maintaining competitive parity on service speed.


By Business Model: B2C Dominance Faces Platform-Economy Upstarts
B2C flows accounted for 58.35% of 2025 revenue as large online retailers lock in multi-year capacity deals that underpin network investments. The Netherlands last mile market share advantage here pays for upgrading depots with automated sorters and AI-powered dispatch. Simultaneously, C2C volumes are growing fastest at 3.78% CAGR, fueled by peer-to-peer resale platforms that rely on pick-up-drop-off points more than doorstep handovers. B2B traffic, while mature, still supports above-average yields because business clients demand fixed delivery windows.
Traditional carriers now test hybrid networks whereby a single van collects C2C return parcels during B2C rounds, trimming empty-run kilometers. Gig-platform partnerships expand off-peak capacity and provide variable-cost labor, a hedge against seasonality. Over 2026-2027, C2C density improvements could narrow cost gaps, prompting incumbents to integrate API-based booking directly into resale platforms to secure volume before agile micro-couriers enter the race.
By End-User Industry: Healthcare Leads Premium Shift
E-commerce retail held 26.85% share, underpinning volume stability, yet healthcare & medical supplies grew at the fastest 4.42% CAGR on specialized cold-chain requirements. The Netherlands last mile market size opportunity in healthcare commands premium per-parcel pricing that can be 2-3× higher than general merchandise, offsetting costs of GDP-compliant packaging and temperature-controlled vans. Fashion, electronics, and beauty segments fill idle capacity across seasons, contributing to balanced fleet utilization.
Specialized operators such as PharmaSwap coordinate medicine redistribution under strict traceability, partnering with temperature-controlled fleets operated by UPS Healthcare. The barrier to entry created by compliance audits shields margins from commoditization. For general carriers, strategic alliances with pharmaceutical wholesalers provide a springboard into this resilient niche without diluting network efficiency.
Geography Analysis
The Randstad remains the nerve center of the Netherlands last mile market, capturing 57.35% of 2025 turnover owing to dense household clusters and robust purchasing power. Zero-emission-zone enforcement from 2025 increases capital intensity but also entrenches incumbents that already electrified vans and installed parcel lockers at supermarkets and rail stations. Consumer behavior underscores high service expectations: 91% rate convenient delivery as essential, while 70% demand multiple option choices, pushing carriers to blend cargo-bike loops with evening locker drops.
East Netherlands is poised for the strongest 4.61% CAGR, supported by province-backed logistics parks and proximity to the German consumer base. Facilities like UPS’s Roermond megacenter and Eindhoven campus attract overflow from crowded Randstad depots, reducing land costs per square meter by up to 25%. Cross-border flows amplify parcel counts, enabling carriers to spread fixed costs across larger volumes and accelerate payback on automation.
North and South Netherlands function as balancing nodes for nationwide line-haul, providing redundancy against Randstad bottlenecks. Southern provinces benefit from deep-water port access, connecting to Antwerp and Rotterdam for inbound containers. Northern provinces supply lower-cost land for secondary sort centers, ensuring carriers can stage overflow during holiday peaks. Collectively, these regions reinforce a multi-hub network that sustains service-level agreements even under urban access constraints.
Competitive Landscape
PostNL controls around 60% of domestic volume through its universal-service mandate and dense locker grid. DHL follows with roughly 35%, leveraging its international road feeder network and AI-augmented CityHub model to achieve late cut-offs. DPD secures about 5%, leaning on cross-border e-commerce lanes into Germany and France. Market leaders convert early electrification into a durable edge, as smaller couriers face steep capital outlays to acquire compliant fleets.
Industry consolidation is noteworthy: 2024 saw major Benelux logistics M&A deals at 10.4× EBITDA multiples, underscoring investor appetite for dense last-mile networks. Technology adoption is a focal point-DHL’s 2025 roadmap integrates computer vision and audio AI, while emerging players like Trunkrs deploy adaptive sortation that scales for peak events without full-time labor. Niche entrants target healthcare logistics, cold-chain food, and C2C returns, areas where agility and specialization can justify premium pricing.
Competition increasingly revolves around out-of-home coverage, data-driven route orchestration, and regulatory preparedness. Firms able to deliver on all three fronts secure long-term contracts with large retailers, stabilizing cash flows and funding continuous fleet upgrades. Those lagging risk attrition as retailers migrate to carriers offering transparent carbon reporting and service diversity.
Netherlands Last Mile Delivery Industry Leaders
PostNL
DPD
UPS
DHL Express
FedEx
- *Disclaimer: Major Players sorted in no particular order

Recent Industry Developments
- February 2025: Uber unveiled revised independent-courier contracts that align with Dutch labor statutes while preserving flexible scheduling.
- January 2025: Zero-emission zones came into force in 16 municipalities; non-compliant vans face EUR 120 fines, prompting accelerated fleet electrification by PostNL and DHL.
- December 2024: DHL announced plans to install 1,250 additional parcel lockers by end-2025, expanding consumer pick-up choice.
- September 2024: DHL opened a circular CityHub in Hendrik-Ido-Ambacht processing 10,000 + daily parcels with extended 22:00 cut-offs.


Netherlands Last Mile Delivery Market Report Scope
Last-mile delivery refers to the last leg of logistics operations. A product’s journey from a warehouse to the doorstep of the end customer. This last step of the delivery process is most critical and should be well-managed for speedy shipping. A complete background analysis of the Netherlands’ last-mile delivery market, including the assessment of the economy and contribution of sectors in the economy, market overview, market size estimation for key segments, and emerging trends in the market segments, market dynamics, and geographical trends, is included in the report.
The Netherlands’ last mile delivery market is segmented by service (B2B, B2C, C2C) and by delivery mode (regular delivery, same-day delivery, express delivery).
The report offers market size and forecasts in values (USD) for all the above segments.
| Standard Delivery |
| Same-day |
| Express Delivery |
| Business-to-Business (B2B) |
| Business-to-Consumer (B2C) |
| Customer-to-Consumer (C2C) |
| E-commerce Retail |
| Fashion and Lifestyle |
| Beauty, Wellness and Personal Care |
| Home and Furniture |
| Consumer Electronics and Appliances |
| Healthcare and Medical Supplies |
| Others |
| Randstad |
| North Netherlands |
| East Netherlands |
| South Netherlands |
| By Service | Standard Delivery |
| Same-day | |
| Express Delivery | |
| By Business Model | Business-to-Business (B2B) |
| Business-to-Consumer (B2C) | |
| Customer-to-Consumer (C2C) | |
| By End-user Industry | E-commerce Retail |
| Fashion and Lifestyle | |
| Beauty, Wellness and Personal Care | |
| Home and Furniture | |
| Consumer Electronics and Appliances | |
| Healthcare and Medical Supplies | |
| Others | |
| By Region (Value) | Randstad |
| North Netherlands | |
| East Netherlands | |
| South Netherlands |


Key Questions Answered in the Report
How big is the Netherlands last mile segment in 2026?
The Netherlands last mile market size is USD 6.98 billion in 2026 with a forecast to reach USD 8.87 billion by 2031.
What growth rate is expected through 2031?
The market is projected to expand at a 4.92% CAGR.
Which service tier is expanding fastest?
Same-day delivery is growing at a 4.02% CAGR, driven by urban consumer expectations for rapid fulfillment.
Which end-user industry shows the strongest upside?
Healthcare & medical supplies leads with a 4.42% CAGR due to temperature-controlled and compliance-dependent deliveries.
How will zero-emission zones influence carrier strategies?
Early fleet electrification gives incumbents an advantage while late adopters face fines and accelerated capital expenditure to comply with 2025 regulations.
What region outside the Randstad offers notable growth?
East Netherlands is forecast to register a 4.61% CAGR, supported by lower land costs and proximity to Germany.
Page last updated on:


