Market Overview
| Study Period | 2018 - 2031 |
|---|---|
| Forecast Data Period | 2026 - 2031 |
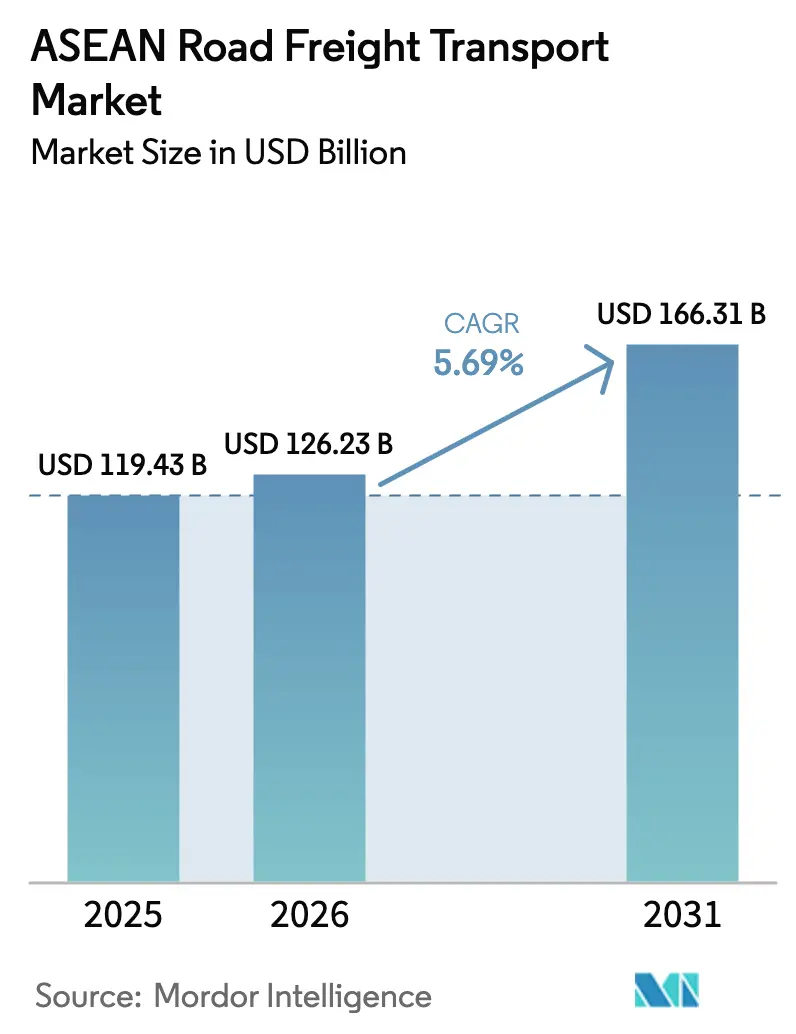
| Base Year Market Size (2025) | USD 119.43 Billion |
| Market Size (2026) | USD 126.23 Billion |
| Market Size (2031) | USD 166.31 Billion |
| Growth Rate (2026 - 2031) | 5.69% CAGR |
| Market Concentration | Low |
Major Players *Disclaimer: Major Players sorted in no particular order Image © Mordor Intelligence. Reuse requires attribution under CC BY 4.0. | |
ASEAN Road Freight Transport Market Analysis by Mordor Intelligence
The ASEAN road freight transport market size was valued at USD 119.43 billion in 2025 and estimated to grow from USD 126.23 billion in 2026 to reach USD 166.31 billion by 2031, at a CAGR of 5.69% during the forecast period (2026-2031). Buoyant cross-border investment, swelling e-commerce order books, and multi-billion-dollar roadway upgrades are reinforcing the ASEAN road freight transport market’s momentum. Manufacturers diverting production from China are injecting steady cargo streams into Vietnam, Thailand, and Indonesia, while electronic customs windows and the ASEAN Customs Transit System (ACTS) shrink clearance times. Operators adopting telematics and route-optimization platforms are squeezing more mileage out of existing fleets, and capital flowing into refrigerated transport, alternative-fuel trucks, and hub-and-spoke LTL networks signals a pivot toward higher-margin niches. Persistent driver shortages, fuel-price swings, and quota-based permit regimes, however, continue to pressure smaller fleets that lack pricing power or hedging capacity.
Key Report Takeaways
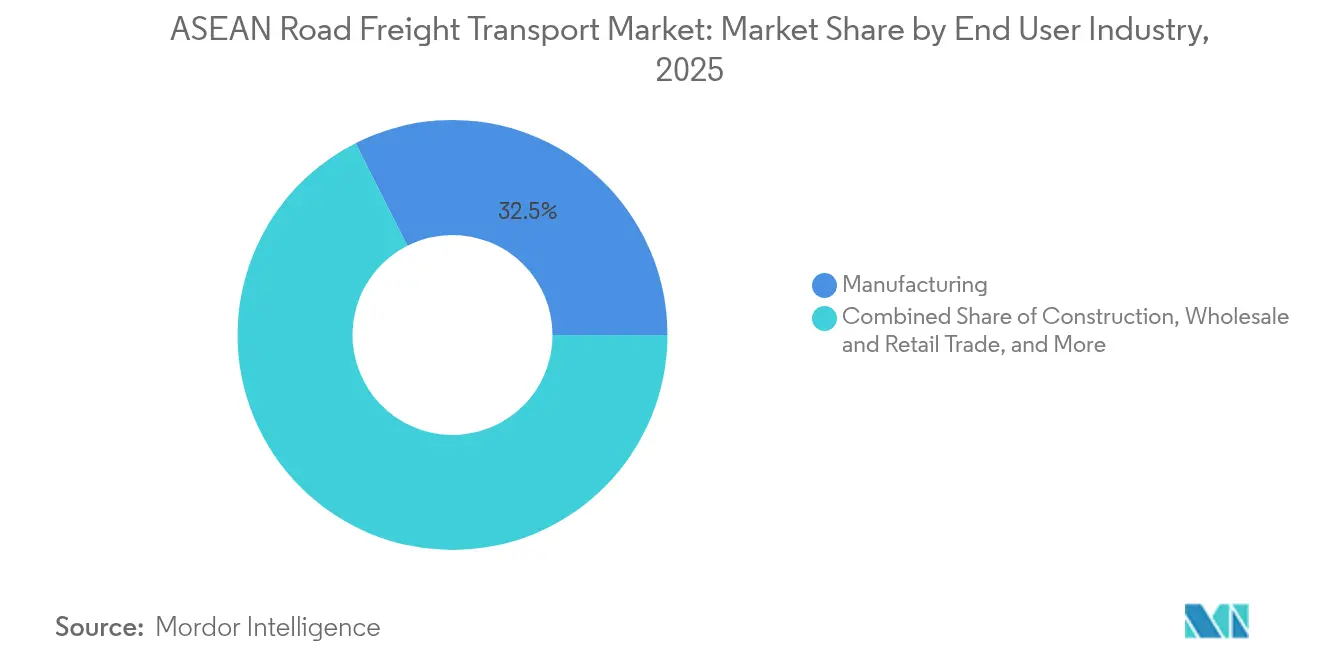
- By end user industry, manufacturing led with 32.45% of ASEAN road freight transport market share in 2025, whereas wholesale and retail trade is advancing at the fastest 6.65% CAGR between 2026-2031.
- By destination, domestic freight accounted for 64.02% of the ASEAN road freight transport market size in 2025, but international flows are growing at a 6.78% CAGR between 2026-2031.
- By truckload specification, full-truck-load held 80.42% of the revenue share in 2025, while less-than-truck-load is expanding most rapidly at a 6.52% CAGR between 2026-2031.
- By containerization, non-containerized cargo dominated 85.12% of the revenue share in 2025, in contrast with containerized volumes rising at a 5.98% CAGR between 2026-2031.
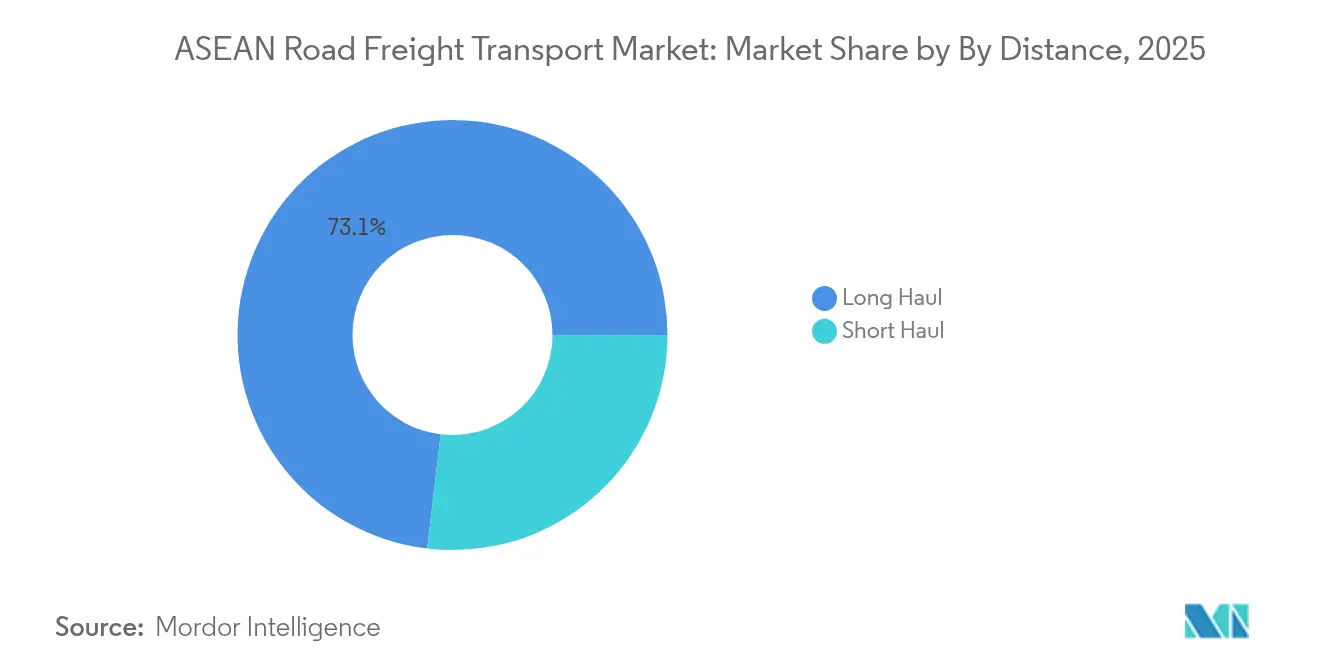
- By distance, long-haul captured 73.10% of the revenue share in 2025 and is also leading growth at a 6.12% CAGR between 2026-2031.
- By goods configuration, solid goods represented 64.06% of the revenue share in 2025, whereas fluid goods are progressing at a 6.10% CAGR between 2026-2031.
- By temperature control, non-temperature-controlled shipments occupied 93.98% of the revenue share in 2025, yet temperature-controlled freight is accelerating at a 6.35% CAGR between 2026-2031.
- By country, Indonesia led with 44.62% of the revenue share in 2025, while Vietnam is set to log the quickest 6.14% CAGR between 2026-2031 as FDI-fuelled manufacturing scales up.
Note: Market size and forecast figures in this report are generated using Mordor Intelligence’s proprietary estimation framework, updated with the latest available data and insights as of 2026.
ASEAN Road Freight Transport Market Trends and Insights
Drivers Impact Analysis*
| Driver | (~) % Impact on CAGR Forecast | Geographic Relevance | Impact Timeline |
|---|---|---|---|
| E-commerce-led last-mile and LTL volume surge | +1.2% | Indonesia, Thailand, Malaysia | Short term (≤ 2 years) |
| Regional supply-chain diversification from China to ASEAN | +1.8% | Vietnam, Thailand, Malaysia | Medium term (2-4 years) |
| Infrastructure expansion (ACTS, RCEP-enabled corridors) | +0.9% | Cross-border corridors, Thailand EEC | Long term (≥ 4 years) |
| Rising adoption of fleet telematics and route-optimization platforms | +1.1% | Singapore, Malaysia urban centers | Medium term (2-4 years) |
| EV and alternative-fuel truck pilots improve TCO post-2025 | +0.7% | Thailand, Indonesia | Long term (≥ 4 years) |
| Cold-chain boom for vaccines and halal food exports | +0.8% | Malaysia halal hub, region-wide | Short term (≤ 2 years) |
| Source: Mordor Intelligence | |||


E-Commerce-Led Last-Mile and LTL Volume Surge
Mass-market platforms in Indonesia, Thailand, and Malaysia are recording millions of daily checkouts that pull shipment sizes down even as frequency rises. Hub-and-spoke LTL networks have become indispensable for meeting same-day commitments in Jakarta, Bangkok, and Kuala Lumpur, and proprietary logistics arms are proliferating as marketplaces prioritize delivery control. Crowded city streets have raised the value of route-optimized dispatching, and rural e-commerce penetration remains in its early innings as mobile wallets spread beyond urban cores[1]Sea Limited, “Annual Report 2024 – Southeast Asia E-commerce Statistics,” sea.com.
Regional Supply-Chain Diversification from China to ASEAN
“China+1” strategies redirected sizable FDI flows into Vietnam, Thailand, and Malaysia during 2024, spawning fresh corridors for electronics, automotive parts, and textiles. Intermediate goods now shuttle between multiple ASEAN plants before final assembly, magnifying cross-border haulage demand. Cold-chain intensity is rising for battery components and precision electronics, and RCEP’s tariff relief amplifies volumes despite unresolved axle-weight divergences and permit quotas.
Infrastructure Expansion (ACTS, RCEP-Enabled Corridors)
Thailand’s Eastern Economic Corridor, Vietnam’s North–South Expressway, and Indonesia’s National Single Window are accelerating cargo velocity. ACTS guarantees allow trucks to transit multiple borders without cargo inspections, trimming door-to-door lead times by nearly two days on certain lanes. Nonetheless, quota caps on Thai-Malaysian and Vietnam-Cambodia permits still necessitate costly transshipment stops[2]Land Transport Authority Singapore, “Intelligent Transport Systems,” lta.gov.sg.
Rising Adoption of Fleet Telematics and Route-Optimization Platforms
Singapore’s AI-controlled traffic network slashes idling, reduces delivery windows, and sets a blueprint for neighboring countries. Fleets across Malaysia and Indonesia now track vehicle health, automate proof-of-delivery, and schedule predictive maintenance, lifting equipment uptime, and curbing fuel burn. Subscription-based telematics lowers the entry barrier, enabling small and midsize haulers to join the digital transition[3]Thailand Board of Investment, “Eastern Economic Corridor Development,” boi.go.th.
Restraints Impact Analysis*
| Restraint | (~) % Impact on CAGR Forecast | Geographic Relevance | Impact Timeline |
|---|---|---|---|
| Driver shortages and escalating labor costs | -0.6% | Thailand, Malaysia | Short term (≤ 2 years) |
| Fuel-price volatility | -0.4% | Indonesia, Thailand | Short term (≤ 2 years) |
| Cross-border license/permit quotas despite ACTS | -0.5% | Thailand-Malaysia, Vietnam-Cambodia | Medium term (2-4 years) |
| Urban congestion tolling pushes up delivery costs | -0.3% | Jakarta, Bangkok, Manila | Long term (≥ 4 years) |
| Source: Mordor Intelligence | |||
Driver Shortages and Escalating Labor Costs
An aging workforce, competition from gig-economy couriers, and demanding work schedules leave many seats empty in Thailand and Malaysia. Wage bids climbed sharply in 2024, and spot freight rates spiked during the Lunar New Year and Ramadan when trucks stood idle for lack of drivers. Japanese recruiters hiring ASEAN drivers under bilateral accords erode local availability further, while automation and yard shunting technology offer only partial relief[4]International Labour Organization, “Southeast Asia Labor Market Analysis,” ilo.org.
Fuel-Price Volatility
Indonesia’s diesel-subsidy rollback and Malaysia’s phased rationalization inflated pump prices by double digits in 2025, pushing operating-cost ratios above historic norms. Large fleets shield margins with bulk-purchase contracts, but small haulers without credit lines often capitulate or sell assets, nudging the ASEAN road freight transport market toward consolidation.
*Our forecasts treat driver/restraint impacts as directional, not additive. The impact forecasts reflect baseline growth, mix effects, and variable interactions.
Segment Analysis
By End User Industry: Manufacturing Drives Freight Intensity
Manufacturing held 32.45% of ASEAN road freight transport market share in 2025 and continues to anchor regional volumes as electronics, automotive, and textile clusters multiply across Vietnam, Thailand, and Indonesia. Wholesale and retail trade is charging ahead at a 6.65% CAGR between 2026-2031, reflecting omnichannel fulfillment patterns and fragmented shipment sizes that favor consolidation hubs and parcel-dense city routes. Agriculture, fishing, and forestry supply steady loads of palm oil, rubber, and rice, while construction cargoes climb on the back of record public-works budgets in Thailand and Vietnam. Oil, gas, mining, and quarrying shipments rely on specialized tankers and bulk carriers that command premium rates owing to hazardous-material requirements.
The ASEAN road freight transport market gains resilience from the manufacturing segment’s multi-leg supply chains, where electronic sub-assemblies criss-cross the region before final integration. Vietnam’s industrial zones have attracted Japanese and Korean logistics specialists operating high-cube trailers with integrated telemetry to serve just-in-time factories. Meanwhile, palm oil and rubber exports keep agricultural haulers busy year-round, and fledgling renewable-energy equipment—wind-tower sections, battery cabinets, and solar panels—adds oversize freight to the mix.


By Destination: Domestic Freight Dominates Volumes
Domestic moves represented 64.02% of the ASEAN road freight transport market size in 2025, as Indonesia’s archipelago, Thailand’s multi-hub economy, and Malaysia’s peninsular-Borneo split necessitate extensive internal haulage. International runs are widening faster at a 6.78% CAGR between 2026-2031 as RCEP reduces paperwork and “China+1” trade creates new intermediate-goods corridors. Thailand’s Eastern Economic Corridor, for instance, funnels components from Laem Chabang port to land borders before they head into Vietnam for finishing.
Domestic intensity stems from the distribution of staple goods, last-mile e-commerce delivery, and raw-materials repositioning among far-flung islands and provinces. International acceleration is most conspicuous on Vietnam–Thailand and Malaysia–Singapore lanes, yet axle-weight limits and permit quotas still complicate border crossings.
By Truckload Specification: FTL Maintains Dominance Amid LTL Surge
Full-truck-load retained 80.42% of ASEAN road freight transport market share in 2025, benefiting from bulk commodities, factory-direct inputs, and big-box retail replenishments. Less-than-truck-load volumes, though smaller, are sprinting at a 6.52% CAGR between 2026-2031 as urban customers demand fast, small-batch deliveries. Japanese carriers and local startups are pooling investments in cross-dock terminals and cloud-based booking apps to monetize fragmented parcel flow.
FTL’s robustness rests on predictable factory cycles and commodity pipelines for coal, oil, and palm-oil derivatives, which reward dedicated capacity and offer scale economies. LTL’s upside is linked to technology-enabled dynamic routing, which allocates deck space in real time, lifting vehicle fill rates and reducing cost per drop.
By Containerization: Non-Containerized Freight Leads Volumes
Non-containerized traffic made up 85.12% of the ASEAN road freight transport market size in 2025 because palm oil, rubber, coal, and petroleum dominate the export basket. Containerized cargo, propelled by electronics and consumer-goods assembly lines, is growing 5.98% CAGR between 2026-2031 as shippers favor standardized handling and easy modal transfers.
Bulk tankers, tipper trucks, and flatbeds rule the non-containerized segment, while inland box-haulage gains speed from digital single-window systems that shave customs dwell times. Vietnam’s new North–South Expressway offers dedicated freight lanes compatible with high-cube boxes, encouraging manufacturers to switch from break-bulk to containerized flows.
By Distance: Long-Haul Dominates Amid Infrastructure Gains
Long-haul services secured 73.10% of the ASEAN road freight transport market share in 2025 and outpaced short-haul at a 6.12% CAGR between 2026-2031 because producers, ports, and consuming hubs often sit hundreds of kilometers apart. National highway extensions in Vietnam, Indonesia, and Thailand reduce road times and favor consolidated long-run dispatches. Short-haul still thrives in last-mile e-commerce but loses cost efficiencies to mounting congestion charges in Jakarta and Bangkok.
Inter-island distances in Indonesia, peninsular-to-Borneo logistics in Malaysia, and mainland traverse routes in Vietnam define long-haul viability. Improved bridge and causeway connectivity is further knitting together previously disjointed economic zones.
By Goods Configuration: Solid Goods Lead Amid Fluid Growth
Solid goods hauled 64.06% of ASEAN road freight transport market share in 2025, thanks to electronics, textiles, and consumer products. Fluid cargo—fuel, chemicals, edible oils—registers a faster 6.10% CAGR between 2026-2031 as refinery expansions in Indonesia and chemical clusters in Malaysia and Thailand widen liquid freight demand.
Solid-goods carriers are investing in high-cube and curtain-sider trailers for fragile electronics and fast-moving consumer goods, while fluid-cargo specialists retrofit stainless tanks with temperature controls and overfill protection to meet stricter safety mandates.
By Temperature Control: Ambient Freight Dominates Cold-Chain Growth
Non-temperature-controlled shipments commanded 93.98% of volumes in 2025 because most manufactured and commodity cargo travels without thermal constraints. Refrigerated loads, expanding at a 6.35% CAGR between 2026-2031, are scaling on vaccine distribution, meat exports, and halal-certified foods. DHL’s Kuala Lumpur Gateway quadrupled processing capacity in 2024, giving the network a strategic cold-chain anchor in ASEAN.
Temperature-controlled fleets integrate telematics-based data loggers for live alerts, allowing them to guarantee GDP-compliant ranges on biopharma pallets and frozen seafood. Compliance costs are high, nudging smaller players to lease capacity from asset-heavy peers.
Geography Analysis
Indonesia captured 44.62% of the ASEAN road freight transport market share in 2025, underpinned by its USD 1.4 trillion economy and large consumer base. Electronic customs windows have cut average clearance by 30%, yet diesel-subsidy reforms raise per-kilometer costs. Jakarta’s weekday traffic drags average delivery speeds below 20 km/h, forcing carriers to reschedule off-peak dispatches.
Vietnam is advancing at the highest 6.14% CAGR between 2026-2031 as foreign manufacturers pour into industrial parks around Ho Chi Minh City, Hai Phong, and Da Nang. Near-completion of the North–South Expressway links these clusters, and Japanese third-party logistics specialists have secured long-term warehousing concessions to service electronics and garment exporters. Permit quotas with Cambodia are still slow cross-border hauls, adding transshipment costs.
Thailand benefits from the USD 45 billion Eastern Economic Corridor master plan, which bundles deep-sea ports, dual-track rail, and upgraded highways into an integrated freight grid. Driver shortages nevertheless remain acute, with demographic shifts cutting new license issuances by nearly 10% in 2024. Malaysia and the rest of ASEAN sustain mid-single-digit growth supported by palm oil, petrochemicals, and rising domestic e-commerce. Quota-based curbs on Malaysia–Thailand trucks temper lane optimization, but ACTS digital guarantees signal gradual improvement.
Competitive Landscape
The ASEAN road freight transport market remains fragmented: national champions, regional specialists, and global integrators vie for wallet share without any single player controlling double-digit revenue. DSV’s USD 15.8 billion takeover of DB Schenker in April 2025 created the world’s largest logistics firm and elevated its ASEAN presence through inherited depots and trucks. Technology adoption is a leading differentiator: Singaporean fleets powered by AI routing gained measurable CO₂ and cost advantages, prompting Malaysian rivals to license similar platforms.
Vertical integration is gathering pace. DHL pumped USD 69 million into a new Kuala Lumpur Gateway to secure cold-chain margins, while CJ Logistics earmarked hydrogen-truck pilots and automation scale-ups for its Thai subsidiary. Meanwhile, Japanese–Vietnamese joint ventures chase LTL gaps by importing consolidation workflows honed in Tokyo. Smaller enterprises struggle to fund telematics, alternative-fuel fleets, and ISO 9001 upgrades, accelerating buy-or-die dynamics.
Regulatory compliance is becoming a strategic moat. Pharmaceutical shippers insist on GDP-certified carriage, and exporters of halal-certified food demand Sharia-compliant handling, narrowing the field to operators with documented quality systems. Carbon-disclosure mandates from global retailers also reward carriers measuring and reporting Scope 1 emissions reliably.
ASEAN Road Freight Transport Industry Leaders
DHL Group
SF Express (KEX-SF)
CJ Logistics Corporation
DSV A/S
Tiong Nam Logistics Holdings Bhd
- *Disclaimer: Major Players sorted in no particular order

Recent Industry Developments
- April 2025: DSV completed its EUR 14.3 billion (USD 15.8 billion) acquisition of DB Schenker, creating a USD 47.3 billion revenue logistics leader with 160,000 employees worldwide.
- December 2024: Yusen Logistics Thailand deployed a fleet of battery-electric trucks and installed dedicated charging infrastructure at its Chonburi warehouse in pursuit of 2030 emissions cuts.
- December 2024: CJ Logistics prioritized automation, Southeast Asian network expansion via local alliances, and hydrogen-truck pilots in its 2025 operating plan.
- October 2024: DHL inaugurated a USD 69 million Kuala Lumpur Gateway at KLIA, boosting parcel-processing capacity fourfold and reinforcing the region’s cold-chain backbone.


ASEAN Road Freight Transport Market Report Scope
Agriculture, Fishing, and Forestry, Construction, Manufacturing, Oil and Gas, Mining and Quarrying, Wholesale and Retail Trade, Others are covered as segments by End User Industry. Domestic, International are covered as segments by Destination. Full-Truck-Load (FTL), Less than-Truck-Load (LTL) are covered as segments by Truckload Specification. Containerized, Non-Containerized are covered as segments by Containerization. Long Haul, Short Haul are covered as segments by Distance. Fluid Goods, Solid Goods are covered as segments by Goods Configuration. Non-Temperature Controlled, Temperature Controlled are covered as segments by Temperature Control. Indonesia, Malaysia, Thailand, Vietnam are covered as segments by Country.End User Industry
| Agriculture, Fishing, and Forestry |
| Construction |
| Manufacturing |
| Oil and Gas, Mining and Quarrying |
| Wholesale and Retail Trade |
| Others |
Destination
| Domestic |
| International |
Truckload Specification
| Full-Truck-Load (FTL) |
| Less than-Truck-Load (LTL) |
Containerization
| Containerized |
| Non-Containerized |
Distance
| Long Haul |
| Short Haul |
Goods Configuration
| Fluid Goods |
| Solid Goods |
Temperature Control
| Non-Temperature Controlled |
| Temperature Controlled |
Country
| Indonesia |
| Malaysia |
| Thailand |
| Vietnam |
| Rest of ASEAN |
| End User Industry | Agriculture, Fishing, and Forestry |
| Construction | |
| Manufacturing | |
| Oil and Gas, Mining and Quarrying | |
| Wholesale and Retail Trade | |
| Others | |
| Destination | Domestic |
| International | |
| Truckload Specification | Full-Truck-Load (FTL) |
| Less than-Truck-Load (LTL) | |
| Containerization | Containerized |
| Non-Containerized | |
| Distance | Long Haul |
| Short Haul | |
| Goods Configuration | Fluid Goods |
| Solid Goods | |
| Temperature Control | Non-Temperature Controlled |
| Temperature Controlled | |
| Country | Indonesia |
| Malaysia | |
| Thailand | |
| Vietnam | |
| Rest of ASEAN |


Market Definition
- Agriculture, Fishing, and Forestry (AFF) - This end user industry segment captures the external (outsourced) logistics expenditure incurred by the AFF industry players on road freight transport service. The end user players considered are the establishments primarily engaged in growing crops, raising animals, harvesting timber, harvesting fish & other animals from their natural habitats and providing related support activities. Herein, across the value chain, Logistics Service Providers (LSPs) play a crucial role in acquisition, storage, handling, transportation, and distribution activities for the optimal & continuous flow of inputs (seeds, pesticides, fertilizers, equipment, and water) from manufacturers or suppliers to the producers and smooth flow of output (produce, agro-goods) to distributors/ consumers. This includes both termperature controlled and non-temperature controlled logistics, as and when required according to the shelf life of goods being transported or stored.
- Construction - This end user industry segment captures the external (outsourced) logistics expenditure incurred by the construction industry players, on road freight transport service. The end user players considered are the establishments primarily engaged in constructing, repairing and renovating residential & commercial buildings, infrastructure, engineering works, subdividing and developing land. Logistics Service Providers (LSPs) play a crucial role in increasing profitability of construction projects by maintaing the inventory of raw materials & equipment, time-critical supplies and by providing other value added services for effective project management.
- Containerized Road Freight Transport - The segment captures the external (outsourced) logistics expenditure incurred by the road freight transport service end users on Full-Truck-Load (FTL) services. FTL road freight transport is characterized as a full single load not combined with other shipments. It comprises of shipments (i) devoted to the goods of a single shipper (ii) taken directly from a point of origin to one or more destination points (iii) comprising of bulk mail truck transportation (iv) comprising of both Container (Full Container Load, FCL)/Non-Container trucking services (v)comprsing of goods requiring temperature controlled or non-temperature controlled transportation services (vi) comprising of bulk liquid tankering (vii) invoving trucking of waste (viii) hazardous material trucking. Related value added services (VAS) of sorting, consolidation, deconslidation are included in the other services segment of freight and logistics market.
- Export Trends and Import Trends - Overall logistics performance of an economy is positively and significantly (statistically) correlated to its trade performance (exports and imports). Hence, in this industry trend, total value of trade, major commodities/ commodity groups and the major trade partners, for the studied geography (country or region as per the scope of report) have been analysed alongside the impact of major trade/logistics infrastructure investments & regulatory environment.
- Fluid Goods - The segment captures the external (outsourced) logistics expenditure incurred by the road freight transport service end users for the transport of bulk liquids, that are often used in extraction, manufacturing, food processing, agriculture industries among others. It includes transportation of liquids like (i) Chemicals/ hazardous goods (for instance acids) (ii) Water (potable as well as waste) (iii) Oil and gas (upstream as well as downstream like gasoline, fuel, crude oil, or propane), (iv) Food grade bulk liquids (like milk, or juice), (v) Rubber, (vi) Agrichemical products, among others. These goods are generally transported through tanker trucking.
- Fuel Price - Fuel price spikes can cause delays and diruption for logistics service providers (LSPs), while drops in the same can result in higher short-term profitability and increased market rivalry to offer consumers with the best deals. Hence, the fuel price variations have been studied over the review period and presented along with the causes as well as market impacts.
- Full-Truck-Load (FTL) Road Freight Transport - The segment captures the external (outsourced) logistics expenditure incurred by the road freight transport service end users on Full-Truck-Load (FTL) services. FTL road freight transport is characterized as a full single load not combined with other shipments. It comprises of shipments (i) devoted to the goods of a single shipper (ii) taken directly from a point of origin to one or more destination points (iii) comprising of bulk mail truck transportation (iv) comprising of both Container (Full Container Load, FCL)/Non-Container trucking services (v)comprsing of goods requiring temperature controlled or non-temperature controlled transportation services (vi) comprising of bulk liquid tankering (vii) invoving trucking of waste (viii) hazardous material trucking. Related value added services (VAS) of sorting, consolidation, deconslidation are included in the other services segment of freight and logistics market.
- GDP Distribution by Economic Activity - Nominal Gross Domestic Product and distribution of the same, across major economic sectors in the geography studied (country or region as per scope of the report) have been studied and presented in this industry trend. As GDP is positively related to the profitability and growth of logistics industry, this data has been used in adjunction to the input-output tables/ supply-use tables for analyzing the potential major contributing sectors towards the logistics demand.
- GDP Growth by Economic Activity - Growth of Nominal Gross Domestic Product across major economic sectors, for the geography studied (country or region as per scope of the report) have been presented in this industry trend. This data has been utilized for assessing the growth of logistics demand from all the market end users (economic sectors considered here).
- Inflation - Variations in both Wholesale Price Inflation (YoY change in producer price index) and Consumer Price Inflation have been presented in this industry trend. This data has been used to assess the inflationary environment as it plays a vital role in smooth functioning of the supply chain, directly impacting the logistics operational cost components e.g., pricing of tyres, driver wages & benefits, energy/fuel prices, maintenace costs, toll charges, warehousing rents, custom brokerage, forwarding rates, courier rates etc. hence impacting the overall freight and logistics market.
- Key Industry Trends - The report section named "Key Industry Trends" include all the key variables/parameters studied to better analyze the market size estimates and forecasts. All the trends have been presented in the form of data points (time series or latest available data points) along with analysis of the paramter in the form of concise market relevant commentary, for the geography studied (country or region as per the scope of report).
- Key Strategic Moves - The action taken by a company to differentiate from its competitor or used as a general strategy is referred to as a key strategic move (KSM). This includes (1) Agreements (2) Expansions (3) Financial Restructuring (4) Mergers and Acquisitions (5) Partnerships, and (6) Product Innovations. Key players (Logistics Service Providers, LSPs) in the market have been shortlisted, their KSM have been studied and presented in this section.
- Less than-Truck-Load (LTL) Road Freight Transport - The segment captures the external (outsourced) logistics expenditure incurred by the road freight transport service end users on Less than-Truck-Load (LTL) services. LTL road freight transport is characterized as multiple shipments combined onto a single truck for multiple deliveries within a network. It comprises of establishments (i) primarily engaged in general and specialized freight trucking of less than complete truck-loads, (ii) characterized by the use of terminals to consolidate shipments, generally from several shippers, into a single truck for haulage between a load assembly terminal and a disassembly terminal, where the load is sorted and shipments are re-routed for delivery (iv) Less than-Container-Load (LCL) shipping/ Groupage Shipping in case of trucking services. The activities in scope include (i) local pick-up, (ii) line-haul, and (iii) local delivery. Related value added services (VAS) of sorting, consolidation, deconslidation are included in the other services segment of freight and logistics market.
- Logistics Performance - Logistics Performance and Logistics Costs are the backbone of trade, and influences trade costs, making countries compete globally. Logistics performance is influenced by market wide adopted supply chain management strategies, government services, investments & policies, fuel/ energy costs, inflationary environment etc. Hence, in this industry trend, the logistics performance of the geography studied (country/ region as per the scope of report) has been analysed and presented over the review period.
- Major Truck Suppliers - Market share of truck brands is influenced by factors like geographical preferences, portfolio of truck types, truck prices, local production, truck repair & maintenance service peneteration, customer support, technological innovations (like electric vehicles, digitalization, autonomous trucks), fuel efficiency, financing options, annual maintenance costs, availability of substitutes, marketing startegies etc. Hence, the distribution (share % for base year of the study) of truck sales volume for leading truck brands and commentary on current market scenario & market anticipation over the forecast period have been presented in this industry trend.
- Manufacturing - This end user industry segment captures the external (outsourced) logistics expenditure incurred by the Manufacturing industry players, on road freight transport service. The end user players considered are the establishments primarily engaged in the chemical, mechanical or physical transformation of materials or substances into new products. Logistics Service Providers (LSPs) play a crucial role in maintaining a smooth flow of raw materials across the supply chain, enabling timely delivery of finished goods to distributors or end customers and storing & supplying the raw materials to clients for just-in-time manufacturing.
- Modal Share - Freight Modal Share is influenced by factors like modal productivity, government regulations, containerization, distance of shipment, temperature control requirements, type of goods, international trade, terrain, speed of delivery, shipment weight, bulk shipments, etc. Also, modal share by tonnage (tons) and modal share by freight turnover (ton-km) differ as per average distance of shipments, weight of major commodity groups transported in the economy and number of trips. This industry trend represents the distribution of freight transported by mode of transport (tons as well as ton-km), for the study base year.
- Oil and Gas, Mining and Quarrying - This end user industry segment captures the external (outsourced) logistics expenditure incurred by the extraction industry players, on road freight transport service. The end user players considered are the establishments that extract naturally occurring mineral solids, such as coal and ores; liquid minerals, such as crude petroleum; and gases, such as natural gas. Logistics Service Providers (LSPs) covers entire phases from upstream to downstream and plays a crucial role in the transportation of machinery, drilling equipments, extracted minerals, crude oil & natural gas and refined/ processed products from one place to another.
- Other End Users - Other end user segment captures the external (outsourced) logistics expenditure incurred by the financial services (BFSI), real estate, educational services, healthcare, and professional services (administrative, waste management, legal, architectural, engineering, design, consulting, scientific R&D), on road freight transport service. Logistics Service Providers (LSPs) plays a crucial role in the reliable movement of supplies and documents to/from these industries such as transporting any equipment or resources required, shipping confidential documents and files, movement of medical goods & supplies (surgical supplies and instruments, including gloves, masks, syringes, equipment) to name a few.
- Producer Price Inflation - It indicates inflation from viewpoint of the producers viz. the average selling price received for their output over a period of time. Annual change (YoY) of producer price index is reported as wholesale price inflation in the "Inflation" industry trend. As WPI captures dynamic price movements in most comprehensive way, it is widely used by governments, banks, industry, business circles and is deemed important in formulation of trade, fiscal and other economic policies. The data has been used in adjunction to consumer price inflation for better understanding the inflationary environment.
- Road Freight Pricing Trends - Freight pricing by mode of transport (USD/tonkm), over the review period, has been presented in this industry trend. The data has been used in assessing the inflationary environment, impact on trade, freight turnover (tonkm), road freight transport market demand and hence the road freight transport market size.
- Road Freight Tonnage Trends - Freight tonnage (weight of goods in tons) handled by mode of transport, over the review period, has been presented in this industry trend. The data has been used as one of the parameters apart from average distance per shipment (km), freight volume (tonkm), and freight pricing (USD/tonkm) to assess the freight transport market size.
- Road Freight Transport - Hiring a road freight transport logistics service provider (LSP) or haulier (outsourced logistics), for the transport of commodities constitutes road freight transport market. The scope of study includes (i) road transport of goods reported by hauliers registered in the reporting countries (ii) transport of raw materials or manufactured goods (solids as well as fluids) (iii) transport using commerical motor vehicles (rigid trucks or tractor-trailers, (iv) Full-Truck-Load (FTL) or Less than-Truck-Load (LTL) transport (v) containerized or non-containerized transport (vi) temperature controlled or non-temperature controlled trasnport, (vii) short haul or long haul (Over-the-road, OTR) transport, (viii) used office or household goods transport (movers and packers), (ix) other specialized cargo transport (dangerous goods, oversized cargo) and (x) outsourced first mile/ middle mile/last mile delivery shipments undertaken by road freight transport players. The scope does not include (i) transport undertaken by hauliers registered in other countries (ii) last mile meal delivery market (iii) grocery delivery market (iv) transportation via road network undertaken/ reported by Courier, Express, and Parcel (CEP) players.
- Road Length - As infrastructure plays a vital role in an economy's logistics performance, variables like length of roads, distribution of road length by surface category (paved v/s unpaved), distribution of road length by road classification (expressways v/s highways v/s other roads), have been analysed and presented in this industry trend.
- Segmental Revenue - Segmental Revenue has been triangulated or computed and presented for all the major players in the market. It refers to the road freight transport market specific revenue earned by the company, over the base year of study, in the geography studied (country or region as per the scope of report). It is computed through the study and analysis of major parameters like financials, service portfolio, employee strength, fleet size, investments, number of countries present in, major economies of concern, etc. that have been reported by the company in its annual reports, webpage. For companies having scarce financial disclosures, paid databases like D&B Hoovers, Dow Jones Factiva have been resorted to and verified through industry/expert interactions.
- Short Haul Road Freight Transport - The segment captures the external (outsourced) logistics expenditure incurred by the road freight transport service end users on local trucking (less than 100 miles). It includes the road transport of goods (i) within a single administrative area and its hinterland, (ii) by smaller trucks and pickup trucks (iii) via containerized as well as dry bulk services (iv) intermodal from ports, container terminals or airports, and (v) outsourced first mile/ last mile delivery shipments undertaken by road freight transport players.
- Transport and Storage Sector GDP - Value and growth of Transport and Storage Sector GDP has a direct relation to the freight and logistics market size, and hence road freight transport market size. Therefore, this variable has been studied and presented over the review period, in value terms (USD) and as share % of total GDP, in this industry trend. The data has been supported by concise and relevant commentary around the investments, developments, and current market scenario.
- Trends in E-Commerce Industry - Enhanced internet connectivity and boom in smartphone penetration, coupled with increasing disposable incomes, has led to a phenomenal growth in the e-commerce market globally. Online shoppers require fast and efficient delivery of their orders leading to an increase in the demand for logistics services especially e-commerce fulfilment services. Hence, the Gross Merchandise Value (GMV), historial and projected growth, breakup of major commodity groups in e-commerce industry for the studied geography (country or region as per scope of the report) have been analysed and presented in this industry trend.
- Trends in Manufacturing Industry - Manufacturing industry involves the transformation of raw materials into finished products, while logistics industry ensures the efficient flow of raw materials to the factory, and the transport of manufactured products to the distributors & consumers. Demand-Supply of both industries are highly cross-linked and critical for a seamless supply chain. Hence, the Gross Value Added (GVA), breakup of GVA into major manufacturing sectors, and growth of manufacturing industry over the review period have been analysed and presented, in this industry trend.
- Trucking Fleet Size By Type - Market share of truck types is influenced by factors like geographical preferences, major end user industries, truck prices, local production, truck repair & maintenance service peneteration, customer support, technological disruptions (like electric vehicles, digitalization, autonomous trucks) etc. Hence, the distribution (share % for base year of study) of truck parc volume by type of truck, market disruptors, truck manufacturing investments, truck specifications, truck use & import regulations, and market anticipation over the forecast period have been presented in this industry trend.
- Trucking Operational Costs - The prime reasons for measuring/ benchmarking logistics performance of any trucking company are to reduce operational costs and increase profitability. On the other hand, measuring operational costs helps to identify whether and where to make operational changes to control expenses and identify areas for improved performance. Hence, in this industry trend, trucking operational costs and the variables involved viz. driver wages & benefits, fuel prices, repairs & maintenance costs, tyre costs etc. have been studied over the base year of study, and presented for the geography studied (country or region as per the scope of report).
- Wholesale and Retail Trade - This end user industry segment captures the external (outsourced) logistics expenditure incurred by the wholesalers and retailers, on road freight transport service. The end user players considered are the establishments primarily engaged in wholesaling or retailing merchandise, generally without transformation, and rendering services incidental to the sale of merchandise. Logistics Service Providers (LSPs) plays a crucial role in the reliable movement of supplies to and finished products from production houses to the distributors and finally to the end customer covering activites like material sourcing, transportation, order fulfillment, warehousing & storage, demand forecasting, inventory management etc.
| Keyword | Definition |
|---|---|
| Cabotage | Road transport by a motor vehicle registered in a country performed on the national territory of another country. |
| Cross Docking | Cross docking is a logistics procedure where products from a supplier or manufacturing plant are distributed directly to a customer or retail chain with marginal to no handling or storage time. Cross docking takes place in a distribution docking terminal; usually consisting of trucks and dock doors on two (inbound and outbound) sides with minimal storage space. The name ‘cross docking’ explains the process of receiving products through an inbound dock and then transferring them across the dock to the outbound transportation dock. |
| Cross Trade | International road transport between two different countries performed by a road motor vehicle registered in a third country. A third country is a country other than the country of loading/embarkation and than the country of unloading/disembarkation. |
| Dangerous Goods | The classes of dangerous goods carried by Road are those defined by the fifteenth revised edition of the UN Recommendations on the Transport of Dangerous Goods, United Nations, Geneva 2007. They include Class 1: Explosives; Class 2: Gases; Class 3: Flammable Liquids; Class 4: Flammable solids- substances liable to spontaneous combustion; substances which, on contact with water, emit flammable gases; Class 5: Oxidizing substances and organic peroxides; Class 6: Toxic and infectious substances; Class 7: Radioactive material and Class 8: Corrosive substances, Class 9: Miscellaneous dangerous substances and articles. |
| Direct Shipment | Direct shipment is a method of delivering goods from the supplier or the product owner to the customer directly. In most cases, the customer orders the goods from the product owner. This delivery scheme reduces transportation and storage costs, but requires additional planning and administration. |
| Drayage | A drayage is a form of trucking service that connects the different modes of shipping (intermodal), such as ocean freight or air freight. It’s a short-haul trip that transports goods from one place to another, usually before or after its long-haul shipping process. Drayage trucks move cargo to and from various destinations, such as container ships, storage lots, order fulfillment warehouses, and rail yards. Typically, drayage only transports goods in short distances and operates only in one metropolitan area. It also requires only one trucker in a single shift. But despite this, but it plays an important role in long-haul shipping because it gets the goods to the cargo and vice versa. It makes intermodal transport much more efficient and enables the seamless transfer of goods to the end customer. |
| Dry van | A dry van is a type of semi-trailer that's fully enclosed to protect shipments from outside elements. Designed to carry palletized, boxed or loose freight, dry vans aren't temperature-controlled (unlike refrigerated “reefer” units) and can't carry oversized shipments (unlike flatbed trailers). |
| Final Demand | Final demand includes all types of commodities (goods as well as services) consumed as final use and might include personal consumption, or consumption by government, by businesses as capital investment, and as exports. includes all types of commodities (goods as well as services) consumed as final use and might include personal consumption, or consumption by government, by businesses as capital investment, and as exports. |
| Flatbed Truck | A flatbed truck is a type of truck with rigid design. It has a back body that is flatly shaped for easy loading and unloading of goods. The flatbed truck is mostly used to transport heavy, oversized, wide and indelicate goods such as machinery, building supplies or equipment. Due to the truck open body, the goods transported with it must not be vulnerable to rain. By functionality, the flatbed truck is comparable to a flatbed trailer. |
| Inbound Logistics | Inbound logistics is the way materials and other goods are brought into a company. This process includes the steps to order, receive, store, transport and manage incoming supplies. Inbound logistics focuses on the supply part of the supply-demand equation. |
| Intermediate Demand | Intermediate demand includes goods, services, and maintenance and repair construction sold to businesses, excluding capital investment. |
| International Loaded | Place of loading of goods in reporting country (i.e., country in which the vehicle performing the transport is registered) and place of unloading in a different country. |
| International Unloaded | Place of unloading of goods in reporting country (i.e., country in which the vehicle performing the transport is registered) and place of loading in a different country. |
| OOG cargo | Out of Gauge (OOG) cargo is any cargo that can not be loaded into six-sided shipping containers simply because it is too large. The term is a very loose classification of all cargo with dimensions beyond the maximum 40HC container dimensions. That is a length beyond 12.05 meters – a width beyond 2.33 meters – or a height beyond 2.59 meters. |
| Pallets | Raised platform, intended to facilitate the lifting and stacking of goods. |
| Part load | A part load describes goods which only fills a truck partially. In essence, the quantity of the shipment is bigger than the Less Than Truckload (LTL) shipment. Also, the shipment cannot fully occupy a truck i.e. its capacity is much lower than a Full Truckload (FTL) shipment. |
| Paved Road | Road surfaced with crushed stone (macadam) with hydrocarbon binder or bituminized agents, with concrete or with cobblestone. |
| Reverse Logistics | Reverse logistics comprises of the sector of supply chains that process anything returning inwards through the supply chain or traveling ‘backward’ through the supply chain. |
| Road Freight Transport Service | Hiring a trucking agency for transport of commodities (raw materials or manufactured goods including both solids and liquids) form the origin to a destination within the country (domestic) or cross-border (international) constitutes road freight transport market. The service might be Full-Truck-Load or Less than-Truck-Load, containerized or non-containerized, temperature controlled or non temperature controlled, short haul or long haul. |
| Tautliner vehicle | Tautliner and curtainsider are used as generic names for curtain sided trucks/trailers. The curtains are permanently fixed to a runner at the top and detachable rails/poles at front and rear, allowing the curtains to be drawn open and forklifts used all along the sides for easy and efficient loading and unloading. When closed for travel, vertical load restraint straps are attached to a rope rail beneath the truck bed, connecting the truck bed and curtain along both sides. Winches at either end of the curtain tension it, hence the 'Tautliner' name. This stops the curtain from flapping or drumming in the wind and can also help retain light loads from slipping sideways. |
| Transport for hire or reward | The carriage for remuneration of goods. |
| Unpaved Road | Road with a stabilized base not surfaced with crushed stone, hydrocarbon binder or bituminized agents, concrete or cobblestone. |


Research Methodology
Mordor Intelligence follows a four-step methodology in all our reports.
- Step-1: Identify Key Variables: In order to build a robust forecasting methodology, the variables and factors identified in Step-1 are tested against available historical market numbers. Through an iterative process, the variables required for market forecast are set and the model is built on the basis of these variables.
- Step-2: Build a Market Model: Market-size estimations for the forecast years are in nominal terms. Inflation is considered to be a part of the pricing, and the average selling price (ASP) is varying throughout the forecast period for each country
- Step-3: Validate and Finalize: In this important step, all market numbers, variables and analyst calls are validated through an extensive network of primary research experts from the market studied. The respondents are selected across levels and functions to generate a holistic picture of the market studied.
- Step-4: Research Outputs: Syndicated Reports, Custom Consulting Assignments, Databases & Subscription Platforms


