Market Overview
| Study Period | 2018 - 2031 |
|---|---|
| Forecast Data Period | 2026 - 2031 |
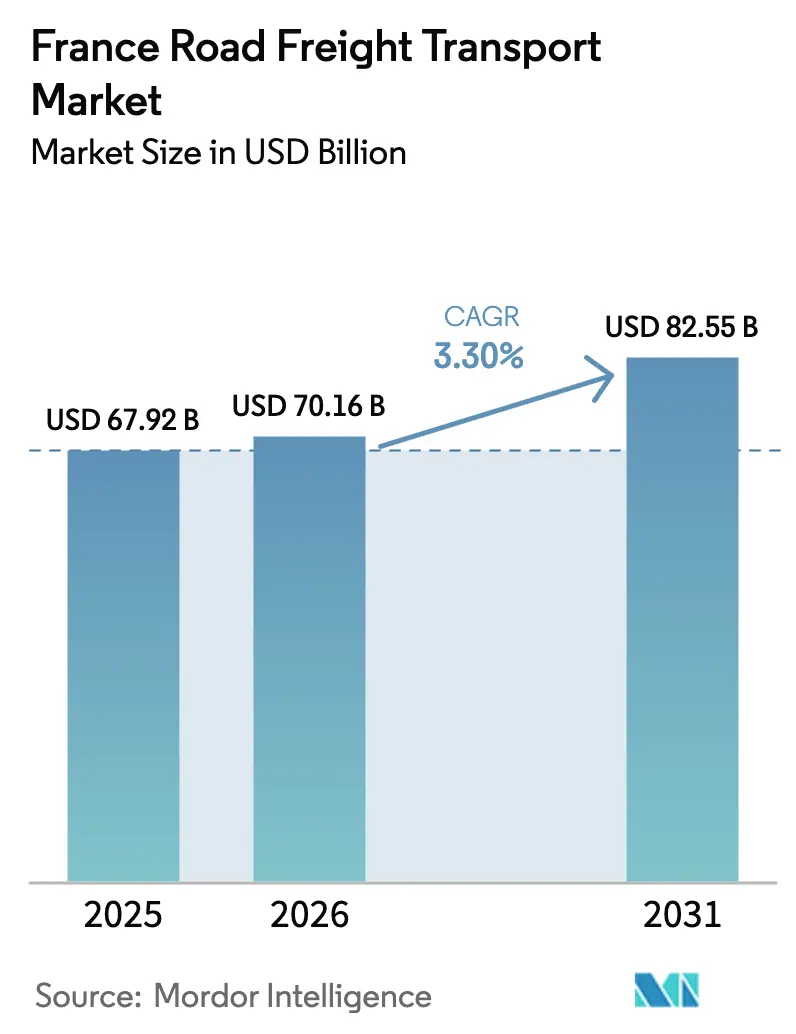
| Base Year Market Size (2025) | USD 67.92 Billion |
| Market Size (2026) | USD 70.16 Billion |
| Market Size (2031) | USD 82.55 Billion |
| Growth Rate (2026 - 2031) | 3.30% CAGR |
| Market Concentration | Low |
Major Players *Disclaimer: Major Players sorted in no particular order Image © Mordor Intelligence. Reuse requires attribution under CC BY 4.0. | |
France Road Freight Transport Market Analysis by Mordor Intelligence
The France road freight transport market size was valued at USD 67.92 billion in 2025 and estimated to grow from USD 70.16 billion in 2026 to reach USD 82.55 billion by 2031, at a CAGR of 3.30% during the forecast period (2026-2031). Surging e-commerce parcel volumes, government support for alternative-fuel fleets, and selective toll-road capacity upgrades are propelling growth even as driver shortages and new CO₂-indexed charges erode operating margins. A national parcel throughput of 1.7 billion consignments, sharp growth in temperature-controlled grocery flows, and rapid scaling of AI-based load-matching platforms are reshaping shipment profiles toward smaller, more frequent loads carried over dense domestic corridors. At the same time, long-haul efficiency initiatives such as dynamic routing around seasonal alpine truck bans and hydrogen-retrofit pilots on core A6 and A31 corridors are lowering empty-mile ratios. Larger carriers able to amortize compliance investments across diversified networks retain pricing power, while mid-tier operators face consolidation pressure from the EUR 14.3 billion (USD 15.78 billion) DSV–DB Schenker tie-up.
Key Report Takeaways
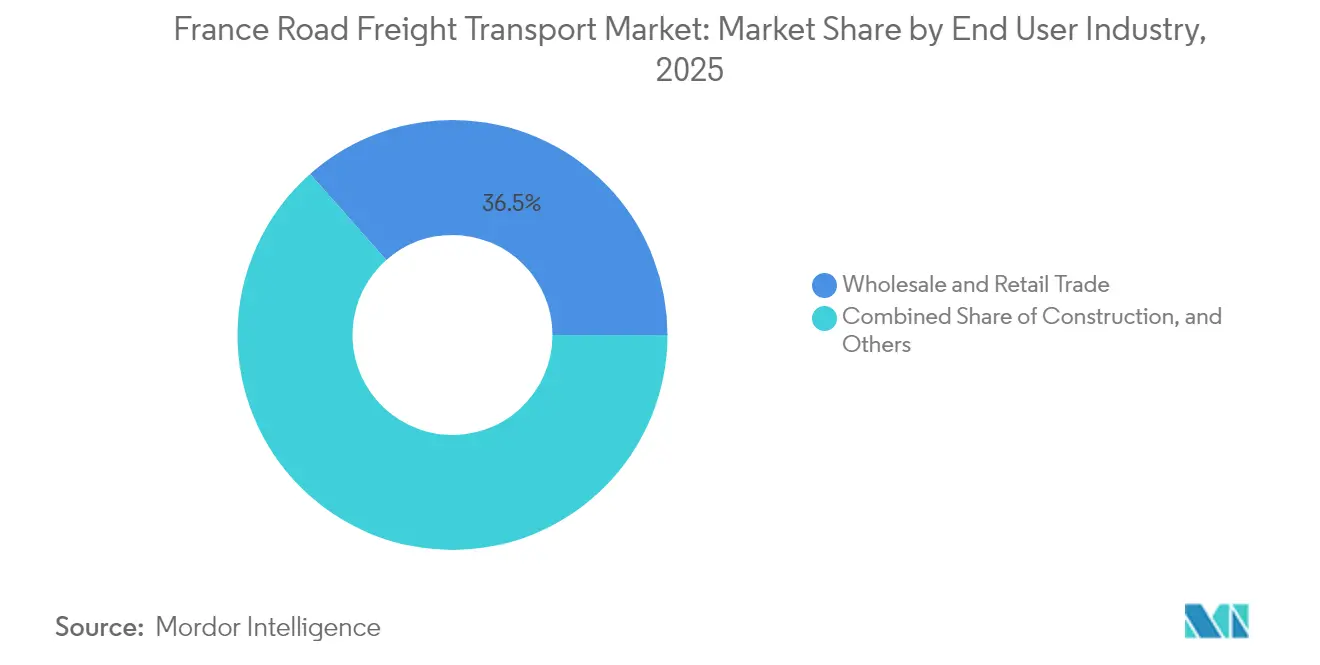
- By end user industry, wholesale and retail trade held 36.52% of the France road freight transport market share in 2025; the same segment is projected to post the fastest expansion at a 3.72% CAGR between 2026-2031.
- By destination, domestic services commanded a 63.62% share of the France road freight transport market size in 2025, whereas international flows are forecast to progress at a 3.78% CAGR between 2026-2031.
- By truckload specification, full-truck-load operations led with 81.35% of the revenue share in 2025, while less than-truck-load is advancing at a 3.61% CAGR between 2026-2031.
- By containerization, non-containerized freight represented 88.40% of the revenue share in 2025; containerized cargo is set to climb at a 3.33% CAGR between 2026-2031.
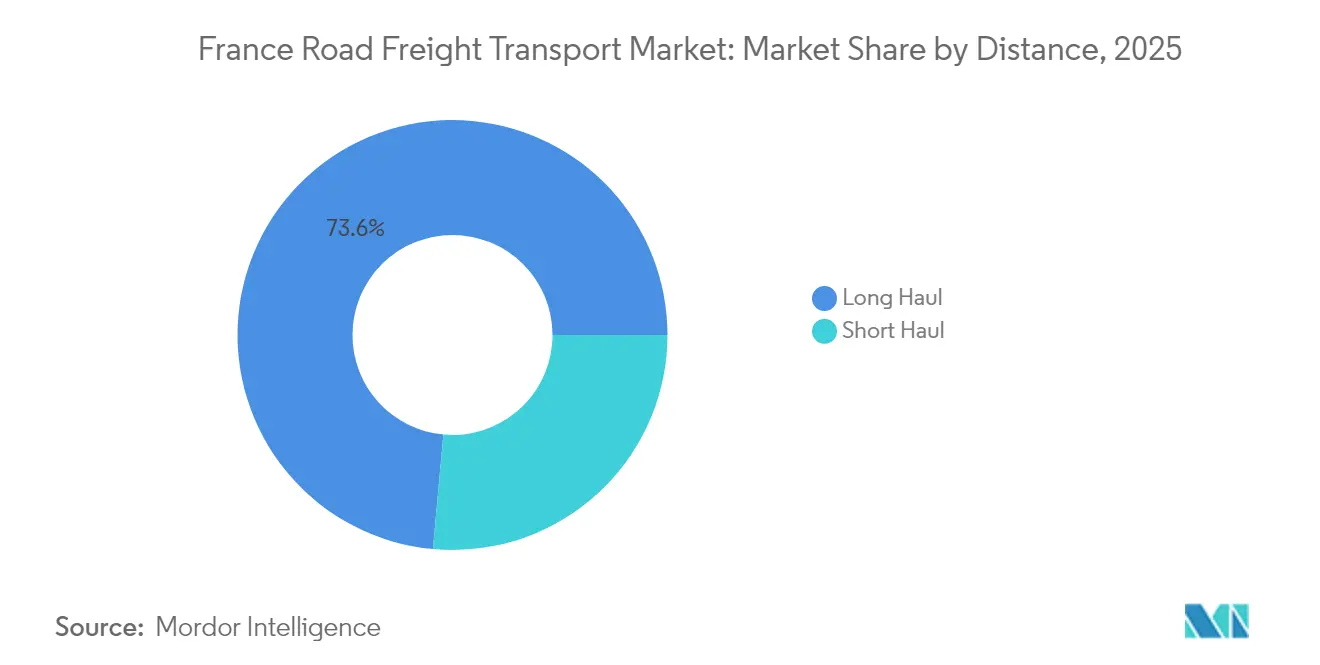
- By distance, long-haul moves accounted for 73.55% of the revenue share in 2025 and are growing at a 3.39% CAGR between 2026-2031.
- By goods configuration, solid goods captured 75.08% of the revenue share in 2025, whereas fluid goods are forecast to rise by 3.52% CAGR between 2026-2031.
- By temperature control, non-temperature controlled traffic dominated with 94.12% share in 2025, yet temperature controlled flows are on track for a 3.56% CAGR between 2026-2031.
Note: Market size and forecast figures in this report are generated using Mordor Intelligence’s proprietary estimation framework, updated with the latest available data and insights as of 2026.
France Road Freight Transport Market Trends and Insights
Drivers Impact Analysis*
| Driver | (~) % Impact on CAGR Forecast | Geographic Relevance | Impact Timeline |
|---|---|---|---|
| Surging E-commerce parcel volumes | +0.8 % | National, concentrated in Ile-de-France and other large metros | Medium term (2-4 years) |
| Accelerated fleet electrification incentives | +0.6 % | Nationwide, with early uptake inside 42 low-emission zones | Long term (≥ 4 years) |
| Government toll-road PPP renewals boosting capacity | +0.4 % | Core motorway corridors A6, A31, A1 | Short term (≤ 2 years) |
| Hydrogen-truck retrofit pilots scaling | +0.3 % | Auvergne-Rhone-Alpes and main trunk routes | Long term (≥ 4 years) |
| Boom in chilled and frozen food demand lifting temperature-controlled mileage | +0.3 % | National, clustered around food production hubs | Medium term (2-4 years) |
| AI-based dynamic load matching | +0.2 % | National, densest uptake on high-volume lanes | Medium term (2-4 years) |
| Source: Mordor Intelligence | |||


Surging E-commerce Parcel Volumes
La Poste Groupe, which dominates the French parcel market, delivered 2.62 billion parcels in 2024, marking a 2.7% year-on-year increase. This includes 2.13 billion parcels by Geopost globally and 487 million parcels by Colissimo in France's B2C segment. Newly opened 27,000 m² parcel hubs are raising truck fill factors by 30 % and trimming truck movements by a similar margin, cutting CO₂ per parcel while freeing scarce drivers for higher-value hauls. The tightening of Crit’Air 3 access in 42 low-emission zones from 2025 forces retailers to integrate urban consolidation centers or risk missed delivery windows. Algorithmic platforms such as Chronotruck claim 97 % match rates for spot loads, allowing micro-fleets to participate in e-commerce flows that once favored asset-heavy integrators[1]“Crit’Air Low-Emission Zone Updates,” L’Agence Nationale de la Sécurité des Messages, service-public.fr.
Accelerated Fleet Electrification Incentives
A EUR 100 million (USD 110.36 million) state package launched in 2023 set aside EUR 55 million (USD 60.70 million) for heavy-duty electric truck purchases and EUR 40 million (USD 44.14 million) for local manufacturing, catalyzing more than 500 vehicle orders. XPO alone has deployed 100 battery trucks and 80 chargers to secure delivery slots inside metropolitan ZFEs. Subsidized hydrogen at EUR 4 kg for 15 years, paired with a 6.5 GW national electrolysis goal, signals long-run commitment to zero-carbon long-haul operations. A France 2030-funded inductive charging test on the A10 near Saint-Arnoult aims to slash onboard battery weight and total cost of ownership, a breakthrough that could tilt replacement cycles in favor of e-trucks by 2028. Early movers enjoy privileged city-center access and first-mover branding advantages, while laggards face rising Crit’Air fines and escalating per-km toll surcharges[2]“National Hydrogen Strategy,” Gouvernement de la République Française, gouvernement.fr.
Government Toll-Road PPP Renewals Boosting Capacity
The 0.92 % average toll hike enacted February 2025 marked the first step toward CO₂-indexed pricing that differentiates fees by vehicle emissions class. Concession renewals are funding lane extensions and free-flow gantries on A6, A31 and A1, cutting queuing times and lowering idling emissions. Electronic tolling also delivers granular trip data, enabling carriers to optimize schedules around peak restrictions such as the Saturday bans on A6 and A31 during July–August holiday peaks. Larger operators equipped with proprietary route algorithms monetize the new capacity by accepting time-sensitive slots that smaller fleets cannot service under tighter driver-hour ceilings. However, the same CO₂ index raises variable costs for older Euro VI diesel units, widening the cost gap between fleet tiers.
Hydrogen-Truck Retrofit Pilots Scaling
ADEME grants and private alliances are converting existing 44-ton rigs to fuel-cell powertrains at depots in Auvergne-Rhône-Alpes, supported by regional refueling stations from Lhyfe and Hyliko. Retrofit economics appeal to mid-life tractors facing ZFE bans yet retaining residual chassis value, allowing operators to stagger capex rather than replace entire fleets. The EUR 8.2 billion (USD 9.04 billion) national hydrogen plan targets 100 stations and 1,000 heavy vehicles by 2027, a network density that would knit together Lyon, Paris and Marseille trade axes. Early adopters are negotiating green-lane exemptions on Crit’Air corridors, gaining delivery certainty at high-density urban docks. If scale materializes, hydrogen could complement battery trucks on 700 km legs where charging breaks are commercially unviable.
Restraints Impact Analysis*
| Restraint | (~) % Impact on CAGR Forecast | Geographic Relevance | Impact Timeline |
|---|---|---|---|
| Acute driver shortage and aging workforce | −0.9 % | Nationwide, most acute in Ile-de-France | Short term (≤ 2 years) |
| CO₂-indexed toll surcharges from 2025 | −0.4 % | National motorway network | Medium term (2-4 years) |
| Seasonal alpine and ZFE truck-access bans | −0.3 % | Alpine corridors and 42 low-emission zones | Short term (≤ 2 years) |
| New aggressive rail-freight shift policy siphoning long-haul road volumes | −0.2 % | Major container and bulk corridors | Long term (≥ 4 years) |
| Source: Mordor Intelligence | |||
Acute Driver Shortage and Ageing Workforce
Transport Intelligence projects unfilled cab positions could surpass 60% by 2026, compressing available capacity even as freight demand climbs. Insolvencies in the transport-storage sector spiked 13% in 2024, wiping out roughly 900 carriers and stranding book-of-business volumes at short notice. Intercity haulers were hit hardest with an 18 % bankruptcy surge, illustrating how length-of-haul amplifies exposure to recruitment gaps. Driver demographics aggravate the crunch: the average French trucker is 53 years old, and replacements drawn from younger cohorts fall short of retirements. Digital marketplaces marginally soften the blow by reducing empty legs, yet automation timelines for SAE Level 4 trucks remain beyond 2030, leaving a structural labor deficit. Higher wages and signing bonuses lift cost inflation above retail indexation clauses, squeezing mid-tier margins[3]“France implements CO₂-indexed tolls,” Trans.info SIA, trans.info.
CO₂-Indexed Toll Surcharges from 2025
From February 2025, motorway invoices incorporate emissions multipliers that add variable charges of up to EUR 0.04 (USD 0.044) km for Euro VI diesel tractors traversing core north–south corridors. The surcharges accumulate alongside urban Crit’Air fines, raising per-trip costs on lanes feeding 42 ZFE cities. Smaller fleets limited to pre-2019 equipment face a double penalty: higher tolls and urban exclusion. Larger carriers amortize newer tractors across high-frequency contracts and can pass surcharges through index-linked fuel clauses, reinforcing consolidation trends. Over time, transparent CO₂ pricing data encourages shippers to ask for emissions scorecards, rewarding carriers with greener fleets and accelerating diesel retirement schedules[4]“2024 Transport Company Failures,” Batinfo SARL, batinfo.com.
*Our forecasts treat driver/restraint impacts as directional, not additive. The impact forecasts reflect baseline growth, mix effects, and variable interactions.
Segment Analysis
By End User Industry: Wholesale Trade Drives Market Leadership
Wholesale and retail trade contributed 36.52% of 2025 freight turnover and continues to expand at a 3.72% CAGR (2026-2031) as omnichannel merchants reposition inventory closer to consumers. This sub-segment orchestrates high-velocity pallet flows between regional cross-docks, benefitting carriers that can guarantee late cut-offs and next-day store delivery. Manufacturers represent the second-largest demand pool, underpinning baseline volumes even during consumer slowdowns. Construction-related freight has stabilized after pandemic fluctuations, while Oil, Gas, Mining and Quarrying remain subdued amid decarbonization targets.
Competitive intensity inside Wholesale and Retail remains high but rewards differentiated service. Carriers offering integrated returns management and e-commerce parcel injection capture a larger share of split-case consignments, raising revenue density per trip. ZFE restrictions prompt wholesalers to outsource city-center drops to asset-light micro-fleet partners. Importantly, the France road freight transport market size tied to this end-user cohort is projected to exceed USD 30.86 billion by 2031, underscoring its pivotal role in network planning. The France road freight transport market share occupied by Wholesale and Retail is therefore set to remain structurally elevated even if growth moderates later in the decade.


By Destination: Domestic Dominance with International Growth Momentum
Domestic carriage made up 63.62% of 2025 turnover and still underpins the bulk of contract lanes, particularly within the Paris–Lyon–Marseille triangle. Low-emission zone protocols, however, have raised compliance investment thresholds, pushing small suburban fleets toward alliances with national 3PLs. Inbound parcel volumes from coastal ports further amplify domestic shuttling between de-consolidation centers and urban sortation facilities.
International freight, though smaller, is scaling faster at 3.78% CAGR (2026-2031) as cross-border e-commerce and near-shoring stimulate Franco-German and Franco-Italian corridors. The France road freight transport market size allocated to international routes is projected to surpass USD 30.92 billion by 2031, propelled by the Schengen area’s frictionless customs processes and pan-EU return flows. New ICS-2 customs messaging and replacement tachographs add paperwork but have not deterred shippers seeking quick lead times that maritime or rail cannot match on sub-1,000 km runs.
By Truckload Specification: FTL Maintains Dominance Despite LTL Growth
Full-Truck-Load retained 81.35% revenue in 2025 owing to economies of density on high-volume lanes such as Dunkirk–Lyon and Calais–Barcelona. Dedicated rigs minimize handling damage and cut dwell time at docks, a critical asset during persistent labor shortages. However, Less-than-Truck-Load is advancing at 3.61% CAGR (2026-2031) as SMEs embrace direct-to-consumer shipping profiles.
Network operators are cascading hub upgrades—Rhenus’ Groupage Network 2.0 shaved 34 % off trunk transit windows—to defend margins. AI dispatch modules now assemble multi-stop tours in seconds, compressing order-to-dock intervals for low-pallet counts. While FTL will stay predominant, its share edges down post-2027 as e-grocery, micro-fulfillment and reverse-logistics volumes swell the LTL book.
By Containerization: Non-Containerized Freight Dominates Traditional Networks
Non-Containerized cargo represented 88.40% of 2025 flows, anchored by palletized FMCG, DIY supplies and bulk construction materials shipped on standard curtainsiders. The operational simplicity of dock-to-dock loading offsets the absence of intermodal options. Containerized road moves, tied to seaport drayage and rail ramp positioning, are growing at a 3.33 % clip as SNCF pours EUR 1.1 billion (USD 1.2 billion) into combined-transport terminals.
Shippers balancing decarbonization aims with inventory agility are booking more 45-foot pallet-wide boxes that transition smoothly from rail to short-haul trucks. Yet capacity constraints at inland depots and limited return loads cap broader adoption. Over the forecast span, container penetration inches upward but will not displace the entrenched role of tautliners in regional distribution.
By Distance: Long Haul Maintains Market Leadership
Long-Haul trips exceeding 300 km held 73.55% of 2025 turnover and are expected to sustain a 3.39% CAGR between 2026-2031. Through-running rigs exploit motorway upgrades and night-driving slots to maximize tractor-trailer utilization. CO₂-indexed tolls lift costs but can be diluted across greater payload-kilometers. Seasonal Saturday bans on alpine feeders challenge schedule integrity, spurring carriers to pre-stage freight at regional break-bulks by Friday evening.
Short-Haul services, although smaller, enjoy protective demand from e-commerce replenishment hops between suburban sort centers and city micro-hubs. The France road freight transport market size associated with sub-150 km legs edges up as retailers shorten replenishment cycles to 24 hours or less. Nonetheless, cost inflation from urban emissions rules squeezes margins unless fleets pivot toward light-duty EV vans or e-rigids that circumvent Crit’Air 3 exclusions.
By Goods Configuration: Solid Goods Lead Market Composition
Solid Goods spanning packaged consumer products, fabricated metals and white goods—captured 75.08% revenue in 2025. Standardized load units allow drop-and-swap trailer operations that mitigate driver hour constraints. Growth plateaus toward 2028 as near-shoring moderates import flows, yet parcelization offers incremental upside.
Fluid Goods, chiefly chemicals and fuels, climb at 3.52% CAGR (2026-2031) underpinned by steady petrochemical plant outputs and stringent ADR handling rules that deter new entrants. Dedicated tanker investments shield incumbents from price erosion and ensure stable backhaul volumes. Hybrid powertrain development for rigid tankers promises compliance with ZFE caps without compromising pump performance at customer sites.
By Temperature Control: Non-Temperature Controlled Dominates Market Volume
Non-Temperature-Controlled consignments generated 94.12% turnover in 2025, but face structural commoditization as digital brokers compress spot-linehaul margins. Carriers compete largely on cost and network density, limiting differentiation.
Temperature-Controlled traffic, while only 5.88% by value, enjoys robust 3.56% CAGR (2026-2031) as chilled groceries, specialty biologics and frozen meal kits proliferate. Market leader STEF cleared EUR 4.8 billion (USD 5.29 billion) revenue by layering value-added services such as validated GDP pharmaceutical chains. Continuous refrigeration imposes high energy loads, but subsidies for trailer-roof solar assist units and depot-based shore power reduce diesel genset hours, lowering both emissions and operating cost.
Geography Analysis
France’s domestic road lattice remains the workhorse of national distribution. High-density corridors radiating from Île-de-France move everything from grocery staples to white-label apparel on same-day loops. Crit’Air regulations now prevent Euro V tractors from entering 42 urban ZFEs, accelerating replacement cycles or outsourcing to compliant subcontractors. Freight networks increasingly employ ring-road cross-docks where electric rigids handle the final 20 km, insulating trunk fleets from urban penalties and preserving turnaround times.
Cross-border lanes register faster incremental growth. Franco-German automotive parts shuttles capitalize on synchronized just-in-sequence production schedules, while France–Italy food flows exploit relaxed SPS formalities under EU regulation. DSV’s absorption of DB Schenker widens its route card to 40,000 daily European departures, squeezing smaller forwarders on rates but improving service reliability for shippers. Regulatory overhead ticks higher as ICS-2 Phase 3 entry rules and smart tachograph v2 mandates add data-exchange requirements that medium fleets struggle to automate.
Seasonal alpine and holiday traffic bans exert pronounced regional effects. The Winter Road Plan bars >7.5-ton units on valley ascents during select February weekends, forcing pre-loading and buffer warehousing around Grenoble and Chambéry. In summer, Saturday curfews on A6, A31 and A1 push linehauls toward night slots or Sunday reopenings, knitting atypical bimodal schedules that test driver availability. Carriers with dual-licence French-Italian drivers mitigate friction at Mont Blanc and Fréjus tunnels, an edge likely to endure until automated convoys clear regulatory hurdles after 2030.
Competitive Landscape
The France road freight transport market is consolidating yet remains fragmented. The top five groups DSV, CMA CGM Group, Geodis, STEF and Dachser jointly control significant share of domestic revenue, leaving room for entrepreneurial specialists in niches such as bulk ADR and e-grocery final-mile. DSV’s April 2025 absorption of DB Schenker vaulted it into pole position on European transit lanes and added depot density in Lyon, Lille and Bordeaux.
Technology adoption defines competitive edges. Chronotruck’s 97% load-match rate lowers empty miles for micro-fleets, generating up to 1 % gross-margin uplift versus manual brokerage. Rhenus counters with hub-and-spoke re-designs that trim transit by one-third, capturing high-value B2B pallet contracts. Electric-fleet pioneers such as XPO market guaranteed ZFE access windows, a USP that secures preferred supplier status for multi-national retailers bound by ESG scorecards.
Barriers to entry rise as CO₂-indexed tolls bite; older-unit fleets see 3-4 percentage-point margin erosion absent equipment renewal. Driver recruitment differentiates carriers able to underwrite in-house academies versus brokers reliant on subcontractors. The France road freight transport industry therefore rewards capital strength, digital capability and emissions compliance traits more common to scale players suggesting ongoing M&A among regional haulers unable to self-fund transition technologies.
France Road Freight Transport Industry Leaders
CMA CGM Group (Including CEVA Logistics)
DACHSER
STEF Group
DSV A/S (Including DB Schenker)
GEODIS
- *Disclaimer: Major Players sorted in no particular order

Recent Industry Developments
- April 2025: DSV closed its EUR 14.3 billion (USD 15.78 billion) purchase of DB Schenker, combining networks that now post EUR 39 billion (USD 43.04 billion) annual sales.
- April 2025: CEVA Logistics announced plans to enhance pharmaceutical logistics with a 17,000 m² warehouse at Strasbourg-Entzheim Airport Business Park, operational by early 2026.
- September 2024: Rhenus debuted Groupage Network 2.0, citing 34% faster pallet transit after a hub cascade centered on Hilden.
- January 2024: XPO earmarked 100 electric tractors and 80 charging points for French depots to secure low-emission-zone access.


France Road Freight Transport Market Report Scope
Agriculture, Fishing, and Forestry, Construction, Manufacturing, Oil and Gas, Mining and Quarrying, Wholesale and Retail Trade, Others are covered as segments by End User Industry. Domestic, International are covered as segments by Destination. Full-Truck-Load (FTL), Less than-Truck-Load (LTL) are covered as segments by Truckload Specification. Containerized, Non-Containerized are covered as segments by Containerization. Long Haul, Short Haul are covered as segments by Distance. Fluid Goods, Solid Goods are covered as segments by Goods Configuration. Non-Temperature Controlled, Temperature Controlled are covered as segments by Temperature Control.End User Industry
| Agriculture, Fishing, and Forestry |
| Construction |
| Manufacturing |
| Oil and Gas, Mining and Quarrying |
| Wholesale and Retail Trade |
| Others |
Destination
| Domestic |
| International |
Truckload Specification
| Full-Truck-Load (FTL) |
| Less than-Truck-Load (LTL) |
Containerization
| Containerized |
| Non-Containerized |
Distance
| Long Haul |
| Short Haul |
Goods Configuration
| Fluid Goods |
| Solid Goods |
Temperature Control
| Non-Temperature Controlled |
| Temperature Controlled |
| End User Industry | Agriculture, Fishing, and Forestry |
| Construction | |
| Manufacturing | |
| Oil and Gas, Mining and Quarrying | |
| Wholesale and Retail Trade | |
| Others | |
| Destination | Domestic |
| International | |
| Truckload Specification | Full-Truck-Load (FTL) |
| Less than-Truck-Load (LTL) | |
| Containerization | Containerized |
| Non-Containerized | |
| Distance | Long Haul |
| Short Haul | |
| Goods Configuration | Fluid Goods |
| Solid Goods | |
| Temperature Control | Non-Temperature Controlled |
| Temperature Controlled |


Market Definition
- Agriculture, Fishing, and Forestry (AFF) - This end user industry segment captures the external (outsourced) logistics expenditure incurred by the AFF industry players on road freight transport service. The end user players considered are the establishments primarily engaged in growing crops, raising animals, harvesting timber, harvesting fish & other animals from their natural habitats and providing related support activities. Herein, across the value chain, Logistics Service Providers (LSPs) play a crucial role in acquisition, storage, handling, transportation, and distribution activities for the optimal & continuous flow of inputs (seeds, pesticides, fertilizers, equipment, and water) from manufacturers or suppliers to the producers and smooth flow of output (produce, agro-goods) to distributors/ consumers. This includes both termperature controlled and non-temperature controlled logistics, as and when required according to the shelf life of goods being transported or stored.
- Construction - This end user industry segment captures the external (outsourced) logistics expenditure incurred by the construction industry players, on road freight transport service. The end user players considered are the establishments primarily engaged in constructing, repairing and renovating residential & commercial buildings, infrastructure, engineering works, subdividing and developing land. Logistics Service Providers (LSPs) play a crucial role in increasing profitability of construction projects by maintaing the inventory of raw materials & equipment, time-critical supplies and by providing other value added services for effective project management.
- Containerized Road Freight Transport - The segment captures the external (outsourced) logistics expenditure incurred by the road freight transport service end users on Full-Truck-Load (FTL) services. FTL road freight transport is characterized as a full single load not combined with other shipments. It comprises of shipments (i) devoted to the goods of a single shipper (ii) taken directly from a point of origin to one or more destination points (iii) comprising of bulk mail truck transportation (iv) comprising of both Container (Full Container Load, FCL)/Non-Container trucking services (v)comprsing of goods requiring temperature controlled or non-temperature controlled transportation services (vi) comprising of bulk liquid tankering (vii) invoving trucking of waste (viii) hazardous material trucking. Related value added services (VAS) of sorting, consolidation, deconslidation are included in the other services segment of freight and logistics market.
- Export Trends and Import Trends - Overall logistics performance of an economy is positively and significantly (statistically) correlated to its trade performance (exports and imports). Hence, in this industry trend, total value of trade, major commodities/ commodity groups and the major trade partners, for the studied geography (country or region as per the scope of report) have been analysed alongside the impact of major trade/logistics infrastructure investments & regulatory environment.
- Fluid Goods - The segment captures the external (outsourced) logistics expenditure incurred by the road freight transport service end users for the transport of bulk liquids, that are often used in extraction, manufacturing, food processing, agriculture industries among others. It includes transportation of liquids like (i) Chemicals/ hazardous goods (for instance acids) (ii) Water (potable as well as waste) (iii) Oil and gas (upstream as well as downstream like gasoline, fuel, crude oil, or propane), (iv) Food grade bulk liquids (like milk, or juice), (v) Rubber, (vi) Agrichemical products, among others. These goods are generally transported through tanker trucking.
- Fuel Price - Fuel price spikes can cause delays and diruption for logistics service providers (LSPs), while drops in the same can result in higher short-term profitability and increased market rivalry to offer consumers with the best deals. Hence, the fuel price variations have been studied over the review period and presented along with the causes as well as market impacts.
- Full-Truck-Load (FTL) Road Freight Transport - The segment captures the external (outsourced) logistics expenditure incurred by the road freight transport service end users on Full-Truck-Load (FTL) services. FTL road freight transport is characterized as a full single load not combined with other shipments. It comprises of shipments (i) devoted to the goods of a single shipper (ii) taken directly from a point of origin to one or more destination points (iii) comprising of bulk mail truck transportation (iv) comprising of both Container (Full Container Load, FCL)/Non-Container trucking services (v)comprsing of goods requiring temperature controlled or non-temperature controlled transportation services (vi) comprising of bulk liquid tankering (vii) invoving trucking of waste (viii) hazardous material trucking. Related value added services (VAS) of sorting, consolidation, deconslidation are included in the other services segment of freight and logistics market.
- GDP Distribution by Economic Activity - Nominal Gross Domestic Product and distribution of the same, across major economic sectors in the geography studied (country or region as per scope of the report) have been studied and presented in this industry trend. As GDP is positively related to the profitability and growth of logistics industry, this data has been used in adjunction to the input-output tables/ supply-use tables for analyzing the potential major contributing sectors towards the logistics demand.
- GDP Growth by Economic Activity - Growth of Nominal Gross Domestic Product across major economic sectors, for the geography studied (country or region as per scope of the report) have been presented in this industry trend. This data has been utilized for assessing the growth of logistics demand from all the market end users (economic sectors considered here).
- Inflation - Variations in both Wholesale Price Inflation (YoY change in producer price index) and Consumer Price Inflation have been presented in this industry trend. This data has been used to assess the inflationary environment as it plays a vital role in smooth functioning of the supply chain, directly impacting the logistics operational cost components e.g., pricing of tyres, driver wages & benefits, energy/fuel prices, maintenace costs, toll charges, warehousing rents, custom brokerage, forwarding rates, courier rates etc. hence impacting the overall freight and logistics market.
- Key Industry Trends - The report section named "Key Industry Trends" include all the key variables/parameters studied to better analyze the market size estimates and forecasts. All the trends have been presented in the form of data points (time series or latest available data points) along with analysis of the paramter in the form of concise market relevant commentary, for the geography studied (country or region as per the scope of report).
- Key Strategic Moves - The action taken by a company to differentiate from its competitor or used as a general strategy is referred to as a key strategic move (KSM). This includes (1) Agreements (2) Expansions (3) Financial Restructuring (4) Mergers and Acquisitions (5) Partnerships, and (6) Product Innovations. Key players (Logistics Service Providers, LSPs) in the market have been shortlisted, their KSM have been studied and presented in this section.
- Less than-Truck-Load (LTL) Road Freight Transport - The segment captures the external (outsourced) logistics expenditure incurred by the road freight transport service end users on Less than-Truck-Load (LTL) services. LTL road freight transport is characterized as multiple shipments combined onto a single truck for multiple deliveries within a network. It comprises of establishments (i) primarily engaged in general and specialized freight trucking of less than complete truck-loads, (ii) characterized by the use of terminals to consolidate shipments, generally from several shippers, into a single truck for haulage between a load assembly terminal and a disassembly terminal, where the load is sorted and shipments are re-routed for delivery (iv) Less than-Container-Load (LCL) shipping/ Groupage Shipping in case of trucking services. The activities in scope include (i) local pick-up, (ii) line-haul, and (iii) local delivery. Related value added services (VAS) of sorting, consolidation, deconslidation are included in the other services segment of freight and logistics market.
- Logistics Performance - Logistics Performance and Logistics Costs are the backbone of trade, and influences trade costs, making countries compete globally. Logistics performance is influenced by market wide adopted supply chain management strategies, government services, investments & policies, fuel/ energy costs, inflationary environment etc. Hence, in this industry trend, the logistics performance of the geography studied (country/ region as per the scope of report) has been analysed and presented over the review period.
- Major Truck Suppliers - Market share of truck brands is influenced by factors like geographical preferences, portfolio of truck types, truck prices, local production, truck repair & maintenance service peneteration, customer support, technological innovations (like electric vehicles, digitalization, autonomous trucks), fuel efficiency, financing options, annual maintenance costs, availability of substitutes, marketing startegies etc. Hence, the distribution (share % for base year of the study) of truck sales volume for leading truck brands and commentary on current market scenario & market anticipation over the forecast period have been presented in this industry trend.
- Manufacturing - This end user industry segment captures the external (outsourced) logistics expenditure incurred by the Manufacturing industry players, on road freight transport service. The end user players considered are the establishments primarily engaged in the chemical, mechanical or physical transformation of materials or substances into new products. Logistics Service Providers (LSPs) play a crucial role in maintaining a smooth flow of raw materials across the supply chain, enabling timely delivery of finished goods to distributors or end customers and storing & supplying the raw materials to clients for just-in-time manufacturing.
- Modal Share - Freight Modal Share is influenced by factors like modal productivity, government regulations, containerization, distance of shipment, temperature control requirements, type of goods, international trade, terrain, speed of delivery, shipment weight, bulk shipments, etc. Also, modal share by tonnage (tons) and modal share by freight turnover (ton-km) differ as per average distance of shipments, weight of major commodity groups transported in the economy and number of trips. This industry trend represents the distribution of freight transported by mode of transport (tons as well as ton-km), for the study base year.
- Oil and Gas, Mining and Quarrying - This end user industry segment captures the external (outsourced) logistics expenditure incurred by the extraction industry players, on road freight transport service. The end user players considered are the establishments that extract naturally occurring mineral solids, such as coal and ores; liquid minerals, such as crude petroleum; and gases, such as natural gas. Logistics Service Providers (LSPs) covers entire phases from upstream to downstream and plays a crucial role in the transportation of machinery, drilling equipments, extracted minerals, crude oil & natural gas and refined/ processed products from one place to another.
- Other End Users - Other end user segment captures the external (outsourced) logistics expenditure incurred by the financial services (BFSI), real estate, educational services, healthcare, and professional services (administrative, waste management, legal, architectural, engineering, design, consulting, scientific R&D), on road freight transport service. Logistics Service Providers (LSPs) plays a crucial role in the reliable movement of supplies and documents to/from these industries such as transporting any equipment or resources required, shipping confidential documents and files, movement of medical goods & supplies (surgical supplies and instruments, including gloves, masks, syringes, equipment) to name a few.
- Producer Price Inflation - It indicates inflation from viewpoint of the producers viz. the average selling price received for their output over a period of time. Annual change (YoY) of producer price index is reported as wholesale price inflation in the "Inflation" industry trend. As WPI captures dynamic price movements in most comprehensive way, it is widely used by governments, banks, industry, business circles and is deemed important in formulation of trade, fiscal and other economic policies. The data has been used in adjunction to consumer price inflation for better understanding the inflationary environment.
- Road Freight Pricing Trends - Freight pricing by mode of transport (USD/tonkm), over the review period, has been presented in this industry trend. The data has been used in assessing the inflationary environment, impact on trade, freight turnover (tonkm), road freight transport market demand and hence the road freight transport market size.
- Road Freight Tonnage Trends - Freight tonnage (weight of goods in tons) handled by mode of transport, over the review period, has been presented in this industry trend. The data has been used as one of the parameters apart from average distance per shipment (km), freight volume (tonkm), and freight pricing (USD/tonkm) to assess the freight transport market size.
- Road Freight Transport - Hiring a road freight transport logistics service provider (LSP) or haulier (outsourced logistics), for the transport of commodities constitutes road freight transport market. The scope of study includes (i) road transport of goods reported by hauliers registered in the reporting countries (ii) transport of raw materials or manufactured goods (solids as well as fluids) (iii) transport using commerical motor vehicles (rigid trucks or tractor-trailers, (iv) Full-Truck-Load (FTL) or Less than-Truck-Load (LTL) transport (v) containerized or non-containerized transport (vi) temperature controlled or non-temperature controlled trasnport, (vii) short haul or long haul (Over-the-road, OTR) transport, (viii) used office or household goods transport (movers and packers), (ix) other specialized cargo transport (dangerous goods, oversized cargo) and (x) outsourced first mile/ middle mile/last mile delivery shipments undertaken by road freight transport players. The scope does not include (i) transport undertaken by hauliers registered in other countries (ii) last mile meal delivery market (iii) grocery delivery market (iv) transportation via road network undertaken/ reported by Courier, Express, and Parcel (CEP) players.
- Road Length - As infrastructure plays a vital role in an economy's logistics performance, variables like length of roads, distribution of road length by surface category (paved v/s unpaved), distribution of road length by road classification (expressways v/s highways v/s other roads), have been analysed and presented in this industry trend.
- Segmental Revenue - Segmental Revenue has been triangulated or computed and presented for all the major players in the market. It refers to the road freight transport market specific revenue earned by the company, over the base year of study, in the geography studied (country or region as per the scope of report). It is computed through the study and analysis of major parameters like financials, service portfolio, employee strength, fleet size, investments, number of countries present in, major economies of concern, etc. that have been reported by the company in its annual reports, webpage. For companies having scarce financial disclosures, paid databases like D&B Hoovers, Dow Jones Factiva have been resorted to and verified through industry/expert interactions.
- Short Haul Road Freight Transport - The segment captures the external (outsourced) logistics expenditure incurred by the road freight transport service end users on local trucking (less than 100 miles). It includes the road transport of goods (i) within a single administrative area and its hinterland, (ii) by smaller trucks and pickup trucks (iii) via containerized as well as dry bulk services (iv) intermodal from ports, container terminals or airports, and (v) outsourced first mile/ last mile delivery shipments undertaken by road freight transport players.
- Transport and Storage Sector GDP - Value and growth of Transport and Storage Sector GDP has a direct relation to the freight and logistics market size, and hence road freight transport market size. Therefore, this variable has been studied and presented over the review period, in value terms (USD) and as share % of total GDP, in this industry trend. The data has been supported by concise and relevant commentary around the investments, developments, and current market scenario.
- Trends in E-Commerce Industry - Enhanced internet connectivity and boom in smartphone penetration, coupled with increasing disposable incomes, has led to a phenomenal growth in the e-commerce market globally. Online shoppers require fast and efficient delivery of their orders leading to an increase in the demand for logistics services especially e-commerce fulfilment services. Hence, the Gross Merchandise Value (GMV), historial and projected growth, breakup of major commodity groups in e-commerce industry for the studied geography (country or region as per scope of the report) have been analysed and presented in this industry trend.
- Trends in Manufacturing Industry - Manufacturing industry involves the transformation of raw materials into finished products, while logistics industry ensures the efficient flow of raw materials to the factory, and the transport of manufactured products to the distributors & consumers. Demand-Supply of both industries are highly cross-linked and critical for a seamless supply chain. Hence, the Gross Value Added (GVA), breakup of GVA into major manufacturing sectors, and growth of manufacturing industry over the review period have been analysed and presented, in this industry trend.
- Trucking Fleet Size By Type - Market share of truck types is influenced by factors like geographical preferences, major end user industries, truck prices, local production, truck repair & maintenance service peneteration, customer support, technological disruptions (like electric vehicles, digitalization, autonomous trucks) etc. Hence, the distribution (share % for base year of study) of truck parc volume by type of truck, market disruptors, truck manufacturing investments, truck specifications, truck use & import regulations, and market anticipation over the forecast period have been presented in this industry trend.
- Trucking Operational Costs - The prime reasons for measuring/ benchmarking logistics performance of any trucking company are to reduce operational costs and increase profitability. On the other hand, measuring operational costs helps to identify whether and where to make operational changes to control expenses and identify areas for improved performance. Hence, in this industry trend, trucking operational costs and the variables involved viz. driver wages & benefits, fuel prices, repairs & maintenance costs, tyre costs etc. have been studied over the base year of study, and presented for the geography studied (country or region as per the scope of report).
- Wholesale and Retail Trade - This end user industry segment captures the external (outsourced) logistics expenditure incurred by the wholesalers and retailers, on road freight transport service. The end user players considered are the establishments primarily engaged in wholesaling or retailing merchandise, generally without transformation, and rendering services incidental to the sale of merchandise. Logistics Service Providers (LSPs) plays a crucial role in the reliable movement of supplies to and finished products from production houses to the distributors and finally to the end customer covering activites like material sourcing, transportation, order fulfillment, warehousing & storage, demand forecasting, inventory management etc.
| Keyword | Definition |
|---|---|
| Cabotage | Road transport by a motor vehicle registered in a country performed on the national territory of another country. |
| Cross Docking | Cross docking is a logistics procedure where products from a supplier or manufacturing plant are distributed directly to a customer or retail chain with marginal to no handling or storage time. Cross docking takes place in a distribution docking terminal; usually consisting of trucks and dock doors on two (inbound and outbound) sides with minimal storage space. The name ‘cross docking’ explains the process of receiving products through an inbound dock and then transferring them across the dock to the outbound transportation dock. |
| Cross Trade | International road transport between two different countries performed by a road motor vehicle registered in a third country. A third country is a country other than the country of loading/embarkation and than the country of unloading/disembarkation. |
| Dangerous Goods | The classes of dangerous goods carried by Road are those defined by the fifteenth revised edition of the UN Recommendations on the Transport of Dangerous Goods, United Nations, Geneva 2007. They include Class 1: Explosives; Class 2: Gases; Class 3: Flammable Liquids; Class 4: Flammable solids- substances liable to spontaneous combustion; substances which, on contact with water, emit flammable gases; Class 5: Oxidizing substances and organic peroxides; Class 6: Toxic and infectious substances; Class 7: Radioactive material and Class 8: Corrosive substances, Class 9: Miscellaneous dangerous substances and articles. |
| Direct Shipment | Direct shipment is a method of delivering goods from the supplier or the product owner to the customer directly. In most cases, the customer orders the goods from the product owner. This delivery scheme reduces transportation and storage costs, but requires additional planning and administration. |
| Drayage | A drayage is a form of trucking service that connects the different modes of shipping (intermodal), such as ocean freight or air freight. It’s a short-haul trip that transports goods from one place to another, usually before or after its long-haul shipping process. Drayage trucks move cargo to and from various destinations, such as container ships, storage lots, order fulfillment warehouses, and rail yards. Typically, drayage only transports goods in short distances and operates only in one metropolitan area. It also requires only one trucker in a single shift. But despite this, but it plays an important role in long-haul shipping because it gets the goods to the cargo and vice versa. It makes intermodal transport much more efficient and enables the seamless transfer of goods to the end customer. |
| Dry van | A dry van is a type of semi-trailer that's fully enclosed to protect shipments from outside elements. Designed to carry palletized, boxed or loose freight, dry vans aren't temperature-controlled (unlike refrigerated “reefer” units) and can't carry oversized shipments (unlike flatbed trailers). |
| Final Demand | Final demand includes all types of commodities (goods as well as services) consumed as final use and might include personal consumption, or consumption by government, by businesses as capital investment, and as exports. includes all types of commodities (goods as well as services) consumed as final use and might include personal consumption, or consumption by government, by businesses as capital investment, and as exports. |
| Flatbed Truck | A flatbed truck is a type of truck with rigid design. It has a back body that is flatly shaped for easy loading and unloading of goods. The flatbed truck is mostly used to transport heavy, oversized, wide and indelicate goods such as machinery, building supplies or equipment. Due to the truck open body, the goods transported with it must not be vulnerable to rain. By functionality, the flatbed truck is comparable to a flatbed trailer. |
| Inbound Logistics | Inbound logistics is the way materials and other goods are brought into a company. This process includes the steps to order, receive, store, transport and manage incoming supplies. Inbound logistics focuses on the supply part of the supply-demand equation. |
| Intermediate Demand | Intermediate demand includes goods, services, and maintenance and repair construction sold to businesses, excluding capital investment. |
| International Loaded | Place of loading of goods in reporting country (i.e., country in which the vehicle performing the transport is registered) and place of unloading in a different country. |
| International Unloaded | Place of unloading of goods in reporting country (i.e., country in which the vehicle performing the transport is registered) and place of loading in a different country. |
| OOG cargo | Out of Gauge (OOG) cargo is any cargo that can not be loaded into six-sided shipping containers simply because it is too large. The term is a very loose classification of all cargo with dimensions beyond the maximum 40HC container dimensions. That is a length beyond 12.05 meters – a width beyond 2.33 meters – or a height beyond 2.59 meters. |
| Pallets | Raised platform, intended to facilitate the lifting and stacking of goods. |
| Part load | A part load describes goods which only fills a truck partially. In essence, the quantity of the shipment is bigger than the Less Than Truckload (LTL) shipment. Also, the shipment cannot fully occupy a truck i.e. its capacity is much lower than a Full Truckload (FTL) shipment. |
| Paved Road | Road surfaced with crushed stone (macadam) with hydrocarbon binder or bituminized agents, with concrete or with cobblestone. |
| Reverse Logistics | Reverse logistics comprises of the sector of supply chains that process anything returning inwards through the supply chain or traveling ‘backward’ through the supply chain. |
| Road Freight Transport Service | Hiring a trucking agency for transport of commodities (raw materials or manufactured goods including both solids and liquids) form the origin to a destination within the country (domestic) or cross-border (international) constitutes road freight transport market. The service might be Full-Truck-Load or Less than-Truck-Load, containerized or non-containerized, temperature controlled or non temperature controlled, short haul or long haul. |
| Tautliner vehicle | Tautliner and curtainsider are used as generic names for curtain sided trucks/trailers. The curtains are permanently fixed to a runner at the top and detachable rails/poles at front and rear, allowing the curtains to be drawn open and forklifts used all along the sides for easy and efficient loading and unloading. When closed for travel, vertical load restraint straps are attached to a rope rail beneath the truck bed, connecting the truck bed and curtain along both sides. Winches at either end of the curtain tension it, hence the 'Tautliner' name. This stops the curtain from flapping or drumming in the wind and can also help retain light loads from slipping sideways. |
| Transport for hire or reward | The carriage for remuneration of goods. |
| Unpaved Road | Road with a stabilized base not surfaced with crushed stone, hydrocarbon binder or bituminized agents, concrete or cobblestone. |


Research Methodology
Mordor Intelligence follows a four-step methodology in all our reports.
- Step-1: Identify Key Variables: In order to build a robust forecasting methodology, the variables and factors identified in Step-1 are tested against available historical market numbers. Through an iterative process, the variables required for market forecast are set and the model is built on the basis of these variables.
- Step-2: Build a Market Model: Market-size estimations for the forecast years are in nominal terms. Inflation is considered to be a part of the pricing, and the average selling price (ASP) is varying throughout the forecast period for each country
- Step-3: Validate and Finalize: In this important step, all market numbers, variables and analyst calls are validated through an extensive network of primary research experts from the market studied. The respondents are selected across levels and functions to generate a holistic picture of the market studied.
- Step-4: Research Outputs: Syndicated Reports, Custom Consulting Assignments, Databases & Subscription Platforms


