Nanorobotics Market Size and Share
Market Overview
| Study Period | 2020 - 2031 |
|---|---|
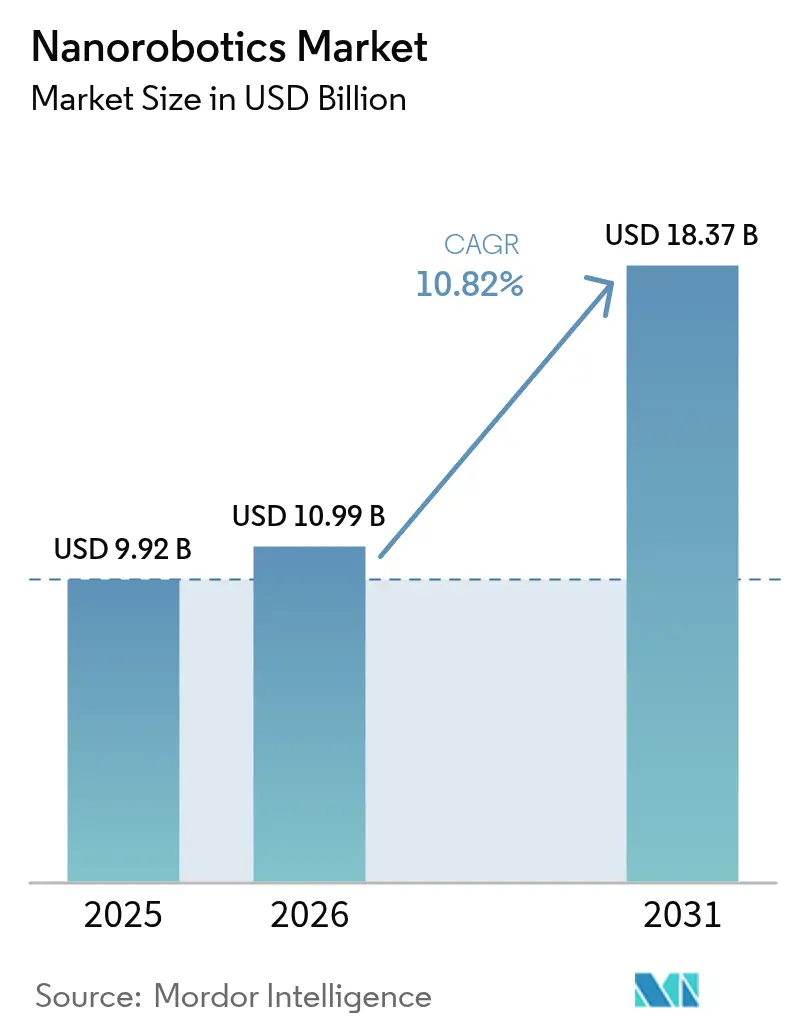
| Market Size (2026) | USD 10.99 Billion |
| Market Size (2031) | USD 18.37 Billion |
| Growth Rate (2026 - 2031) | 10.82% CAGR |
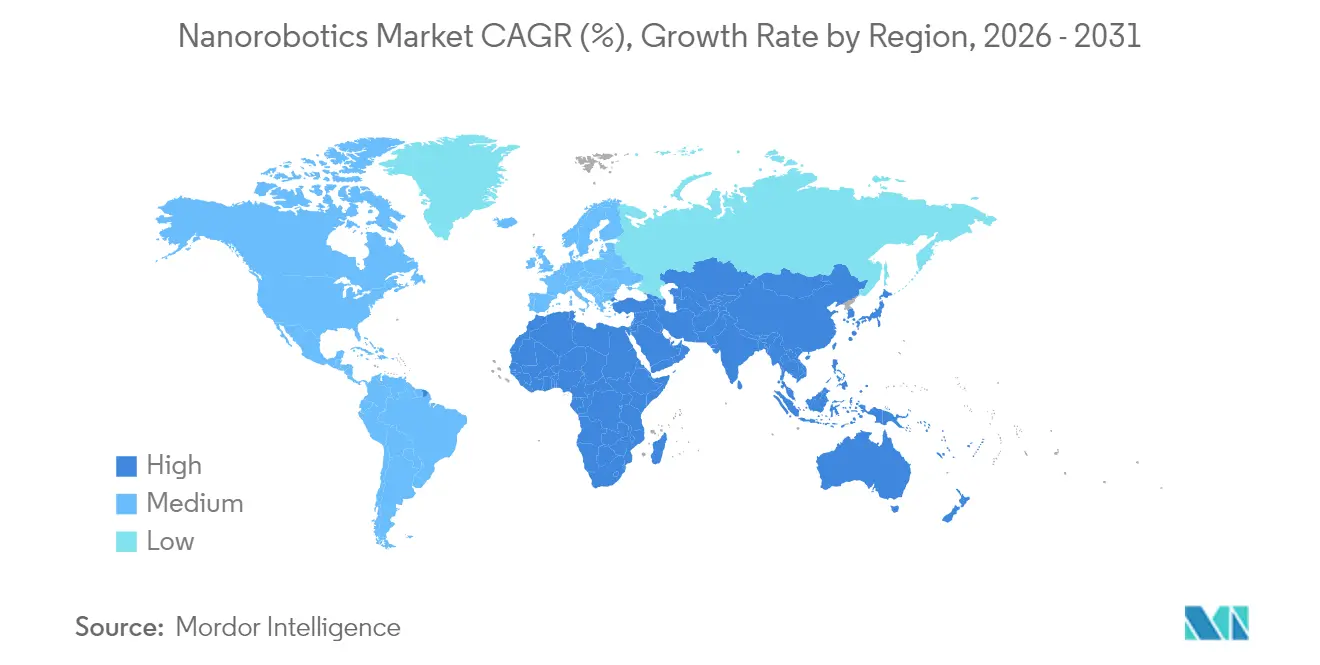
| Fastest Growing Market | Asia Pacific |
| Largest Market | North America |
| Market Concentration | Low |
Major Players *Disclaimer: Major Players sorted in no particular order Image © Mordor Intelligence. Reuse requires attribution under CC BY 4.0. | |
Nanorobotics Market Analysis by Mordor Intelligence
nanorobotics market size in 2026 is estimated at USD 10.99 billion, growing from 2025 value of USD 9.92 billion with 2031 projections showing USD 18.37 billion, growing at 10.82% CAGR over 2026-2031. Sustained growth rests on three pillars: the clinical roll-out of MRI-guided magnetic nanorobot platforms in North American and European hospitals, rising defense grants for autonomous micro-swarms, and China’s targeted subsidies for nano-manufacturing tools that lower production costs. Venture capital continues to flow into CRISPR-enabled drug-delivery start-ups, while semiconductor foundries accelerate demand for nanomanipulators that support sub-5 nm metrology workflows. Counter-pressures stem from regulatory caution over nanorobot cytotoxicity and the high cost of ISO Class 1 cleanrooms, but these headwinds have not derailed the broader adoption curve. Together, these forces cement a robust medium-term outlook for the nanorobotics market
Key Report Takeaways
- By manufacturing type, nanomanipulators held 31.12% of nanorobotics market share in 2025, while magnetically guided nanobots are projected to grow at 12.05% CAGR to 2031.
- By propulsion method, magnetic systems commanded 41.55% share of the nanorobotics market size in 2025; chemical/catalytic propulsion is set to advance at 13.55% CAGR through 2031.
- By component, nanosensors led with 36.85% revenue share in 2025; control and communication modules are forecast to expand at 14.18% CAGR over 2026-2031.
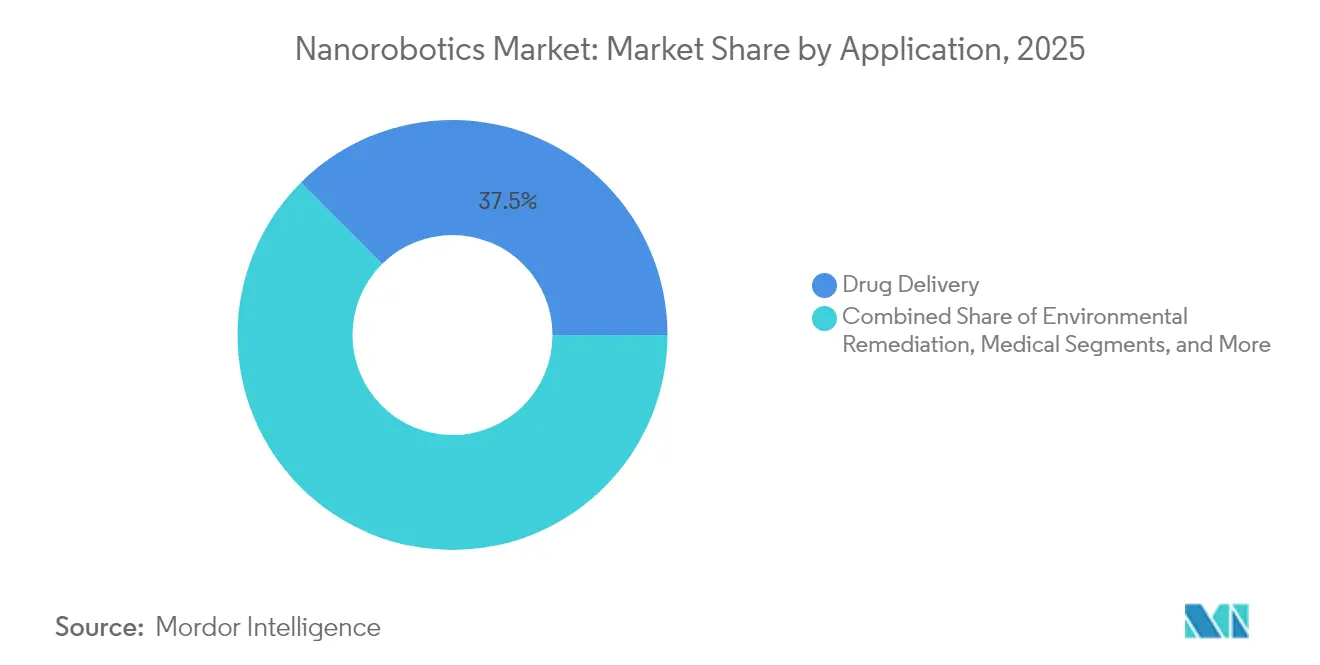
- By application, drug delivery accounted for 37.45% of the nanorobotics market size in 2025, with minimally invasive surgery being the fastest-growing application at a 15.28% CAGR.
- By end-user, hospitals held 34.25% of the nanorobotics market share in 2025, while semiconductor foundries are expected to post 13.88% CAGR through 2031.
- By Geography, North America led with 31.65% share in 2025; Asia-Pacific is the fastest-growing region at 14.46% CAGR.
Note: Market size and forecast figures in this report are generated using Mordor Intelligence’s proprietary estimation framework, updated with the latest available data and insights as of 2026.
Global Nanorobotics Market Trends and Insights
Drivers Impact Analysis*
| Driver | (~) % Impact on CAGR Forecast | Geographic Relevance | Impact Timeline |
|---|---|---|---|
| Convergence of MRI-guided Magnetic Actuation with AI | +2.1% | North America and EU | Medium term (≈3-4 yrs) |
| DARPA and EU Defence Micro-Swarm Grants | +1.5% | North America and EU, with spillover to global defense allies | Short term (≤2 yrs) |
| Chinese 14th Five-Year Plan Subsidies | +2.3% | Asia-Pacific, primarily China | Medium term (≈3-4 yrs) |
| Rapid Drop in DNA-Origami Synthesis Cost | +1.8% | Global, with early gains in research hubs | Short term (≤2 yrs) |
| Venture Funding Spike for CRISPR-Enabled Startups | +1.4% | North America and EU | Medium term (≈3-4 yrs) |
| Sub-5 nm Semiconductor Metrology Demand | +2.0% | Asia-Pacific and North America | Medium term (≈3-4 yrs) |
| Source: Mordor Intelligence | |||
Convergence of MRI-guided magnetic actuation with AI in U.S. and EU hospitals
Hospitals in the United States and Europe now combine real-time MRI imaging with AI-enhanced magnetic steering to guide nanorobots through tortuous blood vessels. Clinical trials report a 2.6-fold gain in hepatic-artery targeting accuracy and 95% algorithm compatibility during liver-cancer treatments. Deployment accelerates because existing MRI suites require no major hardware upgrades, lowering onboarding costs for hospital systems. AI path-planning reduces procedure time and contrast-agent exposure, strengthening the economic case for adoption. The resulting improvement in therapeutic outcomes places this driver at the center of the nanorobotics market growth narrative.
DARPA and EU defense micro-swarm grants accelerating military reconnaissance nanobots
DARPA’s latest programs fund swarms of 10,000 programmable micro-robots smaller than a period for navigating denied environments. Parallel EU calls emphasise distributed sensing and autonomous coordination. Early field tests show leader-follower algorithms boosting mission success in maze-like terrains by 40%, but public debate over autonomous lethality is intensifying. While ethical scrutiny could reshape export rules, the funding surge is cementing a pipeline of dual-use technologies transferable to civilian inspection and disaster-relief markets.
Chinese 14th Five-Year Plan subsidies for nano-manufacturing equipment
Beijing’s plan earmarks tax incentives and grants for domestic fabs installing nano-manufacturing tools, cutting capital expenditure by as much as 20% and lifting local supplier competitiveness. China’s 2024 R&D spend of CNY 3.33 trillion (USD 467 billion) includes a dedicated allocation for future-industry incubators, directly benefitting nanorobotics component makers. Subsidised cost structures are already visible in pilot lines producing mosquito-sized micro-drones weighing 0.3 g, signalling rapid capability gains.[1]Ministry of Industry and Information Technology, “Implementation Opinions on Promoting Innovation and Development of Future Industries,” miit.gov.cn
Rapid drop in DNA-origami synthesis cost enabling mass bio-nanorobot prototyping
Open-source synthesizers now fabricate high-density oligonucleotides for USD 19,900 per unit, slashing per-test DNA-origami costs to one cent. This price collapse lets university labs iterate thousands of bio-nanorobot designs weekly, fuelling breakthroughs like DNA-nanoparticle motors that match natural kinesin speed at 30 nm/s. The cost dynamic accelerates bench-to-clinic timelines and expands the addressable therapeutic universe for the nanorobotics market.[2]“Can DNA-nanoparticle motors get up to speed with motor proteins?” ScienceDaily, sciencedaily.com
Restraints Impact Analysis*
| Restraint | (~) % Impact on CAGR Forecast | Geographic Relevance | Impact Timeline |
|---|---|---|---|
| Cytotoxicity and Immunogenicity Concerns | -1.9% | Global, particularly in regulated markets | Long term (≥5 yrs) |
| Ultra-Cleanroom Infrastructure Costs | -1.7% | Global | Medium term (~3-4 yrs) |
| Absence of Sub-100 nm Swarm-Communication Standards | -1.2% | Global | Long term (≥5 yrs) |
| Public Ethical Backlash to Military Nano-Swarm Deployment | -0.6% | Middle East, with potential global spillover | Long term (≥5 yrs) |
| Source: Mordor Intelligence | |||
Cytotoxicity and immunogenicity concerns limiting FDA / EMA approvals
Regulators grant clearances mainly to passive nanomedicines; active, autonomous nanorobots face tougher scrutiny over long-term biodistribution and organ accumulation. Safety data gaps extend approval timelines and raise developer costs, especially for SMEs lacking the capital to fund exhaustive toxicology studies.
Ultra-cleanroom infrastructure costs hindering scale-up
Building an ISO Class 1 facility, essential for commercial nanorobot fabrication, costs USD 2,000-6,000 per square foot, with turnkey lead times exceeding 18 months due to semiconductor megaprojects straining HVAC, filter, and flooring supply chains. Over USD 300 billion in parallel fab construction has driven core material prices up 12-15% in the past year, sidelining smaller nanorobotics start-ups from securing pilot run capacity. Operational costs for a 100,000 ft² ISO Class 1 plant can reach USD 30-40 million annually for 500-750 air changes per hour, with lifetime expenses nearing USD 2 billion due to maintenance and depreciation. While modular mini-environments offer 35% capex savings, their ISO Class 4 limit forces companies back to full-scale cleanrooms for mass production, concentrating manufacturing in affluent regions and delaying global nanorobotics adoption.
*Our forecasts treat driver/restraint impacts as directional, not additive. The impact forecasts reflect baseline growth, mix effects, and variable interactions.
Segment Analysis
By Manufacturing Type: nanomanipulators maintain scale while magnetic systems drive innovation
Nanomanipulators captured 31.12% of nanorobotics market share in 2025, anchored in semiconductor metrology lines where atomic-resolution handling is indispensable. Magnetically guided nanobots, aided by MRI compatibility, are forecast to grow at 12.05% CAGR, outpacing the overall nanorobotics market size through 2031.
The mature tooling base of nanomanipulators secures recurring revenue from equipment services, yet magnetically guided platforms attract fresh healthcare budgets, especially for targeted oncology procedures. Hybrid 3D-printed constructs and bacteria-based bots diversify the ecosystem but remain niche owing to higher unit costs and regulatory uncertainties.


By Propulsion Method: magnetic dominance meets catalytic resurgence
Magnetic actuation commanded 41.55% of the nanorobotics market size in 2025 as hospitals leverage existing MRI suites for both imaging and propulsion. Chemical/catalytic systems are projected to post 13.55% CAGR by exploiting in-vivo fuel sources such as urea in bladder-cancer therapy.
Ultrasound-based acoustic propulsion and light-activated mechanisms supply application-specific advantages such as deep-tissue penetration or on-demand activation. The propulsion mix is likely to remain heterogeneous, allowing solution designers to match locomotion physics to use-case constraints.
By Component: sensors dominate detection while comms modules race ahead
Nanosensors delivered 36.85% of 2025 revenue, reflecting universal demand for molecular-level detection across healthcare and environmental monitoring. Control and communication modules are poised for 14.18% CAGR, the strongest among components, as swarm-level coordination moves from theory to prototype.
Advances in quantum-tunneling force sensors and nano-wireless data links bolster the value proposition of integrated platforms. Still, miniaturisation ceilings limit onboard processing, so edge-AI firmware must remain lightweight to conserve power budgets.
By Application: drug delivery leads as surgical robotics accelerates
Drug delivery maintained 37.45% share in 2025, underpinned by clinical data showing 70% tumour-growth reduction via DNA-origami switches. Minimally invasive surgery, including magnetic continuum robots for virtual biopsies, should grow at 15.28% CAGR, well above the headline nanorobotics market.
Environmental remediation and precision-electronics servicing provide additional growth layers. Success hinges on balancing efficacy with regulatory acceptance, especially where living tissues or eco-systems are involved.
By End-User: hospitals hold sway while foundries fuel incremental gains
Hospitals represented 34.25% of nanorobotics market share in 2025, a position supported by MRI infrastructure and reimbursement pathways. Semiconductor foundries, chasing 3 nm yields, will add the most incremental dollars, expanding at 13.88% CAGR as they procure nanomanipulators and AI-enabled inspection tools.
Pharma companies finance platform R&D, whereas defence agencies sustain niche demand for reconnaissance swarms despite policy uncertainty. Research institutes remain the innovation wellspring but contribute limited direct revenues.
Geography Analysis
North America retained 31.65% share in 2025 as DARPA grants and venture funding for CRISPR-nanorobotics kept the region at the innovation frontier. The U.S. nanomedicine segment alone is set to reach USD 279.69 billion by 2033. Canada’s research ecosystem complements this strength with gene-editing delivery platforms and oncology-focused prototypes.
Asia-Pacific is the quickest-expanding theatre at 14.46% CAGR, pulled by China’s subsidy conveyor and Japan’s microscopy precision. Subsidised fabs reduce cost barriers, and regional players demonstrate mosquito-scale drones and high-resolution SEM tools that feed global supply chains. Regulatory regimes lag Western benchmarks but are tightening, especially around medical devices.
Europe balances stringent oversight with generous R&D funding. Projects like NanoRem show how environmental imperatives translate into funded pilots for soil and groundwater cleanup. Germany and the UK dominate precision instrumentation and biotech niches, respectively, while France and Scandinavia advance ethics-focused frameworks that could shape global norms.

Competitive Landscape
Incumbent precision-instrument firms such as Thermo Fisher Scientific, JEOL, and Bruker anchor the market with installed bases in laboratories and fabs. Thermo Fisher’s Vulcan Automated Lab combines robotics and AI to streamline atomic-scale electron microscopy workflows, reducing defect analysis cycles. JEOL reported FY 2023 sales of JPY 174.3 billion, driven by strong demand for multi-beam mask writers.
Emerging players differentiate through application focus. Microbot Medical’s FDA submission for its LIBERTY endoluminal system pushed its stock up 60.71%. Nanite and Entos Pharmaceuticals leverage AI design for non-viral gene delivery, addressing unmet needs in rare-disease therapeutics.
White-space opportunities persist in environmental remediation, where academic proofs, 80% microplastics removal in two hours, outpace commercial availability. Partnerships that blend instrumentation know-how with biotech agility could unlock first-mover advantage in these nascent verticals.
Nanorobotics Industry Leaders
Thermo Fisher Scientific Inc.
Bruker Corporation
JEOL Ltd.
Oxford Instruments Plc
Microbot Medical Inc.
- *Disclaimer: Major Players sorted in no particular order

Recent Industry Developments
- April 2025: University of Missouri researchers developed a sustainable method to remove over 98% of nanoplastics from water using a low-toxicity solvent, demonstrating potential for environmental remediation applications of nanorobotics.
- March 2025: UC Berkeley engineers created a sub-centimeter wireless flying robot weighing only 21 milligrams, capable of controlled flight using an external magnetic field, eliminating the need for onboard batteries.
- March 2025: Researchers published findings on microscopic robots comparable in size to a single-celled paramecium, capable of sensing, thinking, and acting autonomously, produced at a cost under USD 0.01 each.
- February 2025: Microbot Medical filed FDA 510(k) for its LIBERTY robotic endoluminal surgical system.


Global Nanorobotics Market Report Scope
Nanorobots can be manufactured using various types of techniques, which include biochips, nubots, bacteria-based, 3D Printing, and can be used in various applications, such as drug delivery, medical imaging, information storage, health sensors, and replicators.
| Nanomanipulators |
| Bio-Nanorobots |
| Magnetically Guided Nanobots |
| Bacteria-based Nanobots |
| 3-D Printed Nanorobots |
| Other Manufacturing Types |
| Magnetic Actuation |
| Chemical / Catalytic |
| Acoustic (Ultrasound) |
| Light-Driven |
| Bio-Hybrid / Flagellar |
| Nanosensors |
| Nanoactuators and Motors |
| Nanomanipulation Systems |
| Control and Communication Modules |
| Drug Delivery |
| Medical Imaging and Diagnostics |
| Minimally-Invasive Surgery and Cell Repair |
| Health-Monitoring Sensors and Replicators |
| Environmental Remediation |
| Precision Electronics and Semiconductor Metrology |
| Military and Reconnaissance |
| Hospitals and Surgical Centers |
| Pharmaceutical and Biotech Companies |
| Academic and Government Research Institutes |
| Semiconductor Foundries |
| Defense Organizations |
| North America | United States | |
| Canada | ||
| Mexico | ||
| Europe | United Kingdom | |
| Germany | ||
| France | ||
| Italy | ||
| Rest of Europe | ||
| Asia-Pacific | China | |
| Japan | ||
| India | ||
| South Korea | ||
| Rest of Asia-Pacific | ||
| Middle East and Africa | Middle East | Saudi Arabia |
| United Arab Emirates | ||
| Turkey | ||
| Rest of Middle East | ||
| Africa | South Africa | |
| Egypt | ||
| Rest of Africa | ||
| South America | Brazil | |
| Argentina | ||
| Rest of South America | ||
| By Manufacturing Type | Nanomanipulators | ||
| Bio-Nanorobots | |||
| Magnetically Guided Nanobots | |||
| Bacteria-based Nanobots | |||
| 3-D Printed Nanorobots | |||
| Other Manufacturing Types | |||
| By Propulsion / Actuation Method | Magnetic Actuation | ||
| Chemical / Catalytic | |||
| Acoustic (Ultrasound) | |||
| Light-Driven | |||
| Bio-Hybrid / Flagellar | |||
| By Component | Nanosensors | ||
| Nanoactuators and Motors | |||
| Nanomanipulation Systems | |||
| Control and Communication Modules | |||
| By Application | Drug Delivery | ||
| Medical Imaging and Diagnostics | |||
| Minimally-Invasive Surgery and Cell Repair | |||
| Health-Monitoring Sensors and Replicators | |||
| Environmental Remediation | |||
| Precision Electronics and Semiconductor Metrology | |||
| Military and Reconnaissance | |||
| By End-User | Hospitals and Surgical Centers | ||
| Pharmaceutical and Biotech Companies | |||
| Academic and Government Research Institutes | |||
| Semiconductor Foundries | |||
| Defense Organizations | |||
| By Geography | North America | United States | |
| Canada | |||
| Mexico | |||
| Europe | United Kingdom | ||
| Germany | |||
| France | |||
| Italy | |||
| Rest of Europe | |||
| Asia-Pacific | China | ||
| Japan | |||
| India | |||
| South Korea | |||
| Rest of Asia-Pacific | |||
| Middle East and Africa | Middle East | Saudi Arabia | |
| United Arab Emirates | |||
| Turkey | |||
| Rest of Middle East | |||
| Africa | South Africa | ||
| Egypt | |||
| Rest of Africa | |||
| South America | Brazil | ||
| Argentina | |||
| Rest of South America | |||


Key Questions Answered in the Report
What is the current size of the nanorobotics market?
The nanorobotics market stood at USD 10.99 billion in 2026 and is forecast to reach USD 18.37 billion by 2031.
Which segment holds the largest nanorobotics market share?
Nanomanipulators led with 31.12% share in 2025 due to widespread use in semiconductor metrology.
Why are magnetic propulsion systems so dominant?
Hospitals can repurpose MRI equipment for both imaging and propulsion, giving magnetic systems 41.55% share of the nanorobotics market size in 2025.
Which region is growing fastest?
Asia-Pacific is projected to grow at 14.46% CAGR through 2031, driven by Chinese and Japanese investments in nano-manufacturing and precision metrology.
What is the main regulatory hurdle facing medical nanorobots?
FDA and EMA approval cycles are slowed by concerns over cytotoxicity and immunogenicity of autonomous nanorobots, extending time-to-market.
How do semiconductor trends influence the nanorobotics market?
Sub-5 nm chip fabrication requires atomic-scale inspection, boosting demand for nanomanipulator robotics and AI-enabled metrology systems.
Page last updated on:


