Zinc Oxide Market Size and Share
Market Overview
| Study Period | 2020 - 2031 |
|---|---|
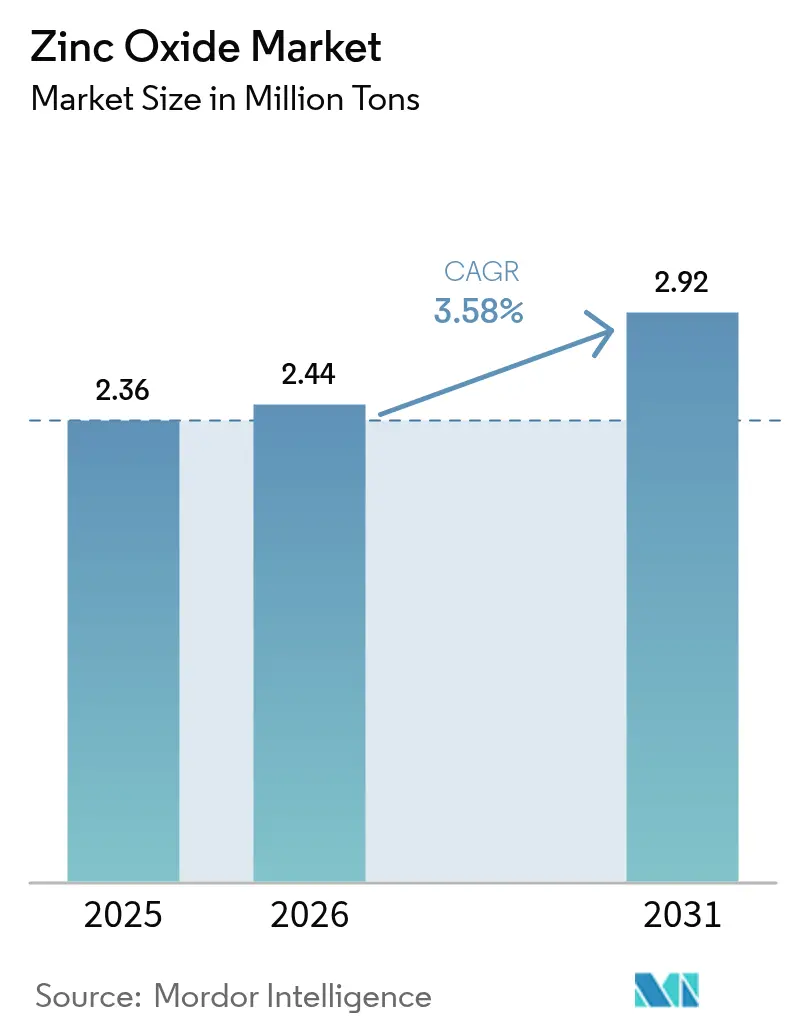
| Market Volume (2026) | 2.44 Million tons |
| Market Volume (2031) | 2.92 Million tons |
| Growth Rate (2026 - 2031) | 3.58% CAGR |
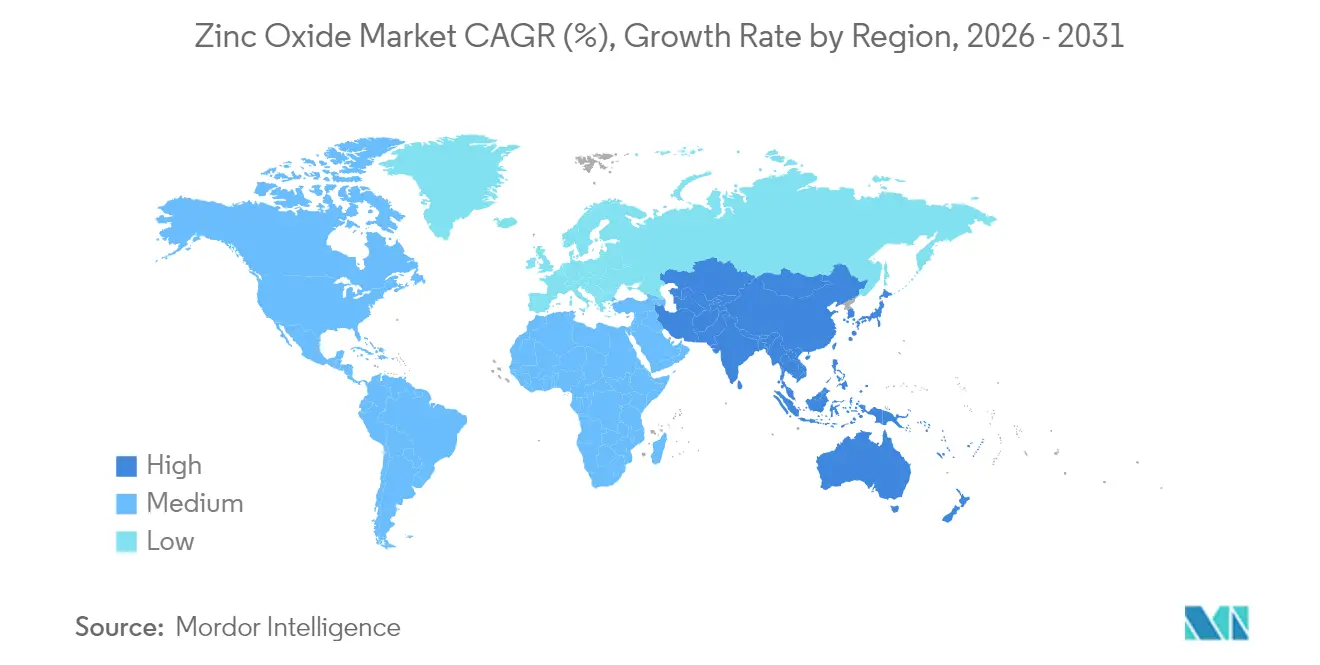
| Fastest Growing Market | Asia Pacific |
| Largest Market | Asia Pacific |
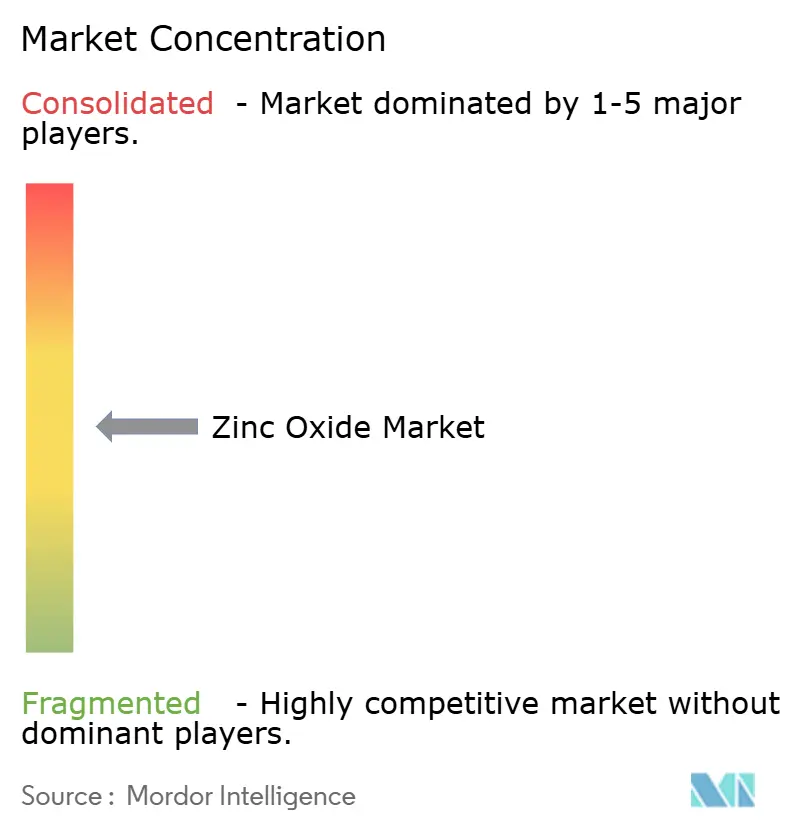
| Market Concentration | Medium |
Major Players *Disclaimer: Major Players sorted in no particular order Image © Mordor Intelligence. Reuse requires attribution under CC BY 4.0. | |
Zinc Oxide Market Analysis by Mordor Intelligence
Zinc Oxide Market size in 2026 is estimated at 2.44 million tons, growing from 2025 value of 2.36 million tons with 2031 projections showing 2.92 million tons, growing at 3.58% CAGR over 2026-2031. A sustained preference for zinc oxide’s UV attenuation, antimicrobial activity, and catalytic behavior fuels demand across legacy and emerging applications. Innovations in nano-scale processing now enable tighter particle-size control that improves heat resistance in high-temperature coatings while simultaneously lowering additive loadings in green-tire formulations. The compound’s Generally Recognized as Safe and Effective (GRASE) status underpins rising cosmetics adoption, whereas its wide bandgap makes it attractive for next-generation optoelectronics. Meanwhile, widespread process upgrades—from hybrid indirect/wet-chemical routes to closed-loop water systems—create new efficiency benchmarks and keep compliance costs in check despite stricter wastewater limits.
Key Report Takeaways
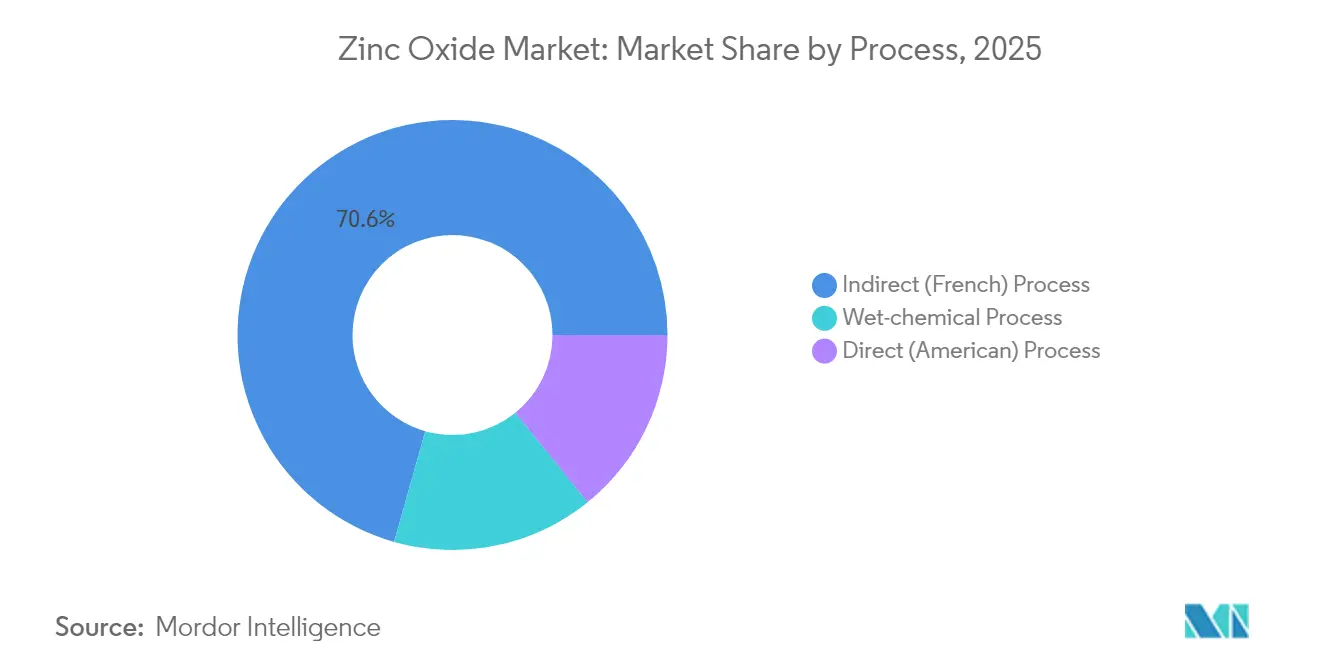
- By process, the indirect method held 70.62% of zinc oxide market share in 2025; the wet-chemical route is projected to expand at a 4.02% CAGR through 2031.
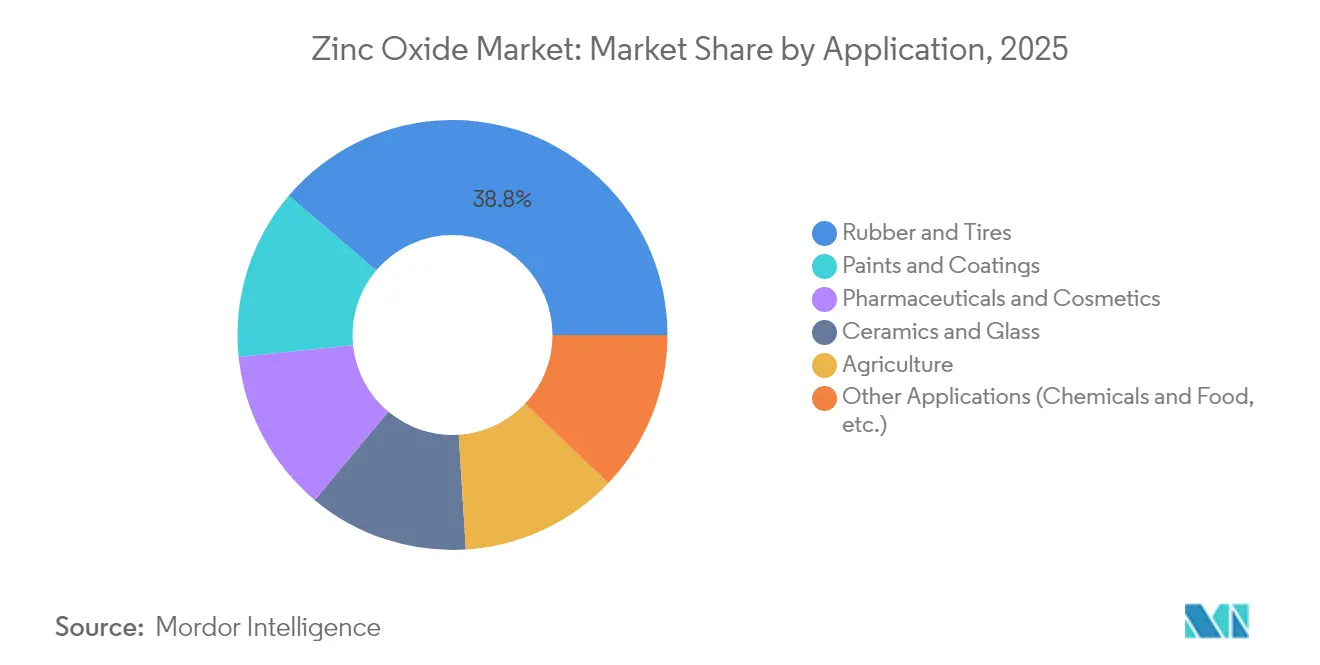
- By application, rubber and tire compounds accounted for 38.79% of the zinc oxide market size in 2025, while paints and coatings are poised to grow at a 4.18% CAGR to 2031.
- By geography, Asia-Pacific led with 45.10% of zinc oxide market share in 2025, and is expected to maintain the fastest 3.92% CAGR during the forecast window.
Note: Market size and forecast figures in this report are generated using Mordor Intelligence’s proprietary estimation framework, updated with the latest available data and insights as of 2026.
Global Zinc Oxide Market Trends and Insights
Drivers Impact Analysis*
| Driver | (~) % Impact on CAGR Forecast | Geographic Relevance | Impact Timeline |
|---|---|---|---|
| Robust demand from rubber and tire industry | +1.2% | Global, with APAC concentration | Medium term (2-4 years) |
| Expansion of cosmetics and sunscreen adoption | +0.8% | North America & EU, rising in APAC | Short term (≤ 2 years) |
| Growth of specialty ceramics and glass uses | +0.6% | APAC core, spill-over to MEA | Long term (≥ 4 years) |
| Micronutrient-rich fertilizers in agriculture | +0.4% | Global, early uptake in North America | Medium term (2-4 years) |
| Commercialisation of nano-ZnO in electronics | +0.3% | APAC & North America tech hubs | Long term (≥ 4 years) |
| Source: Mordor Intelligence | |||
Robust Demand from Rubber and Tire Industry
Global tire makers rely on zinc oxide as a vulcanization activator that delivers weather resistance and mechanical durability, attributes that become more critical as electric vehicles increase curb weight and torque. JG Chemicals reports that automotive applications contribute roughly 30% of its 59,904 MTPA output, highlighting the segment’s pull on Asian suppliers. Adoption of nano-grade zinc oxide allows up to 40% reduction in zinc dosage per compound while sustaining performance, helping tire makers meet tightening discharge targets without sacrificing mileage. Recycled-metal inputs now exceed 90% at several large plants, lowering both cost and carbon intensity. Coupled with a rebound in global vehicle production, these factors reinforce a steady upward trajectory for the zinc oxide market.
Expansion of Cosmetics and Sunscreen Formulations
Mineral UV filters enjoy tailwinds as regulators restrict chemicals such as oxybenzone. Zinc oxide’s broad-spectrum protection, recognized as GRASE, drives formulators toward ultrafine grades that eliminate the historical white-cast hurdle[1]EverZinc, “Zano® Ultrafine Zinc Oxide,” everzinc.com. EverZinc’s Zano portfolio, produced under GMP, offers transparent dispersions that carry Ecocert and Cosmos approvals, aligning with clean-beauty positioning. Surface-treated particles improve skin feel while maintaining high SPF, accelerating take-up across premium skincare lines in Asia-Pacific and reef-safe sun care in North America. Green synthesis methods using plant extracts further differentiate products for health-conscious consumers.
Growth of Specialty Ceramics and Glass Applications
Advanced ceramics for aerospace nozzles, electronic substrates, and energy components require flux agents that confer both mechanical strength and electrical insulation. Zinc oxide satisfies these criteria and enables lowered firing temperatures that cut kiln energy by up to 15%. Electronics miniaturization, especially in 5G modules, pushes demand for high-purity grades with sub-ppm impurity profiles. In glass, zinc oxide raises chemical durability and optical clarity, supporting wider adoption in low-E architectural glazing and automotive heads-up displays. Producers deploying precise particle-sizing technologies capture these value-added opportunities, bolstering the zinc oxide market.
Micronutrient-Rich Fertilizers in Precision Agriculture
Soil zinc deficiency curbs grain yields, prompting increased use of zinc oxide-enriched fertilizers. Nano-formulations improve leaf uptake, boosting chlorophyll and protein content under stress conditions, with field trials showing yield gains of 8-10% in wheat. Variable-rate application systems apply these concentrates exactly where needed, minimizing runoff. Controlled-release coatings lengthen nutrient availability during the critical first month of growth, cutting per-acre nutrient loss. Government biofortification programs further institutionalize demand by targeting higher zinc content in staple crops, reinforcing the zinc oxide market’s agricultural pillar.
Restraints Impact Analysis*
| Restraint | (~) % Impact on CAGR Forecast | Geographic Relevance | Impact Timeline |
|---|---|---|---|
| Zinc concentrate price volatility | -0.9% | Global, acute in import-dependent regions | Short term (≤ 2 years) |
| Tightening discharge regulations on ZnO leachate | -0.6% | North America & EU, expanding globally | Medium term (2-4 years) |
| Substitution by Calcium or Zinc-free green-tire activators | -0.4% | Global automotive markets | Long term (≥ 4 years) |
| Source: Mordor Intelligence | |||
Zinc Concentrate Price Volatility
Supply disruptions and geopolitical tensions drove concentrate prices up 13% to USD 2,978.50 / t in 2024, squeezing smelter treatment charges and narrowing margins for oxide producers. The International Lead and Zinc Study Group now projects a 150,000-ton refined zinc surplus in 2025, yet freight bottlenecks and ore-quality variation sustain price swings that complicate procurement planning. U.S. producers, 73% reliant on imports, remain especially exposed to currency fluctuations and tariff risk[2]U.S. Environmental Protection Agency, “Effluent Limitations Guidelines,” epa.gov. Larger firms respond by lengthening supply contracts and integrating recycling streams that already supply over 40% of their zinc input, whereas smaller firms encounter higher working-capital burdens, damping near-term growth in the zinc oxide market.
Tightening Discharge Regulations on ZnO Leachate
New federal guidelines cap zinc in industrial effluent at 1.5 mg/L daily and 0.75 mg/L on a 30-day average, compelling costly upgrades to water-treatment infrastructure. European Chemical Agency proposals to reclassify zinc oxide from Chronic 1 to Chronic 2 introduce further uncertainty that could tighten labeling and reporting rules. In Australia, industrial precincts already exceed national dissolved-zinc targets, prompting mandatory monitoring and remediation investment. Capital outlays for closed-loop systems and high-efficiency filters disproportionately burden smaller facilities, prompting consolidation that may reshape the zinc oxide market over the medium term.
*Our forecasts treat driver/restraint impacts as directional, not additive. The impact forecasts reflect baseline growth, mix effects, and variable interactions.
Segment Analysis
By Process: Indirect Method Retains Scale Advantages While Wet-Chemical Gains Traction
Indirect (French) production delivered 70.62% of output in 2025, benefiting from decades of fine-tuning that anchor cost efficiency and consistent purity demanded by mass markets in rubber, ceramics, and pigments. Continuous furnace upgrades, heat-recovery loops, and waste-gas cogeneration further lower specific energy consumption, reinforcing the indirect route’s competitiveness in the zinc oxide market. In parallel, wet-chemical operations are scaling quickly, recording a 4.02% CAGR thanks to their ability to engineer nano- or micro-level morphology with narrow size distributions essential for cosmetics, electronics, and precision agriculture. Plant retrofits now blend indirect calcination stages with wet-chemical precipitation for flexible grade portfolios that capture both high-volume and niche value segments.
Growing regulatory scrutiny accelerates adoption of green chemistry inside wet-chemical lines. Botanical extracts and microbial catalysts replace conventional alkali precipitants, producing bio-compatible nanoparticles suited for dermatological and biomedical products. Simultaneously, digital process-control algorithms monitor pH, temperature, and residence time in real time, minimizing batch-to-batch variance and improving yield. Collectively, these innovations broaden end-use fields and ensure that the zinc oxide market maintains a balanced process mix responsive to evolving customer specifications.


By Application: Rubber Dominance Faces Rapid Coatings Momentum
Rubber and tire compounds generated 38.79% of 2025 demand, reflecting their entrenched role in vulcanization systems that confer tensile strength and weather resistance. Electric-vehicle proliferation intensifies wear and heat stress, indirectly raising per-tire zinc oxide loads, thereby lengthening the lifespan of the segment’s dominance inside the zinc oxide market. Nevertheless, paints and industrial coatings now post the fastest 4.18% CAGR, buoyed by nano-zinc oxide dispersions that withstand 500 °C and enhance corrosion protection for offshore, petrochemical, and high-temperature pipeline assets. The shift illustrates a re-weighting toward specialty, higher-margin outlets less exposed to automotive cycles.
Ceramics and glass continue steady uptake as manufacturers seek fluxes that enable lower firing temperatures and add electrical insulation in electronic ceramics. Meanwhile, pharmaceutical and cosmetics lines expand on the back of mineral-only sunscreen mandates and the rise of reef-safe labels. Agriculture emerges as a technology push sector where nano-formulations improve nutrient bioavailability, closing micronutrient gaps in staple crops. Diversification into battery, catalyst, and sensor applications rounds out an increasingly multi-pole demand profile that enhances stability for the zinc oxide market.
Geography Analysis
Asia-Pacific accounted for 45.10% of global volume in 2025 and is slated to outpace other regions with a 3.92% CAGR through 2031, powered by large downstream rubber and electronics sectors in China, India, and Southeast Asia. China alone consumes 0.3-0.5 million tons per year, equal to 5-10% of its refined-zinc usage, underscoring the material’s strategic relevance to the region’s manufacturing ecosystems. Regional producers leverage low-cost energy and integrated smelting-oxide chains to secure long-term contracts with global tire majors, a factor that consolidates Asia-Pacific’s anchor role within the zinc oxide market.
North America trails in volume yet leads in application innovation, particularly in aerospace ceramics, medical devices, and optoelectronics that command high-purity or nano-engineered grades. However, a 73% import reliance on refined zinc leaves regional oxide makers exposed to forex swings and freight bottlenecks. Investment in secondary zinc recovery and battery-grade recycling aims to mitigate this exposure. In Europe, stringent life-cycle regulations spur adoption of closed-loop water systems and low-carbon smelting inputs such as EverZinc’s use of over 40% recycled metal, reinforcing the region’s image as a sustainability leader.
Emerging zones in South America and the Middle East & Africa benefit from infrastructure and construction booms that raise coatings and rubber volumes. Although these regions currently depend on imports, new smelting capacity in Peru and Oman signals a shift toward local production over the medium term. This diffusion spreads demand and invites regional customization, adding resilience to overall zinc oxide market growth.

Competitive Landscape
The zinc oxide market remains moderately fragmented. Hindustan Zinc, EverZinc, and JG Chemicals headline the top tier, each prosecuting distinct competitive playbooks. Hindustan Zinc is dedicating USD 1.39 billion to a Debari smelter that doubles refined capacity to 2 million tpa, underpinning integrated zinc-oxide expansion while promoting its EcoZen low-carbon label boasting 75% lower emissions than conventional benchmarks. EverZinc centers its strategy on specialty niches, ramping its Zano ultrafine line and launching Rechargeable Zinc Materials for next-generation batteries. JG Chemicals commands roughly 30% of India’s domestic oxide demand, leveraging 80+ grade variants to serve over 200 rubber, ceramic, and pharma clients.
Technological edge decides margin leadership. Firms scale hydrothermal and mechanochemical reactors that achieve sub-50 nm medians required for optoelectronic inks. Others invest in AI-driven process control to shave energy costs and tighten particle distribution. Sustainability credentials are emerging as a procurement criterion, propelling adoption of renewable-powered furnaces and post-consumer zinc scrap loops. These moves not only meet Scope-3 emission targets of OEM customers but also open eligibility for green-financing instruments, lowering weighted average cost of capital. Concurrently, smaller regional suppliers either partner for technology access or focus on captive supply chains in local rubber clusters, carving defensible niches in the wider zinc oxide market.
Zinc Oxide Industry Leaders
EverZinc
Akrochem Corporation
RUBAMIN
Zinc Nacional S.A.
Zochem LLC
- *Disclaimer: Major Players sorted in no particular order

Recent Industry Developments
- August 2023: Zochem acquired a 40% stake in Industrias Electro-Químicas (IEQSA), a prominent Peruvian manufacturer of zinc products. Both companies will continue to operate independently under their existing names, with Zochem's operations in North America complementing IEQSA's presence in South America.
- June 2023: Zochem announced the inauguration of a new furnace at its Dickson, TN facility, enhancing its zinc oxide production capacity. This expansion adds an additional 15,000 metric tons of capacity to the Central Tennessee site.


Global Zinc Oxide Market Report Scope
Zinc Oxide (ZnO) is an inorganic compound. It is a white powder that is insoluble in water and is widely used as an additive in various materials and products. It is also known as Calamine or Zinc White. It is found naturally as the mineral zincite. It is mostly made synthetically.
The Zinc Oxide Market is segmented by Process (Indirect Process, Direct Process, and Wet Process), Application (Rubber and Tires, Ceramics and Glass, Pharmaceuticals and Cosmetics, Agriculture, Paints and Coatings, and Other Applications), and Geography (Asia-Pacific, North America, Europe, South America, and Middle-East and Africa).
The report also covers the market sizes and forecasts in 15 countries across the major regions. For each segment, the market sizing and forecasts have been done on the basis of volume (kilotons).
| Indirect (French) Process |
| Direct (American) Process |
| Wet-chemical Process |
| Rubber and Tires |
| Ceramics and Glass |
| Pharmaceuticals and Cosmetics |
| Agriculture |
| Paints and Coatings |
| Other Applications (Chemicals and Food, etc.) |
| Asia-Pacific | China |
| Japan | |
| India | |
| South Korea | |
| ASEAN Countries | |
| Rest of Asia-Pacific | |
| North America | United States |
| Canada | |
| Mexico | |
| Europe | Germany |
| United Kingdom | |
| France | |
| Italy | |
| Spain | |
| Russia | |
| NORDIC Countries | |
| Rest of Europe | |
| South America | Brazil |
| Argentina | |
| Rest of South America | |
| Middle East and Africa | Saudi Arabia |
| South Africa | |
| Rest of Middle East and Africa |
| By Process | Indirect (French) Process | |
| Direct (American) Process | ||
| Wet-chemical Process | ||
| By Application | Rubber and Tires | |
| Ceramics and Glass | ||
| Pharmaceuticals and Cosmetics | ||
| Agriculture | ||
| Paints and Coatings | ||
| Other Applications (Chemicals and Food, etc.) | ||
| By Geography | Asia-Pacific | China |
| Japan | ||
| India | ||
| South Korea | ||
| ASEAN Countries | ||
| Rest of Asia-Pacific | ||
| North America | United States | |
| Canada | ||
| Mexico | ||
| Europe | Germany | |
| United Kingdom | ||
| France | ||
| Italy | ||
| Spain | ||
| Russia | ||
| NORDIC Countries | ||
| Rest of Europe | ||
| South America | Brazil | |
| Argentina | ||
| Rest of South America | ||
| Middle East and Africa | Saudi Arabia | |
| South Africa | ||
| Rest of Middle East and Africa | ||


Key Questions Answered in the Report
What is the current Zinc Oxide Market size?
The zinc oxide market size stands at 2.44 million tons in 2026 and is on track to reach 2.92 million tons by 2031.
Which region leads global demand?
Asia-Pacific holds 45.10% of consumption, driven by large rubber and electronics supply chains and expected to grow fastest at a 3.92% CAGR.
Why is zinc oxide preferred in green tires?
It acts as a vulcanization activator that maintains mechanical integrity while newer nano-grades reduce zinc dosage by 40% without performance loss.
How are environmental rules affecting producers?
New effluent caps of 1.5 mg/L zinc push investment in closed-loop water treatment, raising capital costs but accelerating adoption of cleaner technologies.
Page last updated on:


