Nano-Metal Oxides Market Size and Share
Market Overview
| Study Period | 2020 - 2031 |
|---|---|
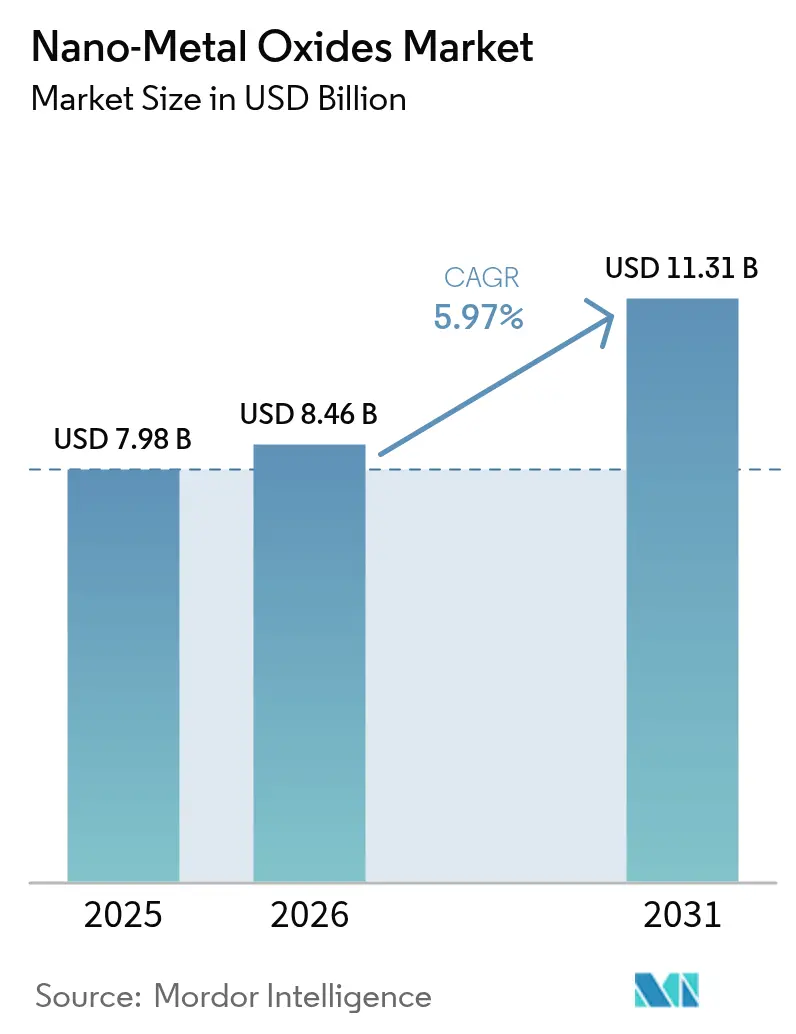
| Market Size (2026) | USD 8.46 Billion |
| Market Size (2031) | USD 11.31 Billion |
| Growth Rate (2026 - 2031) | 5.97% CAGR |
| Fastest Growing Market | Asia Pacific |
| Largest Market | Asia Pacific |
| Market Concentration | Low |
Major Players *Disclaimer: Major Players sorted in no particular order Image © Mordor Intelligence. Reuse requires attribution under CC BY 4.0. | |
Nano-Metal Oxides Market Analysis by Mordor Intelligence
Nano-Metal Oxides Market size in 2026 is estimated at USD 8.46 billion, growing from 2025 value of USD 7.98 billion with 2031 projections showing USD 11.31 billion, growing at 5.97% CAGR over 2026-2031. Industries are intensifying the use of these materials to enhance energy storage electrodes, develop self-cleaning surfaces and raise the performance ceiling of aerospace super-alloys. Demand also accelerates as formulators replace organic biocides with nano-oxide antimicrobial agents, while green bio-synthesis trims energy use by 30% and slashes production costs 40% relative to conventional routes. Competition is fragmenting as global chemical majors integrate backward into precursor supply and smaller specialists carve niches through application-specific particle design. Asia-Pacific’s manufacturing scale, combined with sustained public research spending, secures the region’s lead in pilot adoption and high-volume output.
Key Report Takeaways
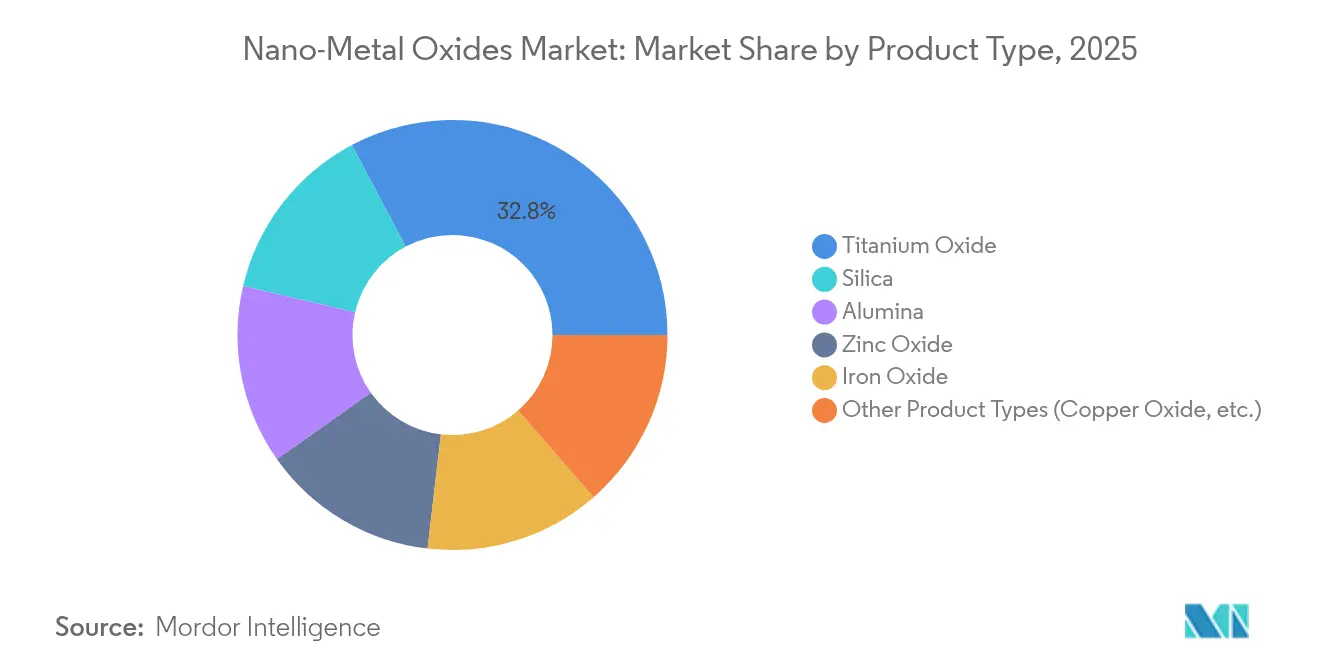
- By product type, titanium oxide led with 32.75% nano-metal oxides market share in 2025; cerium oxide is poised for the fastest 7.86% CAGR through 2031.
- By particle size, the 20-80 nm band captured 45.90% share in 2025, while the same band is also projected to grow the quickest at 7.76% CAGR.
- By synthesis method, sol-gel retained 40.72% share in 2025; green bio-synthesis is expected to rise at 8.14% CAGR.
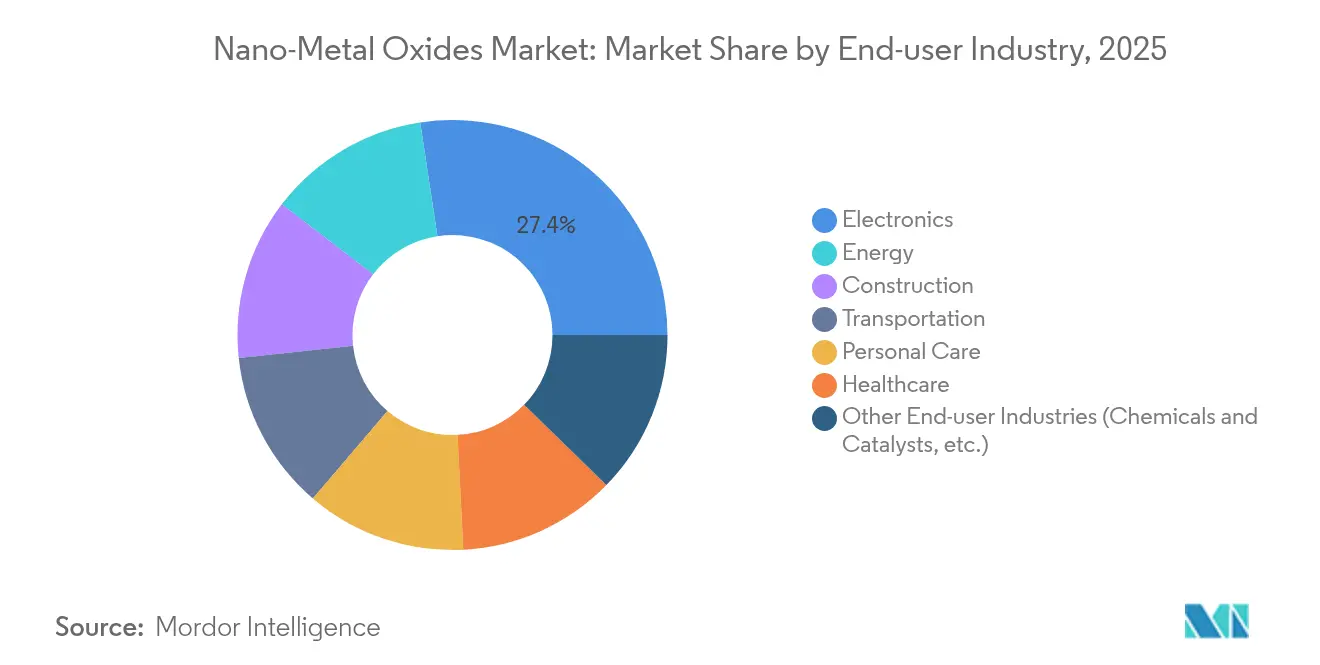
- By end-user, electronics and optoelectronics accounted for 27.40% revenue in 2025, whereas the energy sector is forecast to post the highest 8.05% CAGR to 2031.
- By geography, Asia-Pacific held 45.55% share in 2025, and the region is set to expand at 7.88% CAGR over the same horizon.
Note: Market size and forecast figures in this report are generated using Mordor Intelligence’s proprietary estimation framework, updated with the latest available data and insights as of 2026.
Global Nano-Metal Oxides Market Trends and Insights
Drivers Impact Analysis*
| Driver | (~) % Impact on CAGR Forecast | Geographic Relevance | Impact Timeline |
|---|---|---|---|
| Nanomaterials adoption in aerospace super-alloys | +1.2% | Global, with early gains in North America, Europe | Medium term (2-4 years) |
| Anti-microbial demand in personal care formulations | +1.5% | Global, strongest in Asia-Pacific and North America | Short term (≤ 2 years) |
| Energy storage electrode enhancements | +1.8% | Global, led by Asia-Pacific manufacturing hubs | Medium term (2-4 years) |
| Growing demand from paints and coatings industry | +1.0% | Global, with focus on construction-heavy regions | Long term (≥ 4 years) |
| Increasing technology of 3D-printing process | +0.8% | Global, with concentration in North America, Europe | Medium term (2-4 years) |
| Source: Mordor Intelligence | |||
Nanomaterials Adoption in Aerospace Super-Alloys
Aerospace programmes are embedding oxide-dispersion-strengthened alloys that deliver stable mechanical properties up to 500 °C, a 40% improvement on legacy aluminum systems. High-entropy nickel alloys fortified with nanoscale L1₂ precipitates keep tensile strength constant from -196 °C to 600 °C, removing temperature-sensitivity roadblocks for hypersonic vehicles. Composite fuselage sections on Boeing 787 and Airbus A350 platforms already demonstrate 20% weight savings while preserving structural integrity through nano-oxide fillers. Beyond load-bearing gains, embedded nanoparticles offer electromagnetic shielding that safeguards avionics from external interference. These combined benefits accelerate qualification cycles and ignite procurement contracts across Tier-1 suppliers.
Anti-Microbial Demand in Personal Care Formulations
Consumer preference for preservative-free cosmetics is raising interest in zinc oxide nanoparticles that achieve 90% bacterial growth reduction without cytotoxicity[1]Frontiers Media, “Zinc oxide nano-antimicrobials in cosmetics,” frontiersin.org . Multifunctional titanium dioxide particles deliver simultaneous UV protection and photo-activated pathogen kill, reducing additive loading per formulation. Copper oxide offers premium antifungal activity and supports luxury skin-care launches targeting resistant dermatophytes. The swift pivot toward metal-based actives shortens ingredient lists and supports clean-label claims, particularly in Asia-Pacific where regulatory clearance is rapid. Suppliers scaling cosmetic-grade dispersions gain first-mover advantage as brand owners re-formulate global SKU portfolios.
Energy Storage Electrode Enhancements
Silicon oxide nanospheres engineered with mesoporous channels realise 17-fold energy density versus bulk silicon by accommodating lithiation-induced expansion. Entropy-stabilised oxides that house five or more metal species deliver fast ion conduction and structural resiliency, allowing longer cycle lives in solid-state cells. Emerging iron-air batteries integrate nano-oxide catalysts to promote reversible Fe / FeO redox, unlocking cost-effective grid storage with abundant materials. These breakthroughs enhance safety margins and taper reliance on scarce cobalt, positioning oxides at the core of next-generation battery chemistries.
Growing Demand from Paints and Coatings Industry
Zinc and copper oxide pigments withstand 500 °C while presenting superior salt-spray corrosion resistance, extending maintenance intervals for industrial assets. Photocatalytic titanium dioxide coatings achieve enhanced crystallinity after 800 °C heat treatment, advancing self-cleaning façade systems. Near-infrared reflective nano-pigments cut surface temperatures on dark façades by 50%, mitigating urban heat island effects and supporting green building codes. Adoption intensifies in construction-dense economies where energy-smart materials command premium margins.
Restraints Impact Analysis*
| Restraint | (~) % Impact on CAGR Forecast | Geographic Relevance | Impact Timeline |
|---|---|---|---|
| Environmental implications of using metal powder | -0.8% | Global, with stricter regulations in Europe and North America | Long term (≥ 4 years) |
| Price volatility of precursor metals | -1.2% | Global, with highest impact in Asia-Pacific manufacturing | Short term (≤ 2 years) |
| High production costs | -1.0% | Global, with greater impact on emerging markets | Medium term (2-4 years) |
| Source: Mordor Intelligence | |||
Environmental Implications of Using Metal Powder
Lifecycle assessments reveal that both chemically and bio-synthesised nano-oxides can induce oxidative stress and DNA damage in aquatic species, prompting regulatory scrutiny. The European Food Safety Authority and the FDA now enforce tighter exposure thresholds for consumer products, lifting compliance costs for smaller producers. Recycling protocols and closed-loop wastewater systems are becoming prerequisites for permits, adding capital expenditure to greenfield projects. Market entrants must therefore balance innovation with stringent environmental stewardship to gain market access.
Price Volatility of Precursor Metals
Titanium, zinc and rare-earth inputs suffer episodic price swings linked to concentrated mining in China, which controls key separation steps[2]Neo Performance Materials, “Strategic portfolio realignment,” neomaterials.com . Producers hedge risk by diversifying sourcing, expanding recycling and co-investing in upstream ore processing, yet short-cycle volatility still compresses margins. Green bio-synthesis lowers energy bills but remains scale-limited, leaving bulk producers reliant on conventional routes in the near term. Cost-pass-through clauses ease tension for top-tier customers, though spot market buyers endure inflated input costs during supply disruptions.
*Our forecasts treat driver/restraint impacts as directional, not additive. The impact forecasts reflect baseline growth, mix effects, and variable interactions.
Segment Analysis
By Product Type: Titanium Oxide Leads Through Versatile Applications
Titanium oxide commanded 32.75% of the nano-metal oxides market share in 2025 as its photocatalytic strength and dielectric stability secured usage from self-cleaning façades to high-k transistors. Segment expansion continues as green routes employ plant extracts to yield biocompatible particles with similar band gaps yet lower carbon footprints. Cerium oxide is projected to outpace peers with a 7.86% CAGR as dual Ce³⁺/Ce⁴⁺ states drive CMP slurries vital for semiconductor planarisation. Silica and zinc oxide remain dependable for barrier films and dermatological creams, while iron oxide nanostructures penetrate remediation systems via 89% dye degradation efficiency.
Market momentum benefits suppliers that align particle engineering with end-use certification. Titanium dioxide makers capitalise on broad regulatory acceptance in food contact and cosmetics, whereas ceria suppliers focus on wafer-scale purity. Integrated firms leverage shared precursor networks to cut logistic costs, reinforcing competitive moats in this slice of the nano-metal oxides market.


By Particle Size: 20-80 nm Dominates Manufacturing Optimisation
The 20-80 nm band represented 45.90% in 2025 and is forecast to lead with a 7.76% CAGR. The interval balances quantum surface reactivity and process stability, offering easy dispersion in inks and polymers while avoiding the agglomeration typical below 20 nm. Sub-20 nm particles deliver superior catalytic rates but raise filtration and dust-safety issues that lift handling costs. Sizes above 80 nm serve niche optical or abrasion-resistant roles yet cede mass-market volumes to the mid-range. Advances in sol-gel and hydrothermal reactors now hold ±5 nm tolerances, giving formulators confidence in batch-to-batch consistency.
Adopters value this sweet spot for tunable band gaps in photocatalysts and predictable rheology in paints. Continued reactor optimisation coupled with inline spectroscopy promises to lift throughput, cementing the 20-80 nm window as the workhorse segment of the nano-metal oxides market.
By Synthesis Method: Sol-Gel Maintains Leadership Despite Green Method Growth
Sol-gel routes delivered 40.72% share in 2025 because low-temperature reactions generate uniform stoichiometry at industrial scale. Upgrades such as microfluidic mixers enhance heat and mass transfer, shrinking residence times and improving yield. Green bio-synthesis, while only a tenth of present capacity, is set for the quickest 8.14% CAGR as fermenters using fungi or plant extracts cut energy and reduce waste streams. Flame spray and CVD cater to high-purity needs in catalytic converters and optical coatings but incur higher capital costs.
Process selection therefore hinges on purity targets, throughput and regulatory expectations. Producers integrating dual sol-gel and bio-routes hedge risk while meeting sustainability targets, reinforcing their hold on the nano-metal oxides market.
By End-User Industry: Electronics Dominance Amid Energy Sector Acceleration
Electronics and optoelectronics retained 27.40% revenue in 2025 on the back of oxide-based thin-film transistors that achieve field-effect mobility of 15 cm²/V·s and on/off ratios above 10⁸. Display makers embrace oxide semiconductors for flexible screens, spurring volume commitments. Meanwhile, the energy sector is poised to grow at 8.05% CAGR as entropy-stabilised oxides raise battery life and safety in solid-state cells. Construction applications gain from self-cleaning and NIR-reflective coatings that cut cooling loads, and healthcare expands uptake of antimicrobial films.
End-user diversification shields suppliers from single-sector shocks and escalates cumulative demand. Firms that couple application labs with customer co-development programmes convert specification wins into long-term offtake agreements within the nano-metal oxides market.
Geography Analysis
Asia-Pacific captured 45.55% share in 2025 and is projected to record a 7.88% CAGR, anchored by China’s 67.8% share of global silicon-anode materials and Japan’s 21.5% cut of advanced material patents. Vertical integration compresses costs and quickens pilot-to-mass-production transitions. Government funding exceeding USD 30 billion since 2001 finances university–industry consortia that raise technology readiness and workforce skills.
North America ranks second, supported by aerospace supply chains that require oxide-strengthened alloys and advanced semiconductors. Producers such as American Elements and Evonik invested in ultra-high-purity colloidal silica plants to serve chip fabs.
Europe emphasises eco-design. Strict REACH directives motivate early adoption of green bio-synthesis, and construction retrofits absorb NIR-reflective coatings to meet energy-efficiency mandates. Emerging regions like South America and the Middle East tap nano-oxide façades for climate-resilient infrastructure, gradually lifting their consumption as local regulations mature.


Value Chain Analysis
The nano-metal oxides value chain starts upstream with metal and rare-earth mining and refinement, followed by conversion into high-purity chemical feedstocks (organometallics, chlorides, alkoxides, and other specialty precursors) that shape downstream purity and lot-to-lot reproducibility. These inputs move into nanoparticle synthesis (sol-gel, flame-derived pyrogenic routes, hydro/solvothermal, CVD/ALD-related oxide production, and green or bio-synthesis), then through post-processing steps such as particle-size classification, surface functionalization, dispersion and stabilization, and contamination control for electronics-grade material. Midstream, compounders and formulators incorporate nano-oxides into coatings, inks, catalysts, battery materials, and polymer composites, before distribution to end users across electronics and optoelectronics, energy storage, construction coatings, personal care, and healthcare.
Operational bottlenecks often center on precursor availability and price volatility, particularly for titanium, zinc, and rare-earth-linked inputs. They also include the cost and complexity of safe handling, packaging, and transport for reactive nanopowders. Compliance requirements and customer qualification further shape the chain, with frameworks such as REACH and K-REACH driving traceability, exposure control, and wastewater management, especially for consumer-facing applications. Industry collaboration and standardization efforts, including via the Nanotechnology Industries Association (NIA), support harmonized EHS practices, while producers increasingly pair upstream coordination with downstream application support to secure specifications in semiconductor, coatings, and energy programs.
Competitive Landscape
The nano-metal oxides market is highly fragmented, with dozens of chemical majors competing alongside speciality nanotech firms. Capital-intensive reactors and the purity standards of electronics customers create high entry barriers, yet no single producer exceeds a 10% revenue share, keeping rivalry intense. Leading companies pursue vertical integration to assure precursor supply; Evonik’s January 2025 merger of silica and silane units into Smart Effects exemplifies this trend.
Rivals differentiate through particle morphology control, offering rod-shaped zinc oxide for sunscreen transparency or hollow titanium spheres for photonic crystals. Sustainability is now a branding lever. Firms touting 30% energy cuts via bio-routes win RFPs from consumer goods giants that aim to lower Scope 3 emissions.
Strategic collaborations surge. Semiconductor producers co-locate pilot reactors with materials suppliers to debug contamination issues in real time, locking in long-term offtake. Smaller firms, unable to fund end-to-end capex, specialise in surface-functionalisation services or license green-synthesis IP, positioning themselves as acquisition targets once proof of scale is secured.
Nano-Metal Oxides Industry Leaders
American Elements
Cabot Corporation
Evonik Industries AG
Nanophase Technologies Corporation
NYACOL Nano Technologies, Inc.
- *Disclaimer: Major Players sorted in no particular order


Market Opportunities and Future Outlook
Electronics and energy supply chains are creating whitespace for higher-purity nano-oxides and oxide-related precursors, where contamination control and regional supply assurance influence purchasing decisions. Recent capacity actions provide concrete signals of where demand is forming. Evonik opened its Alu5 fumed alumina production facility in Yokkaichi, Japan (October 2025) to serve Asian battery and coatings demand, and JX Advanced Metals completed an expansion at Toho Titanium’s Chigasaki Plant (June 2025) targeting CVD and ALD materials used in semiconductor processes. Together, these moves support opportunities for suppliers that can deliver electronics-grade alumina, silica, ceria, and tailored oxides with tight particle-size distributions, including the 20-80 nm range that already held 45.90% share in 2025, along with dispersion systems that reduce qualification time at fabs and with advanced materials customers.
On the bulk and specialty titanium oxide side, chlorination-based capacity additions in China point to ongoing pull for higher-quality TiO2 and nano-enabled performance upgrades across coatings and industrial uses. SunSirs-tracked projects such as Pangang’s 60,000 mt molten-salt chlorination TiO2 line reaching full production (April 2025) and Bengbu Guotai Nano Materials achieving stable mass production on an 80,000 tpy chlorination TiO2 line (October 2025) highlight process-led cost and quality competition that can expand adoption when heat resistance, self-cleaning, and NIR-reflective coatings are specified. At the same time, commercialization of differentiated architectures is opening room for niche entrants and co-development partnerships with end users, including Synthetic-Oxides LLC starting commercial sales of nanoporous ferric oxide samples (July 2026), which supports product pathways in catalysis and energy-related applications where surface area and mass-transfer performance are key purchase drivers.
Recent Industry Developments
- July 2026: Synthetic-Oxides LLC began commercial sales of nanoporous ferric oxide samples (Accel-O-Rust). Commercial availability broadens customer trials beyond lab-scale evaluation and supports faster supplier qualification in catalysis and energy-related applications that benefit from high-surface-area iron oxide architectures.
- October 2025: Evonik opened its Alu5 fumed alumina production facility in Yokkaichi, Japan to strengthen supply for Asian customers, including battery and coatings value chains. The site adds regional capacity for high-performance aluminum oxides and reduces logistics and lead-time risk for purity-sensitive applications.
- November 2024: TANIOBIS GmbH launched operations in Germany for the development and production of CVD and ALD precursor materials. This expands European capability for semiconductor-relevant precursor supply and supports localized sourcing strategies for advanced thin-film deposition processes.


Research Methodology Framework and Report Scope
Market Definition and Coverage
This market covers revenue generated from nano-scale metal oxide materials sold for use in industrial, electronics, energy, coating, and health-related applications, where the particles are engineered at the nanometer level and valued for their functional performance.
Scope exclusions: We exclude finished end products and services (for example, devices, coatings jobs, or treatment procedures) and count only the nano-metal oxide material value.
Segmentation Overview
- By Product Type
- Alumina
- Silica
- Titanium Oxide
- Zinc Oxide
- Iron Oxide
- Other Product Types (Copper Oxide, etc.)
- By Particle Size
- Less than 20 nm
- 20 – 80 nm
- Greater than 80 nm
- By Synthesis Method
- Sol-gel
- Flame Spray Pyrolysis
- Hydrothermal/ Solvothermal
- Chemical Vapor Deposition
- Green/ Bio-synthesis
- By End-user Industry
- Transportation
- Electronics
- Energy
- Construction
- Personal Care
- Healthcare
- Other End-user Industries (Chemicals and Catalysts, etc.)
- By Geography
- Asia-Pacific
- China
- Japan
- India
- South Korea
- ASEAN Countries
- Rest of Asia-Pacific
- North America
- United States
- Canada
- Mexico
- Europe
- Germany
- United Kingdom
- France
- Italy
- Spain
- Russia
- NORDIC Countries
- Rest of Europe
- South America
- Brazil
- Argentina
- Rest of South America
- Middle East and Africa
- Saudi Arabia
- South Africa
- Rest of Middle East and Africa
- Asia-Pacific
Data Sources, Market Sizing, and Validation
Desk Research
Desk research started with public science and industry touchpoints to understand what is being produced, where it is being used, and what drives volume. We referred to sources such as the USGS for minerals and metal oxide related supply signals, the US International Trade Commission data tools for trade direction checks, the European Chemicals Agency registry information for substance context, and the USPTO for patent activity around nano-enabled oxide formulations.
To connect the technical picture with commercial reality, we reviewed annual reports, investor presentations, and press releases from material suppliers and downstream manufacturers, plus association websites and reputable industry news. In a few cases, we used paid subscriptions for company financials and intelligence, patent databases, and shipment-level import-export views to support cross-checks on scale and pricing direction. These examples are not exhaustive, and many other public and subscription sources were also used to collect, validate, and clarify data points.
Primary Interviews and Surveys
Primary work was used to pressure-test the demand pool and ensure price and adoption assumptions matched what buyers and sellers report from active projects. We spoke with a mix of material producers, distributors, formulators, and end users across APAC, EMEA, and the Americas so that regional differences in application mix and purchasing cycles could be reflected in the model.
Distribution of primary research fieldwork respondents
| Company type | Respondent position | Region |
|---|---|---|
| Top tier: 34% | CXOs: 17% | APAC: 47% |
| Mid tier: 44% | Functional/Unit leaders: 41% | EMEA: 31% |
| Smaller Players: 22% | Managers: 42% | Americas: 22% |
Market-Sizing & Forecasting
Our sizing starts from a top-down build where production and trade data, along with application-level adoption signals, are used to reconstruct addressable demand for nano-metal oxides and then translate it into value using realistic price ranges. We then corroborate totals with selective bottom-up approximations, such as sampled supplier revenue splits, channel checks, and volume times average selling price (ASP) calculations for key oxide families, which helps adjust for gaps where disclosure is limited.
Inputs used in the model include indicators such as nanoparticle usage intensity by application, import-export direction for relevant oxide categories, R and D and patent momentum that support new use cases, regional manufacturing output for electronics and coatings, and observed ASP dispersion between high-purity specialty grades and higher-volume grades. For forecasting, scenario analysis was applied around capacity additions, substitution pace, and regulatory or safety handling requirements, and it was anchored by expert views on how quickly adoption moves from trials to repeat procurement. Where bottom-up visibility was weak, we used conservative participation factors and then rechecked implied volumes against trade and production signals before finalizing.
Data Validation & Update Cycle
Validation was done by comparing outputs against independent signals, like trade movement direction, known demand centers by end-use, and the implied price bands that buyers confirmed during interviews. Variances were flagged when growth or ASP shifts moved outside what could be explained by capacity changes, application mix, or region-level demand patterns, and those cases were sent back for a second analyst review.
Reports are refreshed annually, and interim updates are made when material events occur, such as large capacity announcements, sudden raw material price shifts, or new restrictions affecting certain oxide uses. Before delivery, we run a fresh pass to confirm currency conversion timing, recent pricing direction, and any new public disclosures so clients receive an updated view.
Mordor Intelligence's Nano Metal Oxides Market Estimate Compared With Other Published Estimates
Published market sizes for nano-metal oxides can vary even when they appear to cover the same topic, because the scope boundary and pricing timeline are not always handled the same way. Differences usually come from what gets counted as material revenue versus finished-product value, how nano-grade versus conventional-grade oxides are separated, and whether the current-year number is refreshed to reflect recent price movement.
In this study, currency timing and ASP progression are refreshed with recent quotes and trade-linked checks before final sign-off, which keeps the 2026 value consistent across regions and applications, a step that can shift totals versus older snapshots used by Mordor Intelligence.
Benchmark comparison
| Source | Market Size | Gaps in Research Methodology |
|---|---|---|
| Mordor Intelligence | USD 8.46 B (2026) | |
| Global Consultancy A | USD 7.32 B (2024) | Uses a different base year and presents a current-year value for 2024, which makes comparisons sensitive to price inflation and adoption shifts between 2024 and 2026. The application mix appears to lean more toward biomedical and personal care use cases, which can change the weighted ASP and total value. |
| Trade Publisher B | USD 5.42 B (2024) | Defines nano metal oxides using a broad 1 to 100 nm description but does not clearly show how conventional oxide volumes are excluded or how regional price timing is normalized. A narrower counted pool or older price points can compress the 2024 total even if the long-term growth outlook is similar. |
The table mainly shows that year selection and pricing refresh rules drive a large part of the spread, with scope boundaries around nano-grade qualification adding another layer. By tying the model to observable demand signals and then rechecking the implied prices and volumes, the resulting market size stays traceable to repeatable steps instead of one-time assumptions.


Key Questions Answered in the Report
What is the current Nano-Metal Oxides Market size?
The nano-metal oxides market size reached USD 8.46 billion in 2026.
Which product type holds the largest share?
Titanium oxide led with 32.75% nano-metal oxides market share in 2025.
Which synthesis route is growing fastest?
Green bio-synthesis is projected to expand at 8.14% CAGR between 2026 and 2031.
Why is Asia-Pacific so dominant?
Asia-Pacific owns 45.55% of demand thanks to vertically integrated supply chains and sustained government funding for nanotechnology research.
Page last updated on:


