
Zinc Citrate Market Size and Share
Market Overview
| Study Period | 2020 - 2031 |
|---|---|
| Market Size (2026) | USD 2.23 Billion |
| Market Size (2031) | USD 2.73 Billion |
| Growth Rate (2026 - 2031) | 4.12 % |
| Fastest Growing Market | Asia Pacific |
| Largest Market | Asia Pacific |
| Market Concentration | Medium |
Major Players *Disclaimer: Major Players sorted in no particular order Image © Mordor Intelligence. Reuse requires attribution under CC BY 4.0. | |
Zinc Citrate Market Analysis by Mordor Intelligence
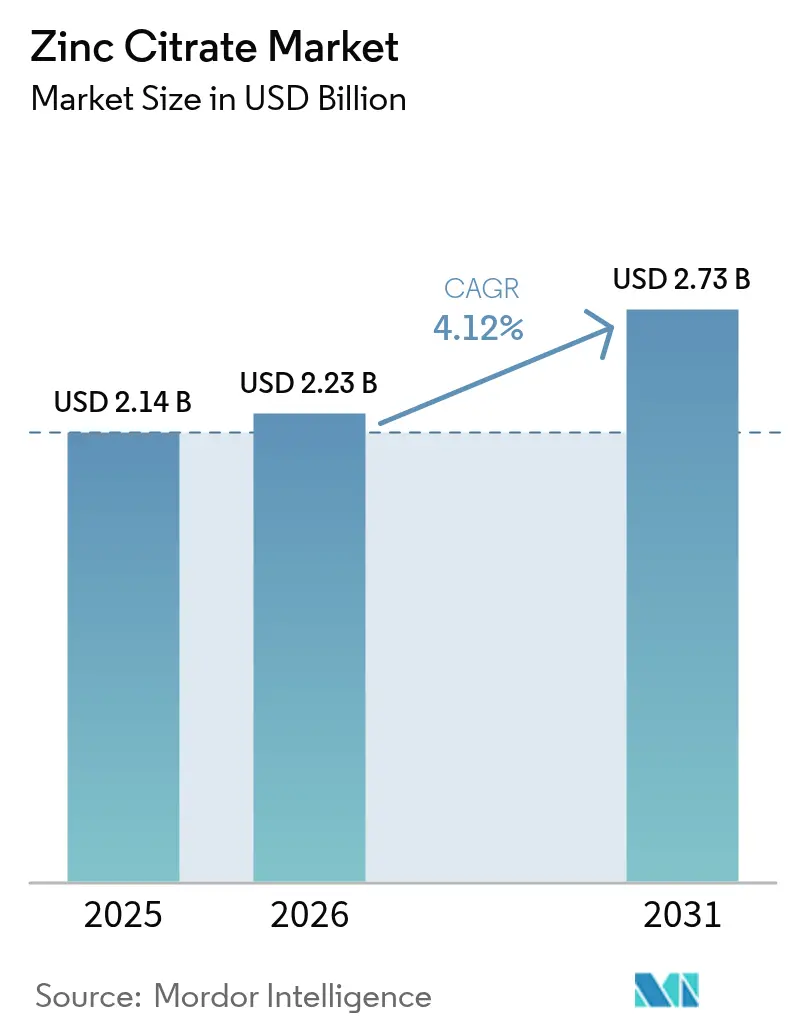
The Zinc Citrate Market size was valued at USD 2.14 billion in 2025 and estimated to grow from USD 2.23 billion in 2026 to reach USD 2.73 billion by 2031, at a CAGR of 4.12% during the forecast period (2026-2031). This steady trajectory rests on the compound’s 61.3% absorption rate, which positions it ahead of zinc gluconate and zinc oxide for applications that demand high bioavailability. Immune-health supplements, oral-care formulations and biofortification programs form the demand backbone, while a 31% elemental zinc content and neutral flavor spur adoption in gummies and toothpaste. Asia-Pacific leads production and demand due to large-scale fortification policies and rising supplement use in China and India, helping the region register the highest 4.86% CAGR to 2030. Nonetheless, cost pressure from lower-priced zinc oxide and gluconate and volatile citric-acid feedstock costs temper growth prospects, making regulatory acceptance and clinical validation critical competitive levers.
Key Report Takeaways
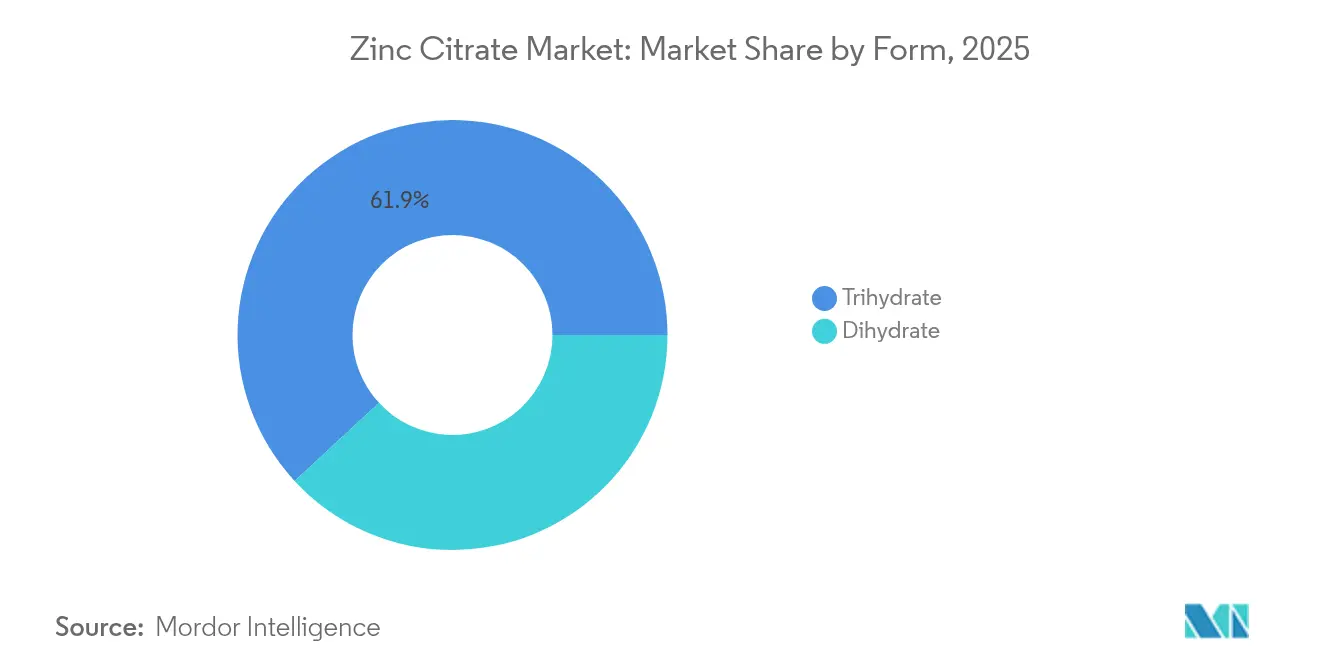
- By form, trihydrate captured 61.87% revenue share of the zinc citrate market in 2025, while it is projected to advance at a 4.62% CAGR through 2031.
- By purity grade, pharmaceutical grade held 44.85% of the zinc citrate market share in 2025; food and beverage grade is forecast to post the fastest 4.68% CAGR to 2031.
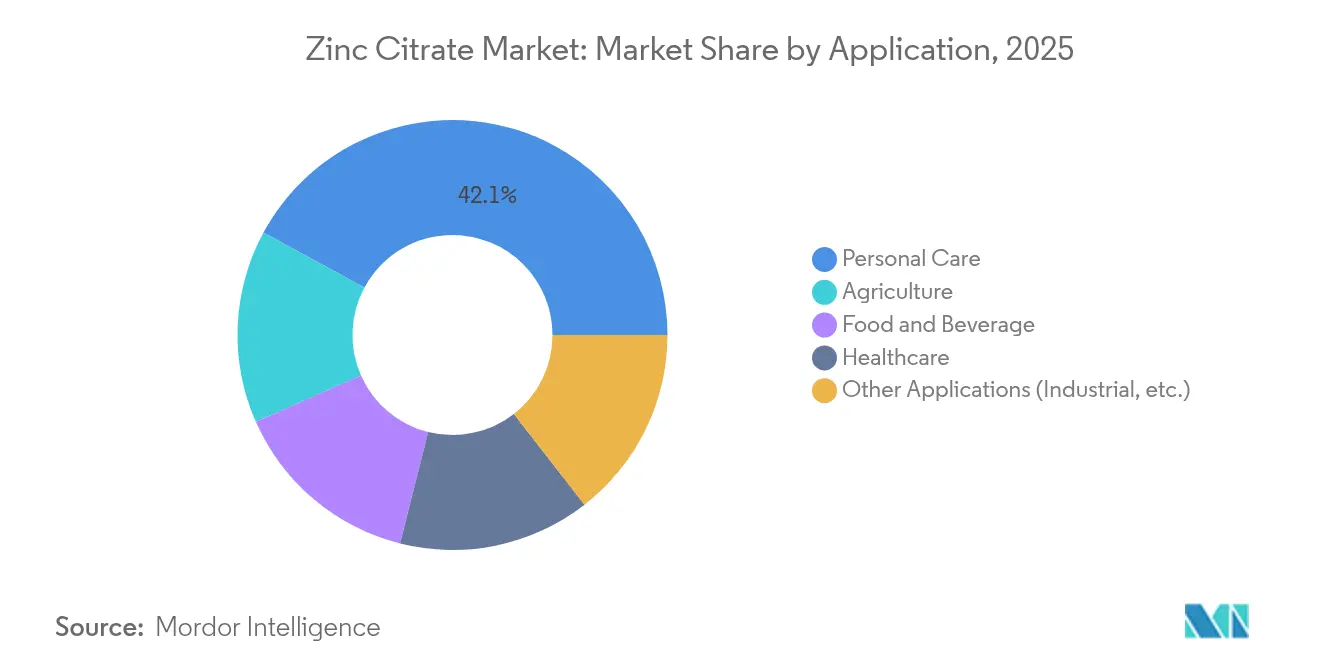
- By application, personal care accounted for 42.10% share of the zinc citrate market size in 2025 and agriculture is set to grow at a 4.87% CAGR through 2031.
- By geography, Asia-Pacific led with 39.05% share of the zinc citrate market size in 2025 and is expected to expand at a 4.65% CAGR to 2031.
Note: Market size and forecast figures in this report are generated using Mordor Intelligence’s proprietary estimation framework, updated with the latest available data and insights as of 2026.
Global Zinc Citrate Market Trends and Insights
Drivers Impact Analysis*
| Driver | (~) % Impact on CAGR Forecast | Geographic Relevance | Impact Timeline |
|---|---|---|---|
| Demand surge for immune-health supplements | +1.2% | Global, with concentration in North America & Europe | Medium term (2-4 years) |
| Accelerating uptake in oral-care formulations | +0.8% | Global, led by Asia-Pacific urban markets | Short term (≤ 2 years) |
| Growth of zinc-fortified food and beverage products | +0.9% | Asia-Pacific core, expanding to Latin America | Long term (≥ 4 years) |
| Growing demand for Gummy/chelated delivery formats | +0.7% | North America & Europe, spreading to Asia-Pacific | Medium term (2-4 years) |
| Bio-fortification programs in agri-micronutrients | +0.6% | South Asia, Sub-Saharan Africa, with pilot programs in Latin America | Long term (≥ 4 years) |
| Source: Mordor Intelligence | |||
Demand Surge for Immune-Health Supplements
Heightened post-pandemic awareness of micronutrient gaps has pushed zinc citrate into center stage for immune formulations, supported by EFSA recognition of zinc’s role in normal immune function[1]European Food Safety Authority, “Scientific opinion on zinc and the immune system,” efsa.europa.eu. Clinical work shows supplementation improves neutrophil chemotaxis and NK-cell activity, outcomes that matter for older adults who experience declining absorption efficiency. Superior uptake over inorganic salts enables premium positioning, and pairing zinc citrate with probiotic strains such as Alkalihalobacillus clausii enhances gut-immune crosstalk, adding perceived value for formulators. Pharmaceutical-grade demand benefits most because consistent bioavailability underpins therapeutic claims. Ageing populations in North America and Europe therefore ensure a stable demand floor for the zinc citrate market.
Accelerating Uptake in Oral-Care Formulations
Clinical trials document 13.4% gingivitis and 55.3% gingival-bleeding reductions when zinc citrate is used in toothpaste, validating its antimicrobial activity against common periodontal pathogens. Unlike zinc chloride or sulfate, the chelate gives comparable efficacy without bitter or metallic notes, key for consumer acceptance. In 2024, the Expert Panel for Cosmetic Ingredient Safety reaffirmed zinc citrate’s safety, removing a regulatory block that had slowed adoption. Co-formulation with arginine offers synergistic biofilm disruption, permitting lower zinc loads and better cost economics. The broader consumer shift toward aluminum-free personal-care items accelerates zinc citrate demand in deodorants and antiperspirants, strengthening the zinc citrate market outlook.
Growth of Zinc-Fortified Food and Beverage Products
Eighty-two low- and middle-income nations have fortification standards, but only 33 mandate zinc, indicating large headroom for future uptake. Zinc citrate’s solubility and neutral taste outperform zinc oxide in acidic drinks, allowing beverage brands to meet fortification rules without sensory trade-offs. Studies show zinc citrate nanoparticles achieve 443.8 µg/g absorption in soybeans—well above sulfate levels—supporting its role in agrifood biofortification. Deeper policy momentum stems from WHO estimates that zinc deficiency affects up to 20% of the global population; mandatory fortification could cut inadequacy prevalence by half. This dynamic guarantees a structural pull for the zinc citrate market over the forecast period.
Growing Demand for Gummy/Chelated Delivery Formats
Gummies command shelf space because they combine palatability and convenience. Zinc citrate’s 31% elemental content lets manufacturers hit label claims without metallic aftertaste, a known hurdle in mineral-loaded gummies. The chelated form resists undesirable cross-reactions with other nutrients in multivitamin matrices, preserving both color and potency. Sports nutrition brands exploit these properties in on-the-go packets designed for rapid post-workout mineral replenishment. Personalized-nutrition platforms also push consumers toward chelated minerals, reinforcing premium positioning in the zinc citrate industry. Clean-label requirements elevate ingredients derived from natural citric acid, giving zinc citrate a branding edge.
Restraints Impact Analysis*
| Restraint | (~) % Impact on CAGR Forecast | Geographic Relevance | Impact Timeline |
|---|---|---|---|
| Low-cost substitutes (oxide, gluconate, sulfate) | -0.9% | Global, particularly in price-sensitive agricultural and technical segments | Short term (≤ 2 years) |
| Citric-acid feedstock price volatility | -0.6% | Global manufacturing hubs, concentrated in China and Europe | Medium term (2-4 years) |
| Clinical debates on relative antibacterial efficacy | -0.4% | Primarily North America and Europe regulatory markets | Long term (≥ 4 years) |
| Source: Mordor Intelligence | |||
Low-Cost Substitutes (Oxide, Gluconate, Sulfate)
Zinc oxide sells at a steep discount to zinc citrate, making it the default choice in price-sensitive crop nutrition and bulk-technical formulations. Gluconate reaches similar absorption levels (60.9%) for less money, eroding zinc citrate’s premium proposition in mass-market supplements. Industrial users keep favoring zinc sulfate because supply chains and regulatory templates are well established. With commodity zinc markets entering cyclical oversupply, price gaps widen, forcing formulators to justify added cost through stronger efficacy claims—a hurdle in the near term for the zinc citrate market.
Citric-Acid Feedstock Price Volatility
Citric acid is the primary raw material and its price swings flow straight into zinc citrate production costs. A recent USITC determination of injury from low-priced citric-acid imports illustrates the volatility producers face[2]USITC, “Citric acid antidumping investigation,” usitc.gov. Heavy supplier concentration in China raises geopolitical risk; any trade policy shock can spike costs and compress margins. Specialty non-GMO citric acid trades at a premium yet is crucial for clean-label formulations, adding another cost layer. Long-term offtake contracts mitigate volatility but reduce flexibility if end-market demand shifts. This environment pressures producers to streamline processes or vertically integrate, shaping competitive strategy within the zinc citrate industry.
*Our forecasts treat driver/restraint impacts as directional, not additive. The impact forecasts reflect baseline growth, mix effects, and variable interactions.
Segment Analysis
By Form: Trihydrate Dominance Drives Market Stability
Trihydrate took 61.87% of the zinc citrate market share in 2025, reflecting balanced zinc content and superior processing attributes. The form is forecast to clock a 4.62% CAGR through 2031 as supplement makers favor its low hygroscopicity for stable tablets and capsules. Trihydrate also opens agronomic possibilities: nanoparticulate trihydrate achieves faster leaf uptake, an advantage as biofortification programs scale. Dihydrate remains in niche pharmaceutical use where specific dissolution profiles matter, but handling complexity restrains growth. As beverage companies and personal-care formulators require resilient ingredients across pH ranges, trihydrate’s broad compatibility should elongate its lead in the zinc citrate market.
A manufacturing base already optimized for trihydrate crystallization furthers economies of scale, enabling competitive pricing despite higher raw material costs. Its stability under both acidic beverage conditions and alkaline dentifrice environments underscores why the zinc citrate market size for trihydrate-based products is projected to expand steadily through the forecast.



By Purity Grade: Pharmaceutical Standards Shape Premium Positioning
Pharmaceutical grade held 44.85% of the zinc citrate market size in 2025, underpinned by strict bioavailability and purity demands for immune-health supplements and therapeutic products. This grade commands higher margins, yet its growth is slower than that of food and beverage grade, which is set for a 4.68% CAGR on the back of mandatory fortification laws and GRAS pathways. Technical grade remains limited to specialty catalyst and surface-treatment niches, capped by price competition from alternative zinc salts.
Food manufacturers value chelated zinc for acidic drinks and citrus concentrates, where zinc oxide precipitates or dulls flavor. As more countries add zinc to fortification standards, the zinc citrate market finds an avenue to scale beyond pharma. The European Food Safety Authority’s continued favorable opinions of chelated zinc in animal feed hint at parallel acceptance in human food, creating a tailwind for the zinc citrate industry.
By Application: Personal Care Leadership Meets Agricultural Growth
Personal care dominated with 42.10% share of the zinc citrate market size in 2025 thanks to its role in toothpaste, mouthwash and aluminum-free deodorant. Consumer focus on natural antimicrobials supports continued demand. Healthcare applications—mostly immune-support pills and wound-care sprays—maintain momentum, but penetration limits growth in mature economies.
Agriculture posts the fastest 4.87% CAGR as governments and NGOs escalate biofortification programs to cut zinc deficiency in staple crops. Foliar sprays employing zinc citrate’s high solubility require lower application rates, appealing where fertilizer budgets are tight yet efficacy mandates are strict. Food-and-beverage fortification follows close behind, driven by institutional feeding schemes across Asia-Pacific. Industrial uses remain a small slice, where zinc citrate’s chelating traits improve catalysts but cannot offset higher cost relative to sulfate or oxide.
Geography Analysis
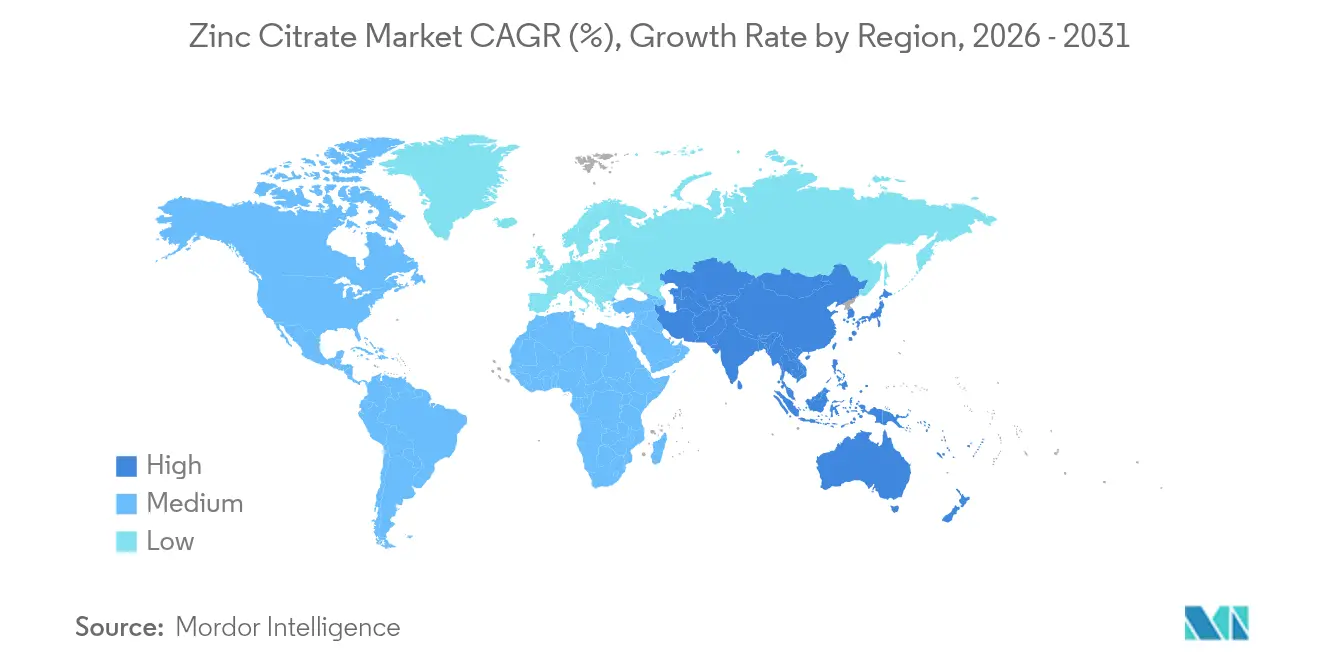
Asia-Pacific retained 39.05% of the zinc citrate market size in 2025 and is on track for a 4.65% CAGR to 2031. China’s dominance in citric-acid manufacturing delivers feedstock security, while India’s fortification and biofortification policies keep agricultural demand buoyant. Urban middle-class expansion boosts supplement and personal-care sales, and regional sustainability initiatives such as Hindustan Zinc’s low-carbon EcoZen brand align well with multinational buyers seeking greener minerals.
North America follows, buoyed by an established supplement culture and robust gummy-vitamin sales. FDA’s GRAS status streamlines product launches, but high import reliance for refined zinc (76%) leaves supply chains sensitive to external shocks. Advanced personalization platforms push chelated minerals, supporting premium pricing, though overall regional growth trails emerging economies.
Europe shows steady demand underpinned by pharmaceutical and oral-care production hubs. EFSA’s positive stance toward chelated zinc eases regulatory hurdles, and clean-label trends amplify interest. Geopolitical trade friction and Brexit add costs, yet diversified suppliers mitigate disruption risk. Biofortification projects in Eastern Europe could inject new agricultural demand if pilot trials prove cost-effective versus sulfate agronomy. Environmental regulation favoring lower-dose bioavailable forms reinforces zinc citrate’s ecological proposition.

Value Chain Analysis
The zinc citrate value chain starts with upstream zinc supply (mined zinc refined into zinc oxide or other high-purity zinc sources) and citric acid production, followed by chemical conversion. Manufacturing typically involves neutralizing citric acid with a high-purity zinc source (often zinc oxide), then precipitation, crystallization, centrifugation, and drying to produce dihydrate or trihydrate grades. Downstream steps include milling or granulation and tight impurity control for pharmaceutical and food uses.
Midstream participants include specialty chemical producers and contract manufacturers that tailor particle size and flow for direct compression tablets and dispersibility in oral-care and beverage systems. These offerings are supported by GMP or ISO quality systems and pharmacopeial or food-compliance documentation. Distribution generally moves through B2B ingredient channels to nutraceutical and pharmaceutical formulators, oral-care and personal-care manufacturers, and agricultural micronutrient blenders, where supplier qualification depends on performance claims (bioavailability, taste neutrality, and broad pH stability) and regulatory dossiers. Key bottlenecks center on feedstock volatility for citric acid and zinc inputs, achieving consistent low-impurity profiles at scale for pharma grade, and maintaining traceability demanded by clean-label and regulated end markets.
Competitive Landscape
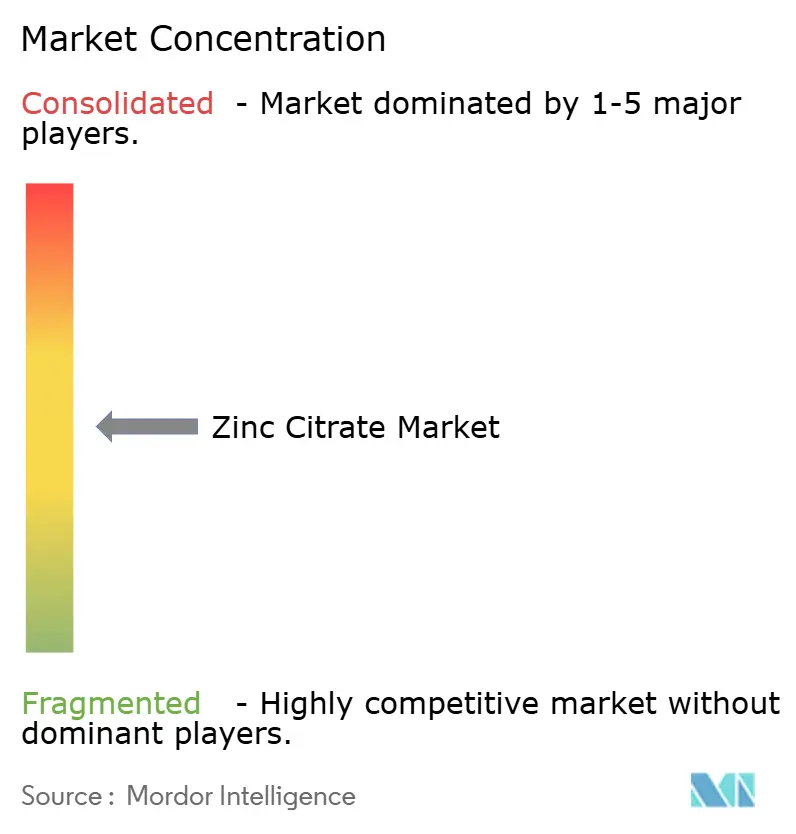
The zinc citrate market remains moderately fragmented. Integrated producers such as Jungbunzlauer leverage captive citric-acid capacity for cost leadership, while regional specialists compete via formulation support and custom particle engineering. No company exceeds a double-digit global share, reflecting the divergent purity and application requirements across pharmaceuticals, foods and agriculture.
Competitive strategy centers on validated bioavailability data rather than pure price wars. Patent filings increasingly target delivery-system advances; US Patent 7951840B2 on zinc salt compositions for dermal irritation underscores intellectual-property activity. Partnerships with probiotic firms and beverage brand owners signal a trend toward co-development. Producers that can assure raw-material traceability and non-GMO status gain favor with clean-label brands, while agricultural customers prize consistent micronutrient assays for compliance reporting.
Citric-acid volatility spurs exploration of backward integration or long-term offtake contracts. Some manufacturers hedge by blending zinc citrate with lower-cost oxide to hit target price points in crop nutrition. Supply-chain reliability, regulatory dossiers and technical-service bandwidth will decide share gains more than sheer capacity in the zinc citrate industry.
Zinc Citrate Industry Leaders
Dr. Paul Lohmann GmbH & Co. KGaA
Gadot Biochemical Industries Ltd.
Jost Chemical Co.
Jungbunzlauer Suisse AG
Sucroal
- *Disclaimer: Major Players sorted in no particular order

Market Opportunities and Future Outlook
White space is most visible in food and beverage fortification and in agriculture micronutrients, where many national fortification frameworks do not mandate zinc and product developers still face sensory or solubility constraints with alternative zinc salts. Zinc citrate fits applications that require neutral taste and better compatibility in acidic matrices, supporting use in fortified beverages and gummies, while agronomic biofortification programs create room for more bioavailable foliar formulations in regions prioritizing deficiency reduction. In regulated markets, the opportunity concentrates on pharma-grade and supplement-grade formats where pharmacopeial alignment (for example, USP monograph expectations for zinc citrate) and strong documentation packages can shorten qualification cycles for contract manufacturers and brand owners.
Supply-side actions also open opportunities in GMP-compliant capacity and application-specific grades. Jungbunzlauer has communicated expansion of mineral citrate capacity in Europe to serve pharmaceutical-grade demand, and strategies across the industry are increasingly emphasizing customized particle engineering for direct-compression and other low-processing formats. Together, capacity alignment and tighter format-driven specifications support premium segments where buyers pay for reproducible assay, low heavy metals, and processing efficiency rather than only per-unit zinc cost, particularly in oral care and immunity supplements that prioritize bioavailability and consumer-friendly taste.
Recent Industry Developments
- April 2026: Hindustan Zinc continued scaling its EcoZen low-carbon zinc offering across customer programs as downstream users expanded low-carbon raw-material sourcing initiatives. The move strengthens availability of lower-carbon zinc inputs relevant to zinc salt and chelate supply chains and supports sustainability-linked procurement in personal care and nutrition applications.
- May 2025: The US FDA approved zinc L-selenomethionine as a selenium source in broiler chicken feed following Zinpro Corp.'s food additive petition. The decision signals ongoing regulatory openness to advanced zinc-chelate ingredient systems in animal nutrition, reinforcing the pathway for higher-value zinc sources alongside conventional inorganic salts.
- July 2024: Hindustan Zinc launched EcoZen, positioned as a low-carbon zinc brand with a materially lower carbon footprint than typical benchmarks. This provided downstream chemical and ingredient producers an additional route to reduce Scope 3 emissions in zinc-based ingredient portfolios, including zinc citrate used in consumer-facing formulations.


Research Methodology Framework and Report Scope
Market Definition and Coverage
This market covers the value of zinc citrate sold for use as an ingredient across major end uses, where demand is tied to nutrition, food fortification, oral care, personal care, and agriculture needs in each region.
Scope exclusions: It excludes finished consumer product retail value and focuses on the zinc citrate ingredient value moving through manufacturing and distribution.
Segmentation Overview
- By Form
- Dihydrate
- Trihydrate
- By Purity Grade
- Pharma Grade
- Food and Beverage Grade
- Technical Grade
- By Application
- Personal Care
- Healthcare
- Food and Beverage
- Agriculture
- Other Applications (Industrial, etc.)
- By Geography
- Asia-Pacific
- China
- Japan
- India
- South Korea
- ASEAN Countries
- Rest of Asia-Pacific
- North America
- United States
- Canada
- Mexico
- Europe
- Germany
- United Kingdom
- France
- Italy
- Spain
- Russia
- NORDIC Countries
- Rest of Europe
- South America
- Brazil
- Argentina
- Rest of South America
- Middle East and Africa
- Saudi Arabia
- South Africa
- Rest of Middle East and Africa
- Asia-Pacific
Data Sources, Market Sizing, and Validation
Desk Research
Desk work starts with building a simple fact base on zinc citrate production and where it is consumed, then mapping it to end uses that actually pull demand. We lean on public sources such as the UN Comtrade database for trade flows, the USITC DataWeb for US import and export patterns, and Eurostat for relevant manufacturing and trade indicators.
To keep assumptions realistic, we also review sources such as the US FDA and EFSA for food and supplement related rules, along with WHO and NIH style publications for zinc deficiency and intake guidance that influences adoption. Company filings, product specification sheets, and investor presentations are used to understand grade mix and application exposure. A paid subscription for company financials and patent databases helps us track capacity announcements and product direction without relying on any one statement. These sources are illustrative, and many other public and paid references were also used for data collection, validation, and research clarification.
Primary Interviews and Surveys
Primary work is used to pressure test pricing, grade splits, and application demand changes that are not visible in public datasets. We speak with manufacturers, distributors, and downstream formulators across APAC, EMEA, and the Americas so the model reflects regional demand signals, not just production or trade movements.
Distribution of primary research fieldwork respondents
| Company type | Respondent position | Region |
|---|---|---|
| Top tier: 39% | CXOs: 13% | APAC: 41% |
| Mid tier: 45% | Functional/Unit leaders: 29% | EMEA: 33% |
| Smaller Players: 16% | Managers: 58% | Americas: 26% |
Market-Sizing & Forecasting
Sizing is built using a top-down and bottom-up approach, where the top-down view is constructed from the demand pool across key applications and regions, then translated into value using grade level price points. In practice, we start from indicators that move zinc citrate consumption, such as supplement and fortification activity, oral care ingredient usage, and agriculture micronutrient adoption, then apply realistic penetration and dosing assumptions that were checked in interviews.
To keep totals grounded, outputs are corroborated with selective bottom-up approximations, including supplier and distributor revenue checks, sampled price per kilogram ranges by grade, and trade based sanity checks where cross border flows are meaningful. The model uses inputs such as purity grade mix (pharma, food and beverage, technical), form mix (dihydrate and trihydrate), regional consumption shares, import dependence in smaller markets, and observed price movements in citric acid and zinc raw materials, which together shape both volume intent and realized value.
For forecasting, scenario analysis is applied around a base case, and drivers are rolled forward using a mix of trend fitting and expert validated assumptions on fortification policy momentum, supplement demand, and personal care formulation changes. Where bottom-up visibility is weaker in fragmented geographies, gaps are handled through proxy indicators and then adjusted back to regional totals so the final numbers remain consistent and explainable.
Data Validation & Update Cycle
Validation is done by checking modeled totals against independent signals such as trade direction, reported capacity changes, and regional demand narratives that repeatedly came up in calls. If a country or application shows a jump that cannot be explained by price movement, grade mix change, or a known policy shift, that block is reopened and reworked before sign off.
Our estimates go through multi step analyst reviews, where assumptions, conversions, and year splits are rechecked and then reconciled to the final market number. The report is refreshed annually, and if a material event occurs, such as a major capacity addition, sharp currency change, or supply disruption, interim adjustments are made and then revalidated with quick re-contacts. Before delivery, a final pass is done so clients receive the latest updated view tied to the same logic each time.
Mordor Intelligence's Zinc Citrate Market Sizing Compared With Other Published Estimates
Published zinc citrate market values can look different across sources, even when the topic name seems identical, because the year, price logic, and included demand buckets are not always aligned. Differences also show up when one estimate is refreshed more frequently than another, which matters in a market where input costs and currency rates can shift the value even if volumes stay stable.
The main gap drivers usually come from how the average selling price is built (spot versus annual average), which forms and grades are counted, and whether adjacent zinc salts or finished products are mixed into the same number. Another common reason is the currency timing used for conversions, and whether the model is revalidated with current trade signals and buyer feedback before release. This is where Mordor Intelligence keeps the sizing tied to annual average pricing and the latest validation checks, rather than older FX assumptions.
Benchmark comparison
| Source | Market Size | Gaps in Research Methodology |
|---|---|---|
| Mordor Intelligence | USD 2.23 B (2026) | |
| Global Research Publisher A | USD 2.01 B (2024) | Uses an earlier base year and a higher long range growth track, and the value can shift because pricing is not clearly tied to annual averages by grade and currency timing is not stated in the market note. |
| Industry Research Publisher B | USD 2.12 B (2025) | Runs on a different base year and forecast window, and the scope description blends multiple application narratives without clearly showing how grade mix and regional price differences are reconciled into one yearly value. |
The comparison shows that timing and price construction explain a large part of the spread. A one year shift in FX and raw material linked pricing can move the value even if underlying demand is steady. By keeping the scope anchored to zinc citrate forms and grades and then rechecking totals against trade and interview feedback, we end up with a market number that can be traced back to clear inputs and repeated each refresh cycle.


Key Questions Answered in the Report
What is the current Zinc Citrate Market size?
The zinc citrate market size stood at USD 2.23 billion in 2026.
How fast is the zinc citrate market expected to grow?
The market is projected to expand at a 4.12% CAGR, reaching USD 2.73 billion by 2031.
Which form holds the largest share in the zinc citrate market?
The trihydrate form led with 61.87% share in 2025 and remains the fastest-growing form.
Why is Asia-Pacific the leading regional market?
The region combines strong supplement demand, large-scale food-fortification policies and local citric-acid production, giving it 39.05% market share in 2025.
Page last updated on:


 Your data is secure and never sold or shared.


