
Muscle Relaxant Drugs Market Size and Share
Market Overview
| Study Period | 2020 - 2031 |
|---|---|
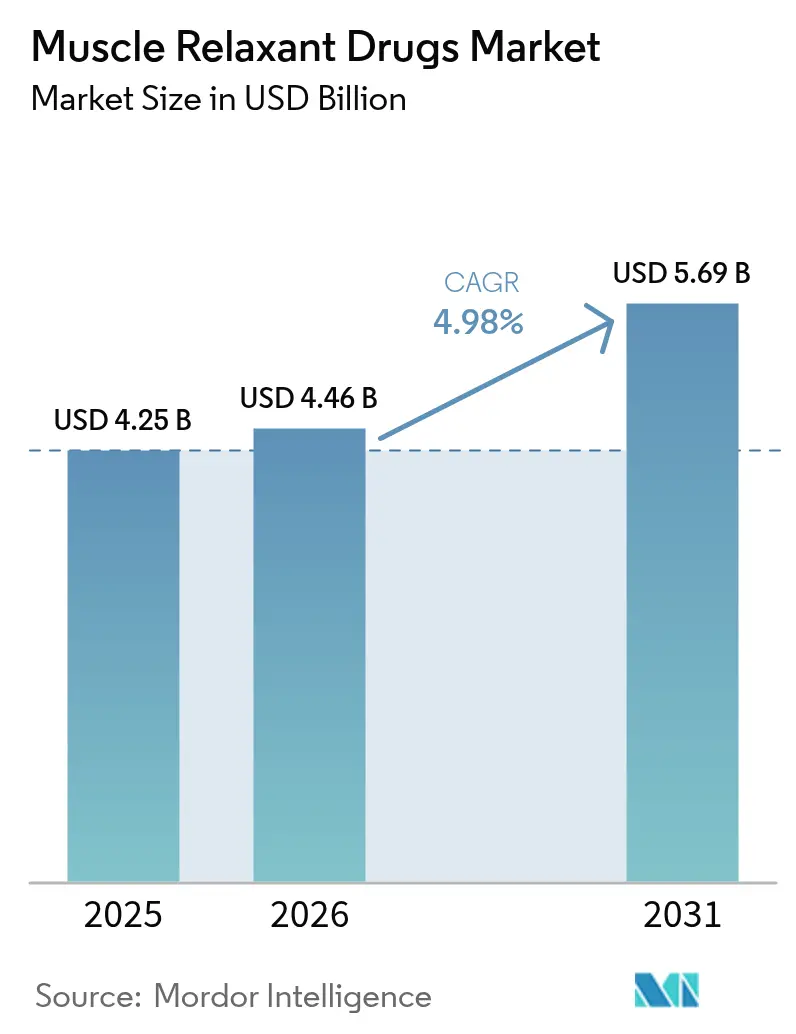
| Market Size (2026) | USD 4.46 Billion |
| Market Size (2031) | USD 5.69 Billion |
| Growth Rate (2026 - 2031) | 4.98 % |
| Fastest Growing Market | Asia Pacific |
| Largest Market | North America |
| Market Concentration | Medium |
Major Players *Disclaimer: Major Players sorted in no particular order Image © Mordor Intelligence. Reuse requires attribution under CC BY 4.0. | |
Muscle Relaxant Drugs Market Analysis by Mordor Intelligence
The Muscle Relaxant Drugs Market size is expected to grow from USD 4.25 billion in 2025 to USD 4.46 billion in 2026 and is forecast to reach USD 5.69 billion by 2031 at 4.98% CAGR over 2026-2031.
Steady demand stems from aging populations, rising musculoskeletal disease prevalence, and growth in both elective cosmetic procedures and high-volume surgeries. Technology adoption from closed-loop neuromuscular monitoring to AI-guided anesthesia supports precision dosing and reduces adverse events. Meanwhile, new delivery formats such as microneedle patches and long-acting botulinum toxin formulations reshape patient expectations for convenience, safety, and cost efficiency. Firms able to bridge innovation with resilient supply chains are positioned to navigate regulatory scrutiny, patent cliffs, and ingredient shortages that characterize the current landscape.
Key Report Takeaways
- By drug type, skeletal muscle relaxants led with 43.95% revenue share in 2025, while direct-acting agents are on track for the fastest 7.55% CAGR through 2031.
- By formulation, injectable products accounted for 54.35% of the muscle relaxant drugs market share in 2025; transdermal delivery is projected to expand at 8.28% CAGR to 2031.
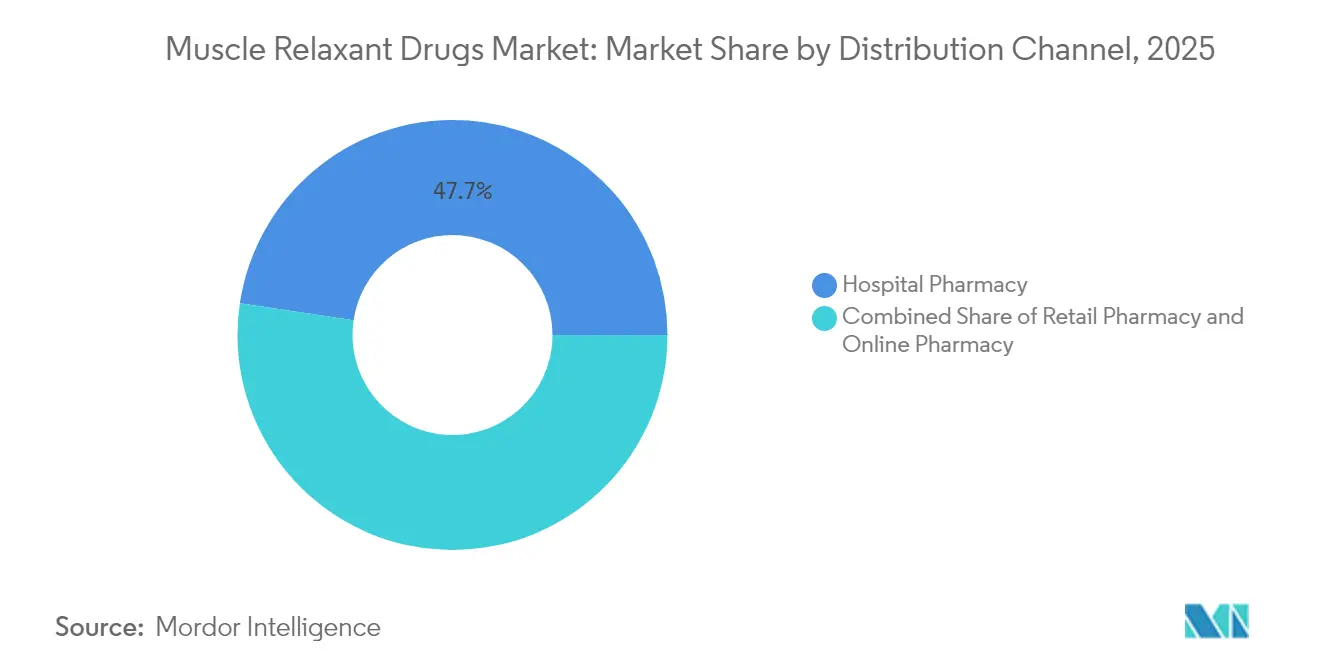
- By distribution channel, hospital pharmacies held 47.65% of the muscle relaxant drugs market size in 2025; online pharmacies record the highest 8.76% CAGR through 2031.
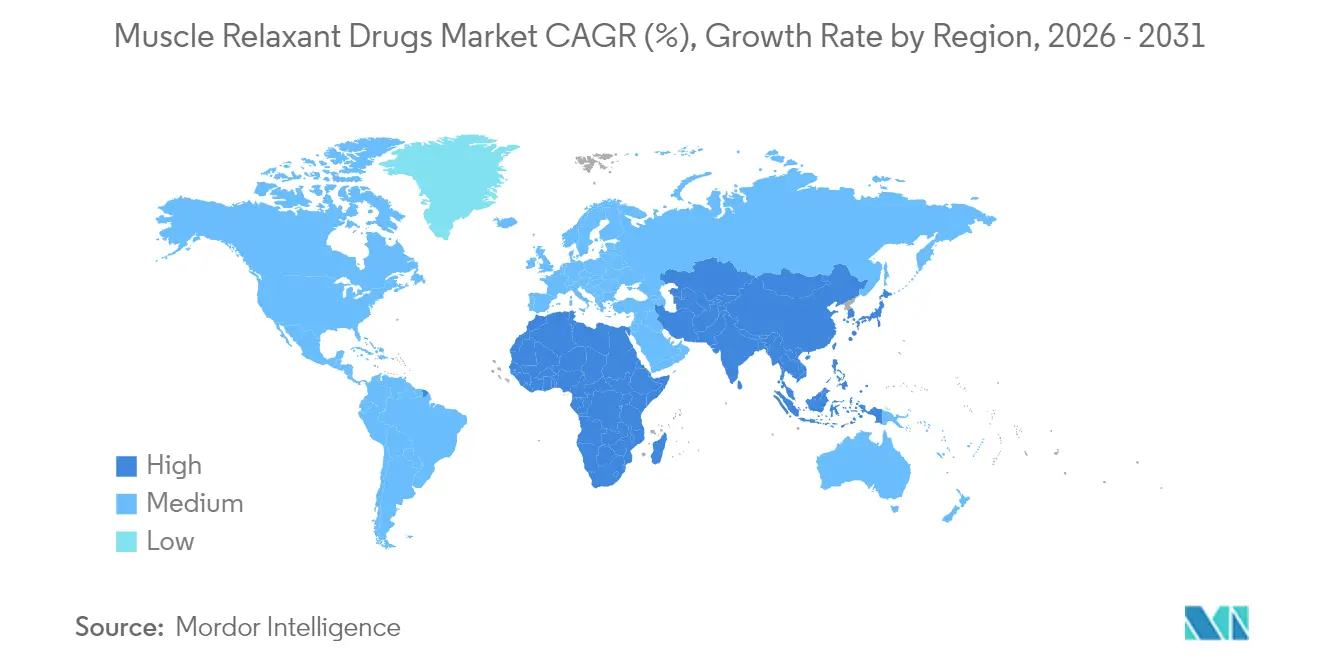
- By geography, North America retained 39.55% share of the muscle relaxant drugs market in 2025, while Asia-Pacific is advancing at an 7.72% CAGR to 2031.
Note: Market size and forecast figures in this report are generated using Mordor Intelligence’s proprietary estimation framework, updated with the latest available data and insights as of 2026.
Global Muscle Relaxant Drugs Market Trends and Insights
Drivers Impact Analysis*
| Driver | (~) % Impact on CAGR Forecast | Geographic Relevance | Impact Timeline |
|---|---|---|---|
| Growing Geriatric Population | +1.2% | Global, with concentration in North America, Europe, and Japan | Long term (≥ 4 years) |
| Increasing Prevalence of Musculoskeletal Disorders | +1.0% | Global, particularly Asia-Pacific and emerging markets | Medium term (2-4 years) |
| Rising Volume of Surgical Procedures Requiring Neuromuscular Blocking Agents | +0.8% | North America & EU, expanding to APAC | Medium term (2-4 years) |
| Growth in Minimally-Invasive Cosmetic Procedures Using Botulinum Toxin | +0.6% | North America, Europe, with growth in Asia-Pacific | Short term (≤ 2 years) |
| Adoption of Personalised Dosing Via Closed-Loop Neuromuscular Monitoring Systems | +0.4% | North America & EU primarily, with technology transfer to APAC | Medium term (2-4 years) |
| Emergence Of Cannabinoid-Derived Spasmolytics with Favourable Safety Profiles | +0.3% | Europe leading, with North America regulatory pathway development | Long term (≥ 4 years) |
| Source: Mordor Intelligence | |||
Growing Geriatric Population
The share of adults aged 55 years and above continues to climb, with global low back pain burden. Japan’s forecasts indicate 26.5% prevalence of low back pain by 2055, underscoring sustained demand for muscle relaxants. Although only 1.5% of U.S. patients aged ≥ 65 receive a prescription at hospital discharge, 10.7% develop prolonged use, raising safety questions. Sarcopenia co-existing with pain elevates disability risk, prompting calls for formulations tailored to older adults’ pharmacokinetics.
Increasing Prevalence of Musculoskeletal Disorders
Musculoskeletal conditions are now the leading global cause of disability. In India, rheumatic diseases impact up to 30% of the population, shifting attention toward cost-effective chronic-care regimens. The burden extends beyond traditional demographics, with knee osteoarthritis emerging as the most prevalent form and high body mass index identified as a primary risk factor, suggesting lifestyle-related expansion of the addressable patient population. Colombia's arthroplasty projections estimate 39,270 procedures by 2050, with 52.7% among women, highlighting the surgical demand that necessitates neuromuscular blocking agents and postoperative muscle relaxant protocols. This epidemiological shift creates opportunities for pharmaceutical companies to develop targeted therapies that address specific musculoskeletal conditions while managing the associated economic and healthcare infrastructure challenges.
Rising Surgical Volumes Requiring Neuromuscular Blocking Agents
Closed-loop advisory systems lower inadequate blockade events from 63% to 27% of patients given rocuronium, demonstrating safety gains.[1]J. Smith et al., “Closed-Loop Rocuronium Administration Reduces Inadequate Blockade,” Anesthesia & Analgesia, anesthesia-analgesia.org Robotic anesthesia prototypes integrate EEG feedback to hold Bispectral Index values within 40-60, pointing toward fully automated delivery platforms by 2030. Such precision amplifies usage of fast-onset agents and reversals, cementing the muscle relaxant drugs market as a core pillar of modern OR workflow.
Growth in Minimally Invasive Cosmetic Procedures Using Botulinum Toxin
FDA clearance of LETYBO in early 2024 extended approved botulinum toxin options for glabellar lines.[2]U.S. Food & Drug Administration, “Drugs@FDA Database,” fda.gov Long-acting DAXXIFY provides 15-28 weeks of effect, double the duration of legacy products, feeding demand for fewer office visits. Updated Korean consensus guidelines refine dosing grids, spreading best practices globally. These clinical advances reinforce aesthetics as an incremental growth engine alongside therapeutic indications.
Restraints Impact Analysis*
| Restraint | (~) % Impact on CAGR Forecast | Geographic Relevance | Impact Timeline |
|---|---|---|---|
| Adverse Effects and Safety Concerns of Muscle Relaxants | -0.7% | Global, with heightened scrutiny in North America and Europe | Short term (≤ 2 years) |
| Patent Expiries Driving Generic Price Erosion | -0.5% | North America & EU primarily, with spillover effects globally | Medium term (2-4 years) |
| Increasing Regulatory Scrutiny on Off-Label Chronic-Pain Use | -0.4% | North America & Europe, with emerging market adoption | Medium term (2-4 years) |
| Supply-Chain Vulnerability for API Precursors | -0.3% | Global, with particular impact on Asia-Pacific manufacturing | Short term (≤ 2 years) |
| Source: Mordor Intelligence | |||
Adverse Effects and Safety Concerns of Muscle Relaxants
Delirium incidence rose to 17.6% among lumbar fusion patients receiving cyclobenzaprine versus 11.4% in controls. FDA adverse-event files list cardiac arrest and anaphylaxis among the most lethal neuromuscular blocker events, prompting tighter monitoring rules. These data heighten payer and clinician scrutiny, moderating uptake of older agents.
Patent Expiries Driving Generic Price Erosion
As Merck’s Bridion loses protection in January 2026, generic challenges under the Hatch-Waxman Act are mounting. FDA records show 23 muscle-relaxant-linked NDAs voluntarily withdrawn since 2023, a marker of margin pressure.[3]U.S. Federal Register, “Notice of NDA Withdrawals,” federalregister.gov Generic sterile injectables face 40% higher discontinuation versus 2022 levels, exposing hospitals to shortages. Innovators are responding with value-added devices and extended-release formats aimed at securing post-patent differentiation.
*Our forecasts treat driver/restraint impacts as directional, not additive. The impact forecasts reflect baseline growth, mix effects, and variable interactions.
Segment Analysis
By Drug Type: Direct-Acting Agents Drive Innovation
Direct-acting compounds are growing at 7.55% CAGR, almost 3 percentage points above the overall muscle relaxant drugs market. Their targeted pathways reduce systemic sedation, an advantage in elderly care and functional rehabilitation. Skeletal muscle relaxants still supply 43.95% of 2025 revenue on the strength of broad musculoskeletal indications. Cannabinoid-derived spasmolytics such as Sativex show clinically significant spasticity relief without detectable muscle weakness in trials involving 500 patients, opening a new therapeutic niche. Botox and newer toxins for instance, DAXXIFY continue to dominate facial aesthetics, a segment forecast to widen as durable formulations improve patient adherence.
Second-generation direct-acting molecules, including selective RyR1 modulators, are progressing through Phase II programs, aiming to treat malignant hyperthermia without residual paralysis. At the other end, classic agents like tizanidine are being reformulated into buccal films to improve onset and bypass hepatic metabolism. This product cycle breadth, from cannabinoid sprays to AI-titrated neuromuscular blockers, underscores how innovation keeps the muscle relaxant drugs market diversified and resilient.




By Formulation: Transdermal Innovation Accelerates
Injectables commanded 54.35% of 2025 spending owing to OR and emergency use; nonetheless, transdermal systems are set to post the highest 8.28% CAGR. Microneedle arrays and iontophoresis patches achieve steady plasma levels and cut first-pass metabolism, especially valuable for short-half-life agents. A cyclobenzaprine-guaifenesin cream has entered compounding pharmacies for localized spasm relief. Quality-by-design frameworks improve permeability, ensuring dose uniformity.
Patient preference studies reveal compliance rates 20-30% higher with patches than with three-times-daily tablets, important for chronic back pain regimens. Hospitals remain dependent on injectables, but ambulatory care favors topicals, creating balanced demand streams within the muscle relaxant drugs market size hierarchy.
By Distribution Channel: Digital Transformation Accelerates
Hospital pharmacies delivered 47.65% of global revenue in 2025, reflecting surgical dependence on rapid-acting neuromuscular blockers. Online pharmacies, however, are the fastest-moving channel at 8.76% CAGR, helped by telemedicine visits and e-prescriptions. Surveys confirm convenience and price as the top two purchase drivers, while demographic factors such as age or education show mixed predictive power.
Regulators influence channel mix: CMS stipulates prior authorization for botulinum toxin under specific CPT codes, requiring 12-week re-evaluation cycles. These administrative rules often push chronic spasticity patients toward mail-order services that automate refill documentation. Retail outlets keep traction for immediate acute-injury scripts, creating a three-way distribution equilibrium within the muscle relaxant drugs market.
Geography Analysis
North America anchors 39.55% of worldwide sales and continues to absorb most injectable neuromuscular blockers used in high-volume orthopedic and cardiovascular surgery. Robust reimbursement through Medicare and private payers supports premium-priced agents, though decade-high generic sterile injectable shortages in 2024 exposed hospitals to case delays and substitution protocols. The 2025 Biosecure Act, restricting Chinese API sourcing, is likely to re-route contracts toward domestic producers, bolstering local capacity expansions already underway.
Europe benefits from centralized EMA reviews that speed market entry for cost-saving generics without compromising safety. Real-world data from Belgium corroborate nabiximols’ utility for multiple sclerosis spasticity, influencing prescribing beyond early-adopter nations. National health systems negotiate aggressive discounts, yet aging demographics and minimally invasive cosmetic demand keep the muscle relaxant drugs market expanding steadily across the EU-27.
Asia-Pacific is the growth engine are growing at 7.72% CAGR. In India, musculoskeletal disorders affect up to one-third of citizens, generating escalating demand for both OTC topicals and hospital-grade injectables. Japan’s forecast that one in four adults will suffer low back pain by 2055 secures a long runway for product uptake. Simultaneously, Chinese provincial tenders reward lowest bids, pressuring margins but incentivizing efficiency gains for manufacturers that can deliver volume with quality assurance. Overall, widening insurance coverage and private hospital chains are cementing the region’s role in future muscle relaxant drugs market size gains.

Regulatory Landscape
Regulation for muscle relaxant drugs spans new approvals, ongoing pharmacovigilance, and standardized drug-utilization classification. In the United States, the FDA continues to approve novel formulations relevant to this market; for example, in August 2025 the FDA approved TONMYA (cyclobenzaprine HCl sublingual tablets) for fibromyalgia in adults, illustrating the agency focus on differentiated delivery approaches in high-unmet-need pain and spasm-related conditions.
In Europe, the EMA Pharmacovigilance Risk Assessment Committee (PRAC) maintains active safety signal detection and periodically recommends updates to product information (SmPC and package leaflets) based on signals reviewed in its 2025 and 2026 meetings, reinforcing post-marketing obligations for centrally authorized products used in anesthesia, spasticity, and related indications. Globally, the WHO Collaborating Centre for Drug Statistics Methodology maintains the ATC framework with M03 for muscle relaxants (including centrally acting M03B and directly acting subgroups), with annual ATC/DDD updates, and the 2026 guidelines effective from January 2026 shaping comparability for prescribing audits, tenders, and real-world utilization reporting.
Competitive Landscape
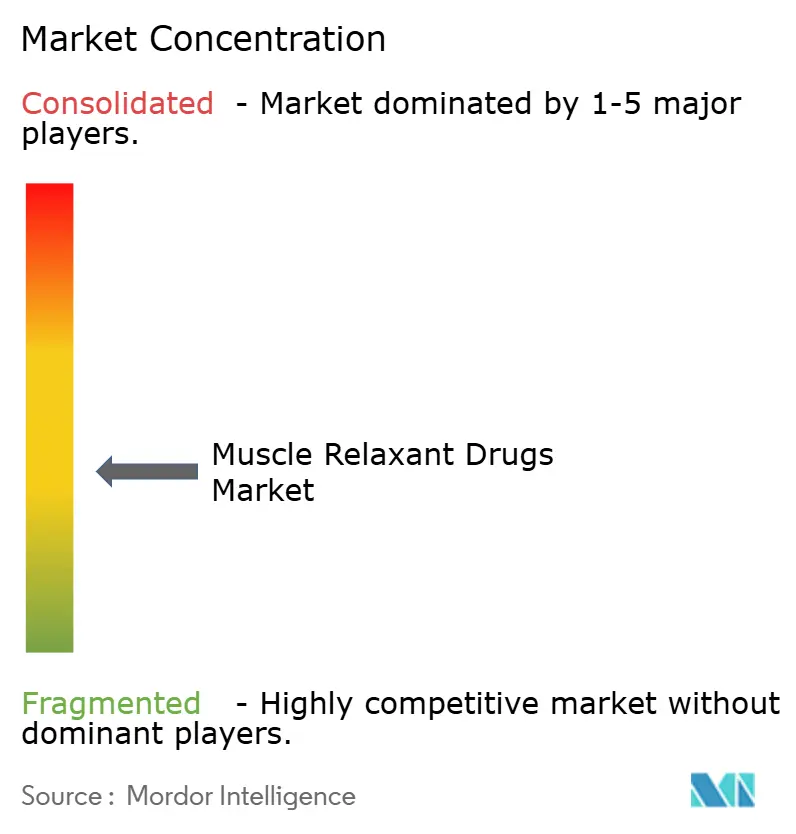
The muscle relaxant drugs industry shows moderate fragmentation. AbbVie leverages a multi-decade evidence base to defend Botox in both therapeutic and cosmetic arenas, countering newcomers with long-acting toxins. Merck’s Bridion registered USD 1.84 billion in 2024 but faces generic entry in 2026, prompting lifecycle management via pediatric extensions and ready-to-use vials. Fulcrum Therapeutics exemplifies how smaller firms secure scale through partnerships; its USD 80 million Sanofi alliance funds losmapimod trials for rare dystrophy.
Technology investments differentiate players: closed-loop dosing software that cut inadequate blockade events by over one-third provides hospitals with quantifiable safety benefits, reinforcing vendor lock-in for compatible agents. Cannabinoid therapeutics create a parallel competitive lane; GW Pharmaceuticals’ Sativex success in Europe foreshadows U.S. entry pending FDA review. Supply-chain resilience is another pivot: firms with dual-continent API plants and redundancy in sterile fill-finish lines gained share during the 2024 injectable shortages an advantage likely to widen as compliance standards tighten.
Strategic moves over the past 18 months include portfolio pruning of low-volume injectables, bolt-on acquisitions for topical pipeline assets, and investments in digital sampling portals that connect dermatologists and neurologists directly with manufacturer representatives. Collectively, these actions illustrate a market where innovation, compliance, and logistical robustness define competitive edge.
Muscle Relaxant Drugs Industry Leaders
Pfizer Inc.
Ipsen Biopharmaceuticals Inc.
Zydus Lifesciences Ltd.
Neurana Pharmaceuticals Inc.
Teva Pharmaceutical Industries Ltd.
- *Disclaimer: Major Players sorted in no particular order

Market Opportunities and Future Outlook
Opportunity centers on differentiating mature molecules through delivery and safety-enabling systems while extending reach into higher-value therapeutic niches. Transdermal and topical innovation provides a practical route to improve adherence and reduce systemic exposure for centrally acting agents used in chronic musculoskeletal conditions; this direction is supported by 2026 academic work demonstrating a tizanidine hydrochloride nanostructured lipid carrier transdermal patch with materially higher bioavailability and 24-hour sustained release in preclinical models, aligning with the market shift toward convenience-oriented formats.
In hospital settings, whitespace remains in anesthesia workflow solutions that pair neuromuscular blockers with monitoring and reversal advances to reduce adverse events and variability in blockade management. 2026 literature attention on next-generation reversal chemistry (for example, calabadion 2 discussed in reviews of neuromuscular blocking agents) and preclinical reports of short-acting, rapid-recovery non-depolarizing candidates highlight ongoing R&D aimed at faster recovery profiles and improved controllability. Separately, strategic capital allocation toward neuromuscular and muscle-function disorders signals adjacent expansion paths for companies active around spasticity and neuromuscular care; for instance, Servier completed the acquisition of Edgewise Therapeutics muscular dystrophy business in July 2026 to secure a late-stage asset in dystrophinopathies, reinforcing industry interest in moving beyond symptomatic relief toward targeted neuromuscular therapies that can be co-managed alongside spasticity and rehabilitation pathways.
Recent Industry Developments
- July 2026: Servier completed the acquisition of the muscular dystrophy business of Edgewise Therapeutics for up to USD 2.65 billion, adding the late-stage asset sevasemten for Becker and Duchenne muscular dystrophies. The deal broadens Servier's neuromuscular footprint and increases competitive focus on disease-modifying approaches that sit adjacent to symptomatic spasticity and muscle-function management.
- May 2026: Ipsen presented late-breaking data on Dysport in adults with upper limb spasticity, supporting non-inferior safety and longer-lasting symptom control, reinforcing differentiation in a high-volume neurotoxin segment.
- September 2024: Piramal Pharma Solutions announced an approximately USD 80 million expansion of its Kentucky sterile injectables facility, targeting a capacity increase to more than 240 product batches annually by Q1 2027. Scaling sterile fill-finish capability addresses a critical constraint for injectable neuromuscular blocking agents and related hospital-use products where reliability of supply influences formulary choice and substitution practices.


Research Methodology Framework and Report Scope
Market Definition and Coverage
For this study, the muscle relaxant drugs market is defined as prescription and administered therapies used to reduce muscle spasms, stiffness, or muscle tone, and the value is tracked as the revenues generated from these products across major care settings.
Scope exclusions: this sizing does not count physical therapy services, non-drug pain management procedures, or OTC topical rubs that are not regulated as drug products.
Segmentation Overview
- By Drug Type
- Facial Aesthetic Relaxants
- Skeletal Muscle Relaxants
- Neuromuscular Blocking Agents
- Direct-Acting Muscle Relaxants
- By Formulation
- Oral
- Injectable
- Transdermal/Topical
- By Distribution Channel
- Hospital Pharmacy
- Retail Pharmacy
- Online Pharmacy
- By Geography
- North America
- United States
- Canada
- Mexico
- Europe
- Germany
- United Kingdom
- France
- Italy
- Spain
- Rest of Europe
- Asia-Pacific
- China
- Japan
- India
- Australia
- South Korea
- Rest of Asia-Pacific
- Middle East & Africa
- GCC
- South Africa
- Rest of Middle East & Africa
- South America
- Brazil
- Argentina
- Rest of South America
- North America
Data Sources, Market Sizing, and Validation
Desk Research
Desk work starts by aligning the drug scope and the demand pool, then mapping where value is recorded in the healthcare system. Public sources, such as US FDA drug labels and the approvals database, the US CDC health statistics, US Centers for Medicare and Medicaid Services (CMS) spending and utilization releases, and the WHO Global Health Observatory, are used to understand treatment settings and usage patterns.
We then pull supporting indicators from sources such as OECD health data, national health ministry and reimbursement portals, peer reviewed journals indexed on PubMed, and customs or trade summaries where relevant for active ingredients and finished-dose trade flows. Company filings and investor decks help validate therapy focus, mix changes, and geographic exposure, and a paid subscription covering company financials and news is used selectively to cross-check timelines and major product events. These examples are not exhaustive, and many other public and paid sources were also referred to for data collection, validation, and clarification.
Primary Interviews and Surveys
Fieldwork is used to translate the desk view into realistic assumptions for volumes, pricing, and channel mix. We speak with hospital pharmacists, neurologists, anesthesiology-related stakeholders, pain and rehabilitation focused clinicians, and distributors, which helps close gaps around prescribing preferences, switching triggers, and the share of injectable use.
Inputs are checked across major regions so the model reflects local reimbursement behavior, generic uptake speed, and typical treatment duration, and then the final assumptions are reconciled back to what payers and providers report is happening on the ground.
Distribution of primary research fieldwork respondents
| Company type | Respondent position | Region |
|---|---|---|
| Top tier: 27% | CXOs: 15% | APAC: 44% |
| Mid tier: 58% | Functional/Unit leaders: 40% | EMEA: 29% |
| Smaller Players: 15% | Managers: 45% | Americas: 27% |
Market-Sizing & Forecasting
Sizing is built using a top-down demand pool reconstruction, where treated patients and procedure volumes are translated into therapy volumes, and those therapy volumes are priced using typical dose and pack economics. For muscle relaxant drugs, the core inputs include diagnosed and treated spasticity and acute musculoskeletal pain cohorts, inpatient surgical volumes linked to neuromuscular blockade use, average treatment duration by setting, generic substitution rates, and route of administration split (oral versus injectable).
To keep totals realistic, we corroborate outcomes with selective bottom-up approximations, such as sampled price per pack multiplied by estimated packs per treated patient, channel checks on hospital versus retail shares, and a limited roll-up of key product families across large countries. Where direct volume signals are thin, gaps are handled using proxy indicators (for example, procedure growth and payer coverage changes), and then the range is tightened using clinician feedback.
Forecasts are derived using multivariate regression with scenario checks, so the outlook is tied to a small set of drivers that can be explained and refreshed each year. In practice, assumptions for surgery trends, aging-linked neurology burden, pricing pressure from generics, and formulary tightening are reviewed with experts, then applied consistently across regions and care settings.
Data Validation & Update Cycle
Outputs are validated through multi-step checks that compare modeled value against independent signals, such as procedure trend lines, reimbursement changes, and expected generic penetration timing. When a country or segment shows a sharp jump that cannot be explained by a real market event, the driver inputs are rechecked and follow-up calls are triggered to confirm what changed.
Before sign-off, the model and assumptions are reviewed by another analyst, followed by a final consistency pass across regions, routes of administration, and distribution channels. Reports are refreshed annually, and interim updates are made when material events occur, such as policy shifts, major label changes, or supply disruptions. Right before delivery, we run a fresh update sweep so clients receive the latest view available.
Mordor Intelligence's Muscle Relaxant Drugs Market Size Compared With Other Published Estimates
Published market values for muscle relaxant drugs can differ because each source uses its own scope, pricing logic, and timing for currency conversion and updates. Variations also show up when one estimate relies more on shipment value, while another relies more on demand-side treatment volumes.
The main gap comes from whether neuromuscular blocking agents used in surgical anesthesia are treated as a full market pillar or only counted when they are clearly within muscle relaxant therapy tracking, and this is handled as an explicit inclusion rule in Mordor Intelligence's model. Some estimates also apply faster price growth or do not separate oral and injectable usage by care setting, which can inflate value when generic erosion is strong.
Benchmark comparison
| Source | Market Size | Gaps in Research Methodology |
|---|---|---|
| Mordor Intelligence | USD 4.25 B (2025) | |
| Trade Publisher A | USD 5.11 B (2025) | Uses a manufacturer-level value concept and can include broader service components around sales, which can lift totals versus end-market revenues captured through care-setting mix and net pricing assumptions. |
| Industry Data Portal B | USD 4.90 B (2024) | Anchors the base year on a different timing and may not fully normalize generic price erosion and route mix, which can shift the starting value upward when injectables and branded carryover are assumed higher. |
The spread across sources is mainly explained by scope treatment for anesthesia-linked products, plus differences in how pricing is adjusted for generic uptake and channel mix. By tying the model to treated demand indicators and then cross-checking with practical price and mix signals, the final value stays traceable to clear steps that can be repeated and updated.


Key Questions Answered in the Report
What is the current value of the muscle relaxant drugs market?
The muscle relaxant drugs market stands at USD 4.46 billion in 2026.
How fast is the muscle relaxant drugs market expected to grow?
It is projected to register a 4.98% CAGR, reaching USD 5.69 billion by 2031.
Which drug type leads the market today?
Skeletal muscle relaxants hold the largest 43.95% share, mainly for post-operative and musculoskeletal disorder care.
Why are transdermal formulations gaining popularity?
Microneedle and iontophoretic patches improve compliance and bypass first-pass metabolism, driving an 8.28% CAGR for this segment.
Which region will grow the fastest?
Asia-Pacific is forecast to expand at an 7.72% CAGR due to aging populations and improved healthcare access.
What major risk could slow market expansion?
Adverse-event concerns, especially in older adults, continue to trigger stricter prescribing guidelines that may temper uptake.
Page last updated on:





