Molecular Cytogenetics Market Size and Share
Market Overview
| Study Period | 2020 - 2031 |
|---|---|
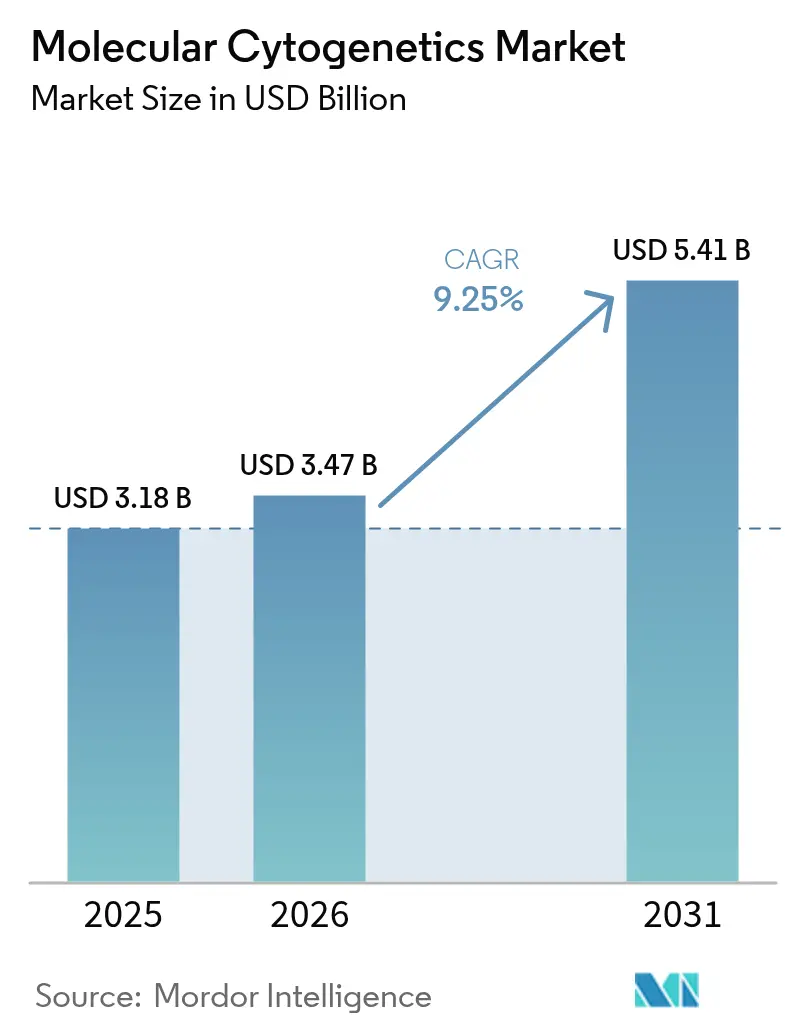
| Market Size (2026) | USD 3.47 Billion |
| Market Size (2031) | USD 5.41 Billion |
| Growth Rate (2026 - 2031) | 9.25% CAGR |
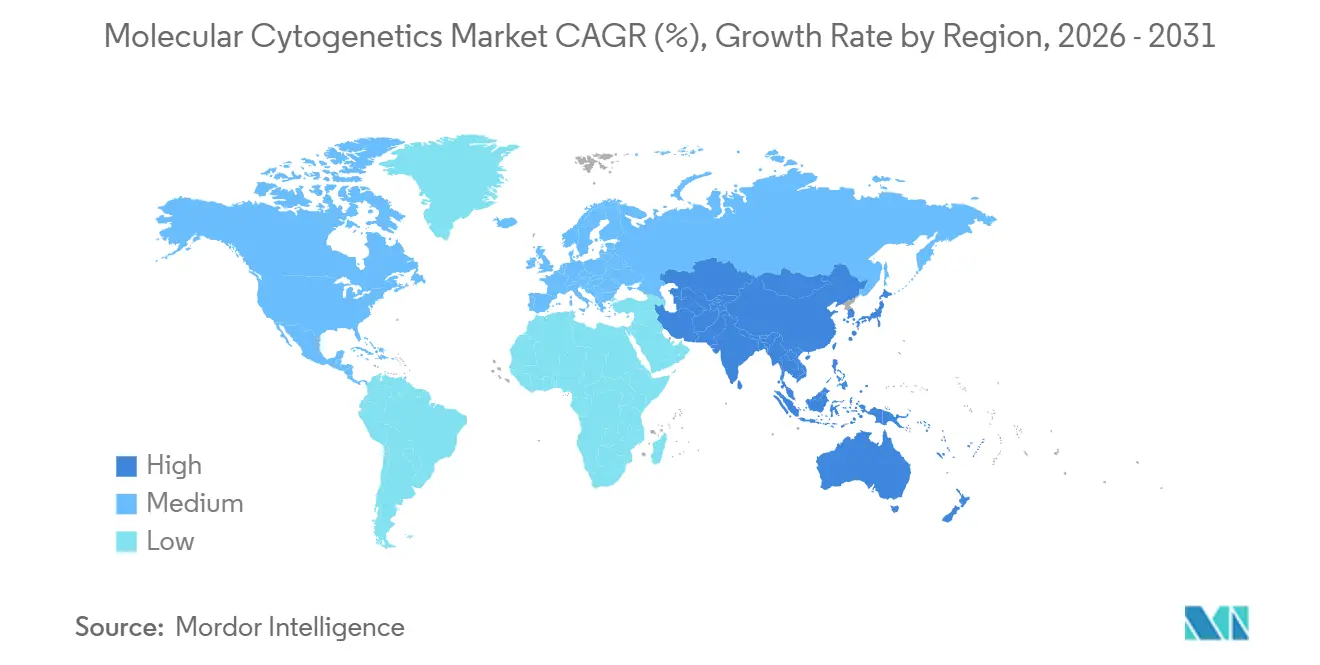
| Fastest Growing Market | Asia Pacific |
| Largest Market | North America |
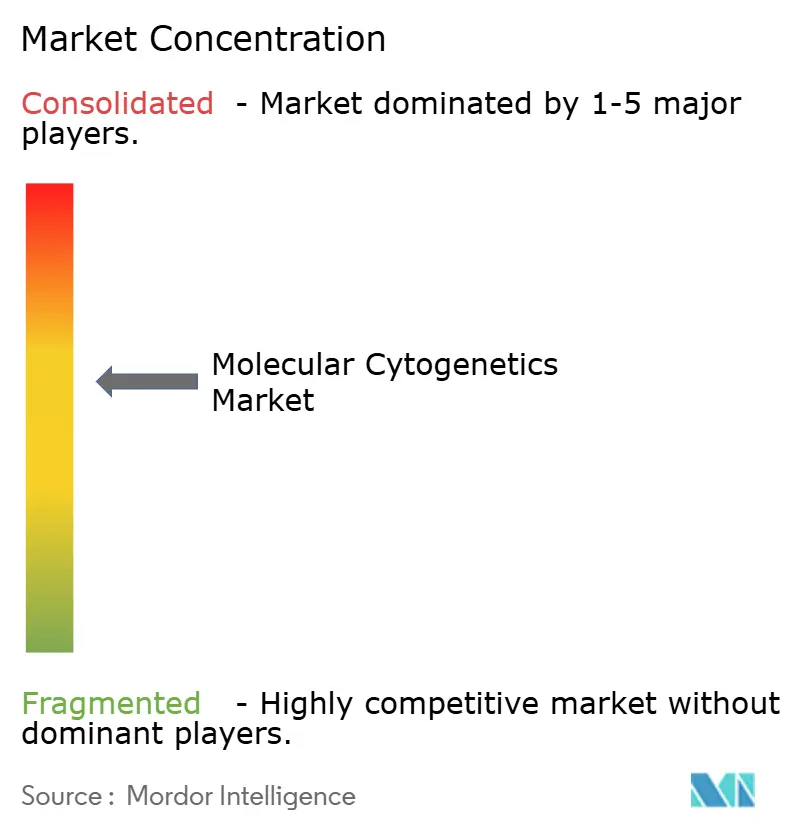
| Market Concentration | Medium |
Major Players *Disclaimer: Major Players sorted in no particular order Image © Mordor Intelligence. Reuse requires attribution under CC BY 4.0. | |
Molecular Cytogenetics Market Analysis by Mordor Intelligence
The Molecular Cytogenetics Market size was valued at USD 3.18 billion in 2025 and is estimated to grow from USD 3.47 billion in 2026 to reach USD 5.41 billion by 2031, at a CAGR of 9.25% during the forecast period (2026-2031).
Standardized regulatory pathways from the FDA, expanded reimbursement for oncology‐focused genetic tests, and rapid convergence of AI with image‐based genomics keep demand on an upward trajectory. Consolidation among smaller laboratories unable to meet the new compliance workload is reshaping competitive dynamics toward integrated platform providers. Companion diagnostics aligned with targeted therapies now form the commercial backbone of routine cytogenetic testing, spurring continuous menu expansion. Laboratories are also accelerating digital transformation to cope with higher specimen volumes, fueling double-digit growth in software solutions that automate karyotype interpretation and integrate cloud-based reporting.
Key Report Takeaways
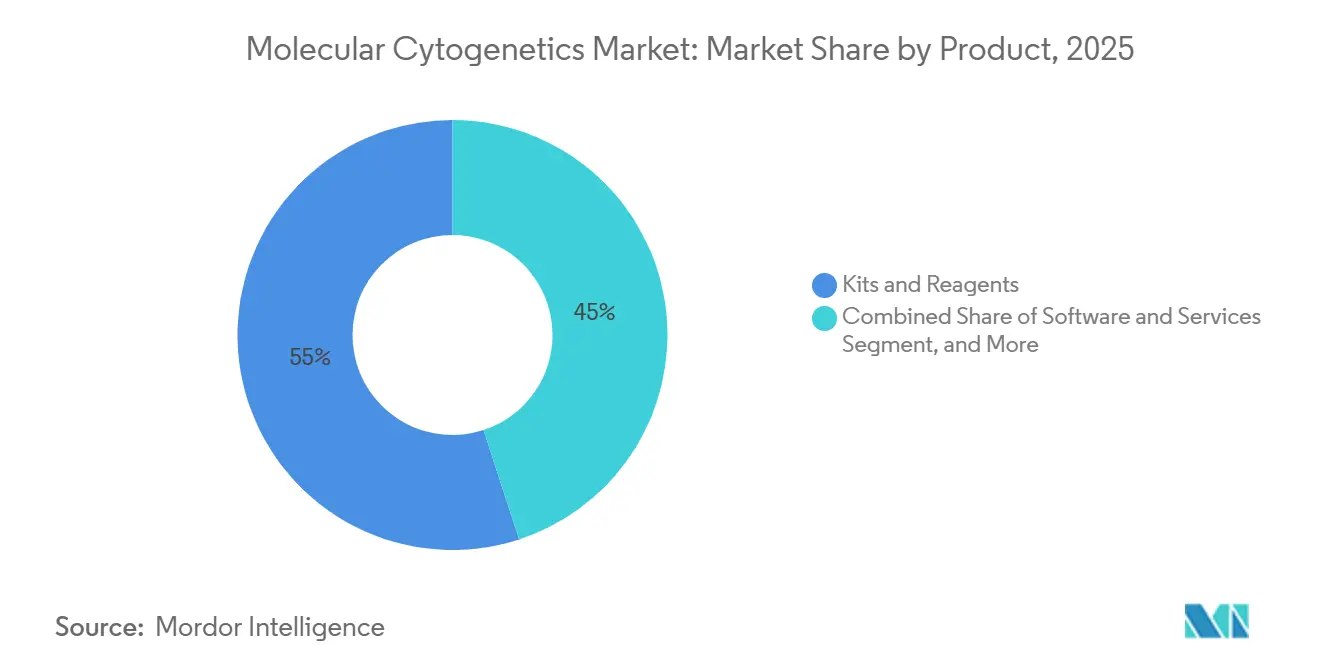
- By product type, kits and reagents led with a 55.02% share of the molecular cytogenetics market size in 2025; software and services are advancing at a 12.08% CAGR through 2031.
- By technique, fluorescence in situ hybridization accounted for 58.21% of the molecular cytogenetics market share in 2025, while array comparative genomic hybridization is projected to expand at a 15.60% CAGR to 2031.
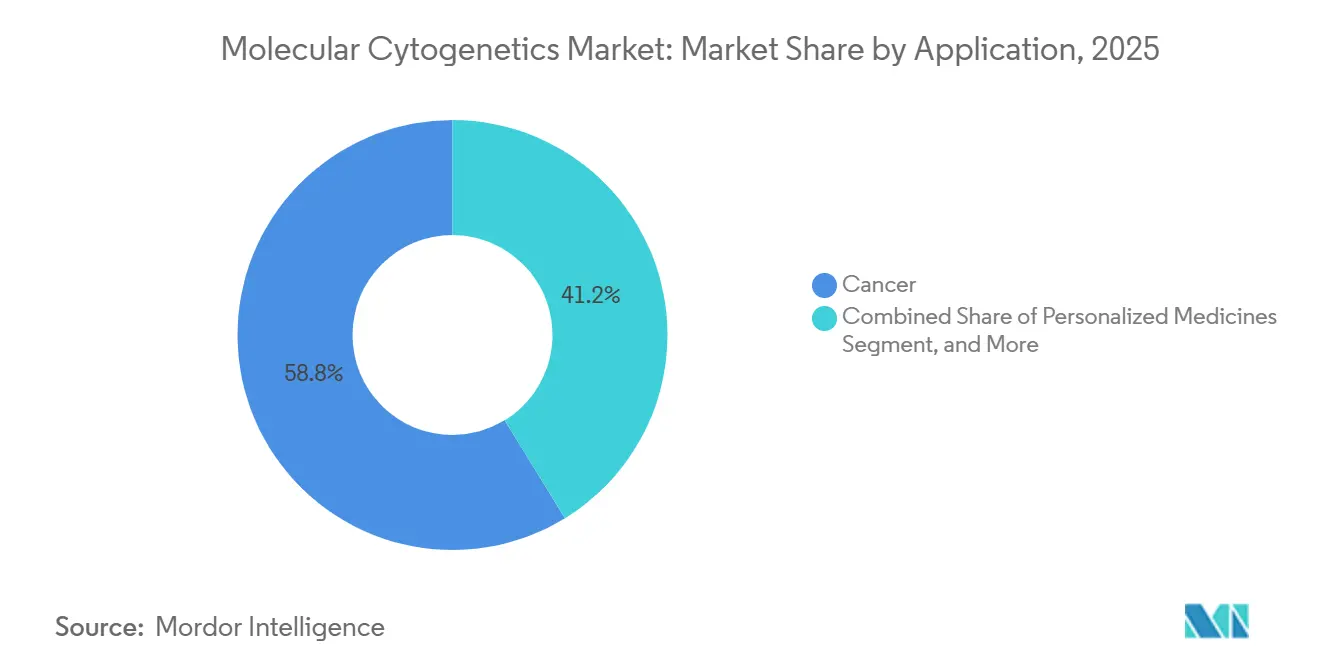
- By application, cancer testing accounted for 58.76% of revenue in 2025, and personalized-medicine workflows are growing at a 17.55% CAGR over the forecast period.
- By end user, clinical and research laboratories captured 46.35% of 2025 revenue, whereas pharmaceutical, biotechnology companies, and contract research organizations are growing at 13.78% a year.
- By region, North America commanded 37.21% of the revenue share in 2025; Asia-Pacific is the fastest-growing region at a 11.22% CAGR through 2031.
Note: Market size and forecast figures in this report are generated using Mordor Intelligence’s proprietary estimation framework, updated with the latest available data and insights as of 2026.
Global Molecular Cytogenetics Market Trends and Insights
Drivers Impact Analysis*
| DRIVER | (~) % IMPACT ON CAGR FORECAST | GEOGRAPHIC RELEVANCE | IMPACT TIMELINE |
|---|---|---|---|
| Rising prevalence of cancer & genetic disorders | +2.1% | Global, highest in North America, Europe, aging APAC populations | Long term (≥ 4 years) |
| Increasing focus on targeted therapies & companion diagnostics | +1.8% | North America and EU, early adoption in Japan and South Korea | Medium term (2-4 years) |
| Expansion of public / private funding for genomic research | +1.5% | North America, EU, China | Medium term (2-4 years) |
| Rapid adoption of personalized-medicine-centric testing | +1.9% | Global, led by North America, Western Europe, urban APAC hubs | Medium term (2-4 years) |
| Automation and AI-enabled digital cytogenetics | +1.4% | North America and EU, spillover to Middle East reference labs | Short term (≤ 2 years) |
| Emergence of cloud-based image-analysis platforms | +1.2% | Global, strongest regulatory tailwinds in North America | Medium term (2-4 years) |
| Source: Mordor Intelligence | |||


Rising Prevalence of Cancer & Genetic Disorders
Global oncology cases are increasing steadily. The American Cancer Society reported 2.0 million new cancer diagnoses in the United States for 2025, reflecting a 1.3% rise from 2024.[1]American Cancer Society, “Cancer Facts & Figures 2025,” cancer.org Approximately 10% of these cases involve hematologic malignancies, requiring continuous cytogenetic monitoring to guide treatment. Similarly, chromosomal disorders, which affect 3% of live births annually in the United States, highlight the growing need for such monitoring. Prenatal guidelines now recommend chromosomal microarray analysis for fetuses with ultrasound-detected anomalies, expanding the eligible population. The World Health Organization projects a 47% global increase in cancer incidence by 2040, with the most significant growth expected in Asia-Pacific and sub-Saharan Africa.[2]National Cancer Institute, “NCI Budget and Appropriations,” cancer.gov These trends ensure sustained demand for molecular cytogenetics.
Increasing Focus on Targeted Therapies & Companion Diagnostics
Validated cytogenetic biomarkers are critical for advancing precision medicine. In 2024, the FDA granted 67 Breakthrough Therapy designations in oncology, of which 41% required cytogenetic or molecular stratification.[3]U.S. Food and Drug Administration, “Breakthrough Therapy Designations,” fda.gov FoundationOne CDx expanded its diagnostic capabilities in 2025 by including HER2 amplification via FISH. European and Japanese regulators now require analytical validation of FISH probes, aligning reimbursement criteria. Additionally, drug sponsors are increasingly using FISH or array CGH for patient screening in basket trials, driving test volumes before commercial launches.
Expansion of Public / Private Funding for Genomic Research
The National Cancer Institute allocated USD 180 million in 2025 to its Cancer Moonshot Biobank, aiming to karyotype 500,000 participants by 2028.[4]National Cancer Institute, “NCI Budget and Appropriations,” cancer.gov By December 2025, NHGRI’s All of Us program had enrolled 413,000 volunteers, each slated for an array CGH. China's Precision Medicine Initiative is investing RMB 8 billion (USD 1.1 billion) in cytogenetics infrastructure for smaller cities. The United Kingdom has earmarked USD 1.5 billion to integrate cytogenetic validation into 500,000 whole-genome sequences. These investments support instrument acquisitions and reagent usage, strengthening the molecular cytogenetics market.
Rapid Adoption of Personalized-Medicine-Centric Testing
Hospital laboratories are now combining karyotyping, FISH, and pharmacogenomics into a single work order. A 2025 survey by the College of American Pathologists revealed that 68% of laboratories in the United States now reflex to FISH for abnormal karyotypes, up from 52% in 2023. In 2025, Mayo Clinic introduced a panel combining FISH for MYC, BCL2, and BCL6 with next-generation sequencing, significantly reducing the time to therapy decisions. Guidelines from the American Society of Hematology recommend quarterly FISH monitoring in acute lymphoblastic leukemia, tripling the testing frequency per patient. AI decision-support systems now identify cases for reflex cytogenetics, reducing unnecessary orders while maintaining sensitivity at tertiary centers.
Restraints Impact Analysis*
| RESTRAINT | (~) % IMPACT ON CAGR FORECAST | GEOGRAPHIC RELEVANCE | IMPACT TIMELINE |
|---|---|---|---|
| High capital cost of high-throughput instruments & fish imagers | -1.3% | Global, strongest in low- and middle-income nations | Medium term (2-4 years) |
| Shortage of trained cytogenetic technologists | -0.9% | North America and EU, extending to Middle East and APAC | Long term (≥ 4 years) |
| Data-sovereignty compliance burden | -0.6% | EU (GDPR), China (PIPL), selective impact in North America | Medium term (2-4 years) |
| Reimbursement delays for array-based prenatal panels | -0.7% | North America (CMS), some EU states, emerging APAC | Medium term (2-4 years) |
| Source: Mordor Intelligence | |||
High Capital Cost of High-Throughput Instruments & FISH Imagers
Acquisition of automated FISH scanners and array systems can exceed USD 1 million per platform, burdening midsize laboratories with multi-year depreciation schedules. AI‐enabled image-analysis modules add software licensing fees that further lift the entry bar. Although leasing programs exist, they often lock buyers into consumable minimums that crimp operating margins. Capital pressure is especially acute for facilities aspiring to build full-service menus that span FISH, aCGH, and optical genome mapping.
Shortage of Trained Cytogenetic Technologists in Clinical Labs
Retirement of senior technologists and limited enrollment in specialist programs are widening the talent gap. Even with high degrees of automation, verification of complex rearrangements and rare structural variants still demands human oversight. Training cycles run two to three years, so relief lags well behind demand growth. Laboratories compensate by outsourcing advanced cases or narrowing testing scopes, both of which temper the molecular cytogenetics market trajectory.
*Our forecasts treat driver/restraint impacts as directional, not additive. The impact forecasts reflect baseline growth, mix effects, and variable interactions.
Segment Analysis
By Product: Shift From Reagent Dominance to Subscription Software
Software currently represents the most dynamic growth lever in the molecular cytogenetics market with a 12.08% forecast CAGR. While kits and reagents captured a 55.02% revenue slice in 2025, laboratories are channeling fresh capital toward cloud-native analytics that cut manual review time by half and enable decentralized case sign-out. One proof point is the CHROMA foundation model trained on 4 million chromosomal images, a resource that now underpins automated metaphase spread interpretation. Commercial platforms integrate continuous AI updates without hardware swaps, stretching the useful life of installed microscopes.
Services run in parallel with software, as remote bioinformaticians deliver on-demand validation for smaller sites that lack in-house cytogeneticists. Consumables remain indispensable, especially single-use probe sets tailored to tumor-specific abnormalities. Yet the convergence of cloud, AI, and micro-service billing is steadily redirecting spending patterns. Instruments still matter, but upgrades are software-centric, tilting revenue mix toward digital segments. The upshot is a broad redistribution of the molecular cytogenetics market size rather than a simple volume uplift.


By Technique: Array CGH Accelerates While FISH Retains Clinical Entrenchment
FISH retained 58.21% molecular cytogenetics market share in 2025 because clinicians trust its time-tested accuracy and regulators grant it clear coding pathways. Nonetheless, aCGH is gaining velocity with a 15.60% forecast CAGR due to its genome-wide coverage and scalability. Hybrid techniques are also emerging; immunophenotyped-suspension-multiplex FISH can now detect multiple translocations in one run.
Optical genome mapping complements these methods, adding a 15% diagnostic uplift in hematologic malignancies over karyotyping alone. Laboratories are therefore blending modalities to maximize resolution and turnaround time. This multimodal toolkit underscores why future procurement strategies will revolve around flexible platforms capable of handling diverse probe chemistries and array formats.
By Application: Personalized Medicine Tops Growth Rankings
Cancer testing formed the anchor of routine ordering patterns, accounting for 58.76% of 2025 revenues. Targeted therapy rollouts keep cytogenetic assays front-and-center because chromosomal translocations and copy-number changes inform drug selection and resistance monitoring. Personalized medicine postings, though smaller in absolute value, are projected to climb 17.55% annually as payers endorse genomic-guided treatment pathways. Prenatal and genetic-disorder panels hold steady demand in public-health screening programs, yet oncology’s revenue weight makes it the barometer for technology adoption cycles.
Convergence between personalized medicine and oncology means every actionable finding can support both diagnosis and dose optimization, blurring traditional application boundaries. That synergy elevates the molecular cytogenetics industry profile among hospital executives tasked with precision-medicine rollouts. Commercial menus increasingly package FISH, aCGH, and optical mapping into comprehensive panels to satisfy oncologists’ appetite for single-specimen solutions.
By End User: Pharma and CROs Drive Upstream Adoption
Clinical and research laboratories processed nearly half of all tests in 2025 with a share of 46.35%, reflecting entrenched ordering pathways and established reimbursement mechanisms. Advanced referral centers continue to add high-throughput scanners, but incremental gains are capped by staff shortages. The faster climb belongs to pharmaceutical and biotechnology companies and CROs, where a 13.78% CAGR stems from genomic stratification inside phase III oncology trials. Companion-diagnostic co-development drives platform standardization, making vendor relationships with drug sponsors critical.
Hospitals value turnkey workflows with minimal manual touchpoints, while contract research organizations embrace cloud dashboards that support data-rich regulatory submissions. Academic consortia, funded under national genomics grants, also swell demand for high-resolution mapping of complex structural variants. Collectively these patterns diversify revenue streams and buffer suppliers from cyclical swings in any single customer class.
Geography Analysis
North America retained 37.21% of the molecular cytogenetics market in 2025, a position safeguarded by Medicare reimbursement expansions for oncology genomics and by the FDA’s modernization of laboratory-developed test oversight. Roche’s USD 50 billion outlay on US diagnostics infrastructure including new AI research hubs signals long-term confidence in domestic demand. Canada and Mexico ride piggyback on regional supply chains, broadening access to companion diagnostics without shouldering full development costs.
Europe remains a mature but opportunity-rich arena. The UK’s USD 190 million genomics investment supports pan-European data-sharing pilots, and device reclassifications across the EU shorten certification timeframes. Yet strict data-sovereignty rules can slow the shift to cloud-based imaging archives, obliging vendors to offer on-premise encryption modules. High cancer incidence and universal health coverage nonetheless ensure steady specimen volumes across Germany, France, and the Nordics. Asia-Pacific records the fastest 11.22% CAGR, driven by China’s population-scale oncology sequencing, Japan’s reimbursement of precision-medicine panels, and India’s rapidly expanding private hospital sector. Government grant programs underwrote multiple national biobank projects in 2024, widening laboratory networks that previously focused on infectious disease surveillance. Australia’s USD 500 million decade-long genomics commitment further cements regional momentum. Middle East & Africa and South America sit on the adoption curve’s early slope, yet rising cancer prevalence and diagnostics capacity building hint at an uptick in cytogenetic orders over the forecast horizon.

Competitive Landscape
Competition is moderately fragmented, with the top five suppliers collectively controlling significant market share of the molecular cytogenetics market. Thermo Fisher Scientific, Illumina, Abbott, Roche, and Bio-Rad anchor the segment through vertically integrated portfolios that span probes, hardware, and analytics. Thermo Fisher flagged a USD 40-50 billion war chest for acquisitions, reinforcing investor expectations of further consolidation bioprocessintl.com. Illumina’s TruSight Oncology Comprehensive won the FDA’s first pancancer IVD clearance, cementing the firm’s leadership in hybrid sequencing-cytogenetic workflows.
Abbott refocused on AI-enhanced imaging kits compatible with existing metabolomics platforms, highlighting cross-business synergies. Roche’s mega-investment in US facilities underscores a pivot toward point-of-care cytogenetics, while BD’s tie-up with Quest Diagnostics for flow-cytometry-based companion diagnostics illustrates cross-modality integration. Meanwhile, software-centric entrants exploit regulatory easing around digital pathology to deliver SaaS interpretation layers that sit on top of commodity imaging hardware. Optical genome-mapping specialists target unmet needs in structural-variant discovery, particularly in hematologic oncology, thus expanding the addressable pool of end users. Together, these moves create a marketplace where differentiation now hinges on informatics horsepower as much as reagent chemistry.
Molecular Cytogenetics Industry Leaders
Agilent Technologies, Inc.
Bio-Rad Laboratories, Inc.
F.Hoffmann-La Roche Ltd.
PerkinElmer, Inc.
Thermo Fisher Scientific Inc.
- *Disclaimer: Major Players sorted in no particular order

Recent Industry Developments
- March 2026: Bionano Genomics attended the 2026 American College of Medical Genetics and Genomics Annual Meeting (ACMG), held from March 14–18 in Baltimore, Maryland. The event underscored advancements in molecular cytogenetics, with clinical researchers showcasing the growing potential of Optical Genome Mapping (OGM). Their findings highlighted OGM's pivotal role in advancing cytogenetics and complementing molecular genome analysis methods.
- October 2025: Bio-Techne and Oxford Nanopore extended their alliance to 2032, integrating RNAscope spatial transcriptomics with nanopore sequencing for tissue-context structural-variant analysis.
- April 2025: Roche unveiled a USD 50 billion investment plan spanning new U.S. gene-therapy manufacturing and AI diagnostics centers, reinforcing leadership in advanced molecular testing.


Research Methodology Framework and Report Scope
Market Definitions and Key Coverage
Our study defines the molecular cytogenetics market as every revenue stream generated worldwide from instruments, kits and reagents, purpose-built software, and related analytical services used to detect chromosomal and sub-chromosomal variations through fluorescence in-situ hybridization (FISH), array/comparative genomic hybridization (aCGH/CGH), karyotyping, and closely allied probe-based techniques. Mordor Intelligence groups these offerings because, taken together, they enable clinicians and researchers to visualize genomic aberrations that lie beyond the reach of routine cytogenetics but before full next-generation sequencing.
Scope exclusion: Conventional G-band karyotyping performed without fluorescence or molecular probes is excluded from our sizing.
Segmentation Overview
- By Product
- Instruments
- Kits & Reagents
- Software & Services
- By Technique
- Fluorescence in Situ Hybridization (FISH)
- Array Comparative Genomic Hybridization
- Karyotyping
- Other Techniques
- By Application
- Genetic Disorders
- Cancer
- Personalized Medicines
- Other Applications
- By End User
- Clinical and Research Laboratories
- Hospitals and Reference Centres
- Academic and Government Institutes
- Pharmaceutical, Biotechnology Companies and CROs
- By Geography
- North America
- United States
- Canada
- Mexico
- Europe
- Germany
- United Kingdom
- France
- Italy
- Spain
- Rest of Europe
- Asia-Pacific
- China
- India
- Japan
- Australia
- South Korea
- Rest of Asia-Pacific
- Middle East and Africa
- GCC
- South Africa
- Rest of Middle East and Africa
- South America
- Brazil
- Argentina
- Rest of South America
- North America
Detailed Research Methodology and Data Validation
Primary Research
Interviews were conducted with laboratory directors, hospital pathologists, probe manufacturers, and regional health procurement officials across North America, Europe, Asia-Pacific, and Latin America. These conversations validated shipment volumes, average test throughput, and price erosion assumptions, while short online surveys with CRO scientists clarified emerging demand in personalized oncology panels.
Desk Research
We began by extracting trade and clinical usage data from open, high-quality sources such as the U.S. National Cancer Institute SEER program, Eurostat health statistics, Japan's MHLW cancer registry, and trade shipment logs from Volza. Market context was deepened through association white papers issued by the American Society of Human Genetics and the European Society of Medical Oncology, which clarify emerging diagnostic pathways. Company 10-Ks, investor decks, and selected peer-reviewed articles supplied average selling prices, kit utilization rates, and lab adoption curves. D&B Hoovers and Questel's patent analytics then helped us benchmark supplier revenues and pipeline intensity. The sources listed serve as examples; many additional publications were reviewed to cross-check and refine data points.
Market-Sizing & Forecasting
A top-down model starts with cancer and genetic-disorder testing volumes reported by public health agencies; penetration rates for molecular cytogenetic methods are applied to build a demand pool, which is then multiplied by region-specific blended ASPs. Supplier roll-ups from public financial filings and selective channel checks offer a bottom-up sense check before final adjustments. Key variables tracked include annual oncology biopsy counts, the proportion of prenatal screens escalated to FISH/aCGH, average reagent consumption per slide, instrument replacement cycles, and regional reimbursement shifts. Forecasts through 2030 rely on multivariate regression that ties testing volumes to cancer incidence projections, declining kit prices, and forecast lab capacity expansions agreed upon during expert interviews. Gaps in bottom-up inputs (for example, private lab throughput) are bridged by triangulating shipment data with reagent reorder frequencies.
Data Validation & Update Cycle
Outputs pass three gates: automated variance scans, senior analyst peer review, and a follow-up call with at least one earlier interviewee. Reports refresh annually; interim reviews are triggered when notable events (major regulatory approvals or pricing resets) move underlying variables. A final pre-publication audit ensures clients always receive the freshest view.
Why Mordor's Molecular Cytogenetics Baseline Earns Trust
Published market values often diverge because firms choose differing product scopes, apply unique price erosion curves, or update models on uneven schedules.
Key gap drivers include narrower definitions that omit software and service revenues, reliance on limited regional data, static ASP assumptions, and less frequent model refreshes; elements our team actively addresses through the methods described above.
Benchmark comparison
| Market Size | Anonymized source | Primary gap driver |
|---|---|---|
| USD 3.18 B (2025) | Mordor Intelligence | |
| USD 2.63 B (2025) | Global Consultancy A | Excludes software/services and several emerging Asian markets |
| USD 1.02 B (2025) | Industry Association B | Focuses mainly on consumables; uses hospital procurement samples only |
| USD 2.78 B (2025) | Trade Journal C | Holds ASPs constant at 2022 levels and omits non-oncology applications |
Taken together, the comparison shows that Mordor's disciplined scope selection, multi-variable forecasting, and yearly refresh cadence yield a balanced, transparent baseline that decision-makers can rely on with confidence.


Key Questions Answered in the Report
What is the projected value of the molecular cytogenetics market by 2031?
It is forecast to reach USD 5.41 billion, reflecting a 9.25% CAGR over 2026-2031.
Which product segment is expanding the fastest?
Cloud-based software and services, growing at 12.08% a year as labs swap hardware for subscriptions.
Why is Asia-Pacific the fastest-growing region?
Government precision-medicine programs in China and India finance new cytogenetics labs, driving an 11.22% CAGR through 2031.
How do workforce shortages affect laboratory throughput?
An 11% technologist vacancy rate in U.S. hospitals extends routine karyotype turnaround to up to 14 days, pushing automation adoption.
What technology trends are redefining cytogenetics workflows?
AI-enabled karyotyping, cloud-hosted image analysis, and integration of spatial multi-omics are reshaping laboratory operations and revenue models.
Page last updated on:


