
Market Overview
| Study Period | 2019 - 2031 |
|---|---|
| Market Size (2026) | USD 21.63 Billion |
| Market Size (2031) | USD 28.68 Billion |
| Growth Rate (2026 - 2031) | 5.81 % |
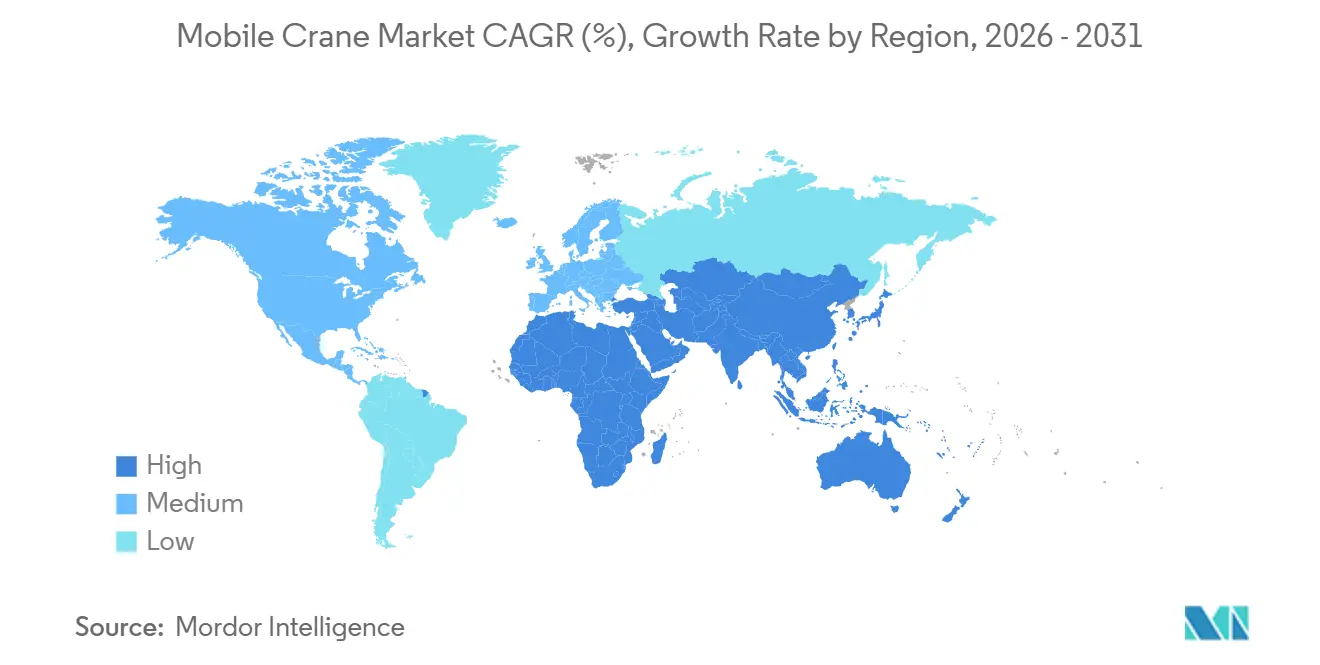
| Fastest Growing Market | Middle East and Africa |
| Largest Market | Asia Pacific |
| Market Concentration | Medium |
Major Players *Disclaimer: Major Players sorted in no particular order Image © Mordor Intelligence. Reuse requires attribution under CC BY 4.0. | |
Mobile Crane Market Analysis by Mordor Intelligence
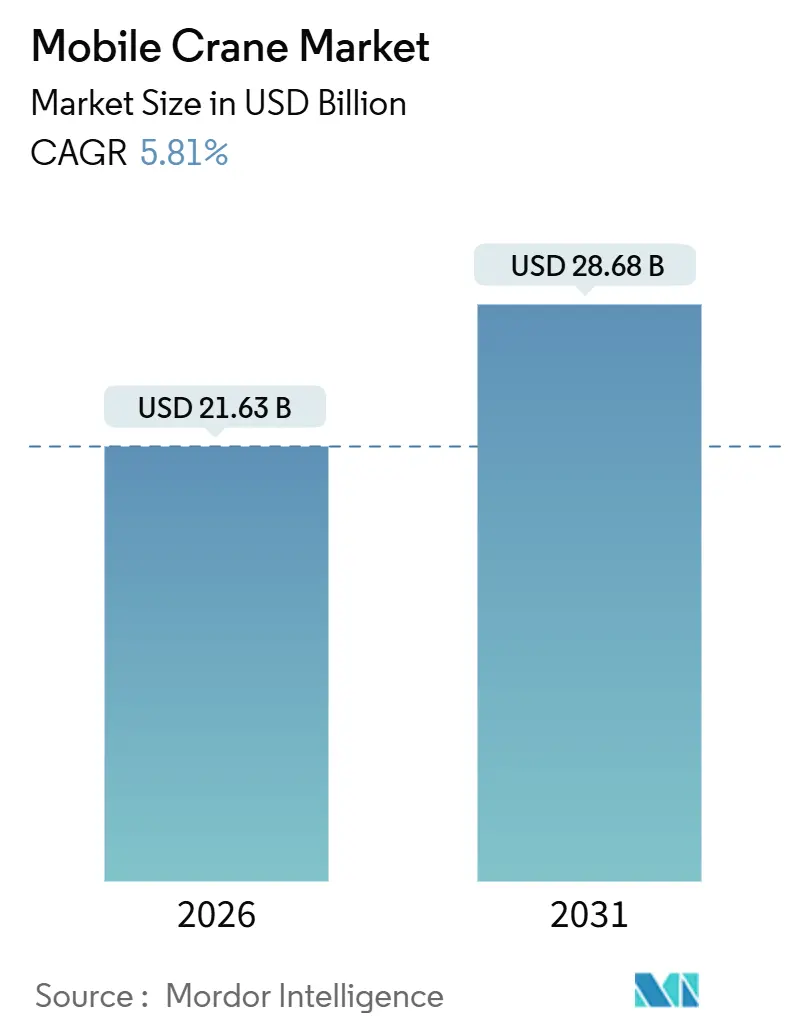
The Mobile Crane Market size is estimated at USD 21.63 billion in 2026, and is expected to reach USD 28.68 billion by 2031, at a CAGR of 5.81% during the forecast period (2026-2031). This growth aligns with sustained public-private infrastructure commitments in OECD countries, a broad construction surge in emerging Asia anchored by China and India, and accelerated fleet-renewal cycles tied to Stage V and Tier 4-Final emission rules. Truck-mounted units still dominate day-to-day lifting, yet all-terrain models are posting the quickest revenue gains as contractors seek one-crane mobility across urban streets, gravel haul roads, and offshore lay-down yards. Asia-Pacific retains the largest regional footprint, while the Middle East & Africa corridor is rising quickest due to Saudi Vision 2030 giga-projects and the UAE’s port-and-airport build-out. Operators and rental fleets that integrate modular boom designs, telematics, and hybrid or battery-electric drivetrains are positioned to capture share as financing headwinds begin to ease and input-cost volatility stabilizes.
Key Report Takeaways
- By product type, truck-mounted cranes led with 37.17% revenue share in 2025; all-terrain cranes are forecast to expand at a 5.83% CAGR through 2031.
- By application, construction accounted for 53.41% of the mobile crane market share in 2025, while marine and offshore work is advancing at a 5.88% CAGR to 2031.
- By end user, rental companies held 43.45% of the 2025 base, yet government procurement is growing at a 5.85% CAGR through 2031.
- By lifting capacity, the 50-150 ton class commanded 38.73% share in 2025, whereas above-300-ton heavy-lift units are projected to grow at a 5.91% CAGR to 2031.
- By geography, Asia-Pacific captured 38.86% of 2025 demand; the Middle East & Africa corridor is set to log the fastest 5.87% CAGR through 2031.
Note: Market size and forecast figures in this report are generated using Mordor Intelligence’s proprietary estimation framework, updated with the latest available data and insights as of January 2026.
Market Trends and Insights
Drivers Impact Analysis of Mobile Crane Market*
| Driver | (~) % Impact on CAGR Forecast | Geographic Relevance | Impact Timeline |
|---|---|---|---|
| Construction Boom in Emerging Asia | +1.8% | Asia-Pacific core (China, India), spill-over to Southeast Asia | Medium term (2-4 years) |
| Rapid Public-Private Spending on 5G & Green-Energy Infrastructure (OECD Nations) | +1.4% | North America, Europe, advanced Asia-Pacific (Japan, South Korea) | Medium term (2-4 years) |
| Fleet Renewal Driven by Stage V / Tier 4-Final Emission Mandates (EU & NA) | +1.2% | Europe, North America | Short term (≤ 2 years) |
| Modular Boom Designs Slashing Transport/Setup Time | +0.7% | Global, with early gains in Europe, North America | Medium term (2-4 years) |
| Accelerating De-Risking of Offshore Wind Installation Through "Feeder" Jack-Ups | +0.5% | Europe (North Sea), Asia-Pacific (Taiwan, Japan), emerging in North America | Long term (≥ 4 years) |
| Growing Demand for Small-Footprint Cranes on Urban Infill Sites | +0.3% | Global urban centers, concentrated in Asia-Pacific, Europe | Short term (≤ 2 years) |
| Source: Mordor Intelligence | |||
Construction Boom in Emerging Asia
China and India continue to allocate record capital toward highways, metros, and water projects, ensuring multi-year visibility for the mobile crane market [1]“Union Budget FY 2024–25,” Government of India, indiabudget.gov.in . In India, the government has announced a substantial increase in capital outlays for infrastructure development, reflecting its commitment to enhancing the country’s connectivity and urban infrastructure. Similarly, China has reported consistent growth in its fixed-asset infrastructure spending, demonstrating its focus on expanding and modernizing its infrastructure network. The Asian Infrastructure Investment Bank has played a pivotal role by committing substantial funding across numerous projects, driving demand for truck-mounted and all-terrain cranes. These cranes are crucial for efficiently operating in both densely populated urban areas and remote, less accessible regions. Despite challenges such as a shortage of skilled operators and delays in the availability of components, the strong financial commitments and ongoing infrastructure initiatives are effectively mitigating supply-chain disruptions over the medium term.
Rapid Public-Private Spending on 5G & Green-Energy Infrastructure
OECD nations are expanding the mobile crane market's horizons by layering digital and energy-transition projects atop traditional civil works. GSMA forecasts that operator capital expenditures will remain substantial in the coming years, primarily driven by the need for 5G densification, which is expected to significantly increase demand for tower and rooftop lifts [2]“Global 5G Capex Outlook 2025,” GSMA, gsma.com. Currently, the expansion of hyperscale data centers is gaining momentum, with electricity consumption projected to grow considerably. This trend highlights the critical need for precise placement of heavy prefabricated modules to support these facilities [3]“Data Centres and Energy,” International Energy Agency, iea.org . The UK’s National Infrastructure Strategy has allocated significant funding for grid upgrades, aiming to accommodate a substantial increase in offshore wind capacity over the next decade. This initiative compels contractors to prioritize cranes that offer both high capacity and efficient rig-down cycles. Furthermore, the rise of modular construction methods is intensifying the demand for repeated high-accuracy lifts, all within increasingly compressed project schedules.
Fleet Renewal Driven by Stage V / Tier 4-Final Emission Mandates
In Europe and North America, stringent limits on particulates and NOx are driving the swift replacement of older, non-compliant fleets. Compared to earlier engine standards, the latest regulations significantly reduce particulate matter emissions to minimal levels. Similarly, the United States' advanced regulations achieve comparable reductions. According to industry estimates, this compliance push has moderately increased OEM build costs. However, rental companies are compelled to modernize their fleets, not only to obtain necessary permits but also to align with contractor sustainability goals. Highlighting the industry's shift, Liebherr’s LTM 1110-5.1 and Tadano’s ATF 70G-4 are leading the way with innovative single-engine designs that substantially reduce fuel consumption and simplify maintenance. These advancements underscore the industry's pivot towards more technologically sophisticated models, driven by regulatory pressures.
Modular Boom Designs Slashing Transport Time
OEMs are re-engineering boom sections so they fit into standard containers and bolt together on site, shrinking mobilization windows by up to two-fifths. Liebherr’s TCC 78000 and Manitowoc’s Grove family integrate configurable inserts that allow a single crane model to tackle multiple lift classes. The Port of NEOM pre-assembled ten mobile harbor cranes in modular form, cutting commissioning to six weeks and validating the cost-down thesis for far-flung projects. While upfront engineering costs rise, the payoff in reduced trucking, permitting, and idle time is reshaping procurement criteria for fleet owners.
Restraints Impact Analysis of Mobile Crane Market*
| Restraint | (~) % Impact on CAGR Forecast | Geographic Relevance | Impact Timeline |
|---|---|---|---|
| Steel Price Volatility Squeezing OEM Margins | -0.9% | Global, with acute pressure in Asia-Pacific manufacturing hubs | Short term (≤ 2 years) |
| Skilled-Operator Shortages in OECD | -0.6% | North America, Europe, advanced Asia-Pacific (Japan, South Korea) | Medium term (2-4 years) |
| Grid-Carbon-Intensity Rules Delaying Diesel Crane Permits | -0.4% | Europe, California & select US states, advanced Asia-Pacific | Short term (≤ 2 years) |
| Financing Hurdles for Rental Fleets Amid Rising Interest Rates | -0.3% | Global, with acute pressure in OECD nations | Short term (≤ 2 years) |
| Source: Mordor Intelligence | |||
Steel Price Volatility Squeezing OEM Margins
In recent years, the Producer Price Index for U.S. steel mill products experienced significant fluctuations, with a sharp increase followed by a notable decline before stabilizing. Since a substantial portion of structural steel is embedded in all-terrain cranes, original equipment manufacturers (OEMs) that entered into contracts during the period of elevated prices are now facing considerable pressure on their profit margins. A leading manufacturer highlighted the impact of rising costs, emphasizing the importance of strategies such as price surcharges and productivity improvements to mitigate the effects of volatile material costs. Smaller brands, however, often lack the ability to hedge against such fluctuations, forcing them to pass on costs to customers, which can undermine their competitiveness in the market. Additionally, rental fleets are encountering difficulties in forecasting residual values due to the unpredictable nature of commodity price trends.
Skilled-Operator Shortages in OECD
In 2024, a significant majority of U.S. firms faced challenges in filling equipment-operator roles, as reported by the Associated General Contractors of America. The workforce in this field is aging, with operators now predominantly in their late forties or older, while the rate of new certifications has remained stagnant over recent years. Europe is experiencing a comparable issue, with an aging labor force and declining enrollment in vocational schools, which is slowing the replacement of skilled workers. Wage inflation has been consistently high, creating additional pressure on rental margins and operational costs. Efforts to address these challenges include investments in advanced technologies such as telematics-enabled load-moment indicators and remote-assist systems, which aim to maximize the efficiency of the existing workforce. However, despite these measures, the gap between supply and demand for skilled operators is expected to persist throughout the forecast period.
*Our forecasts treat driver/restraint impacts as directional, not additive. The impact forecasts reflect baseline growth, mix effects, and variable interactions.
Mobile Crane Market Segment Analysis
By Product Type:
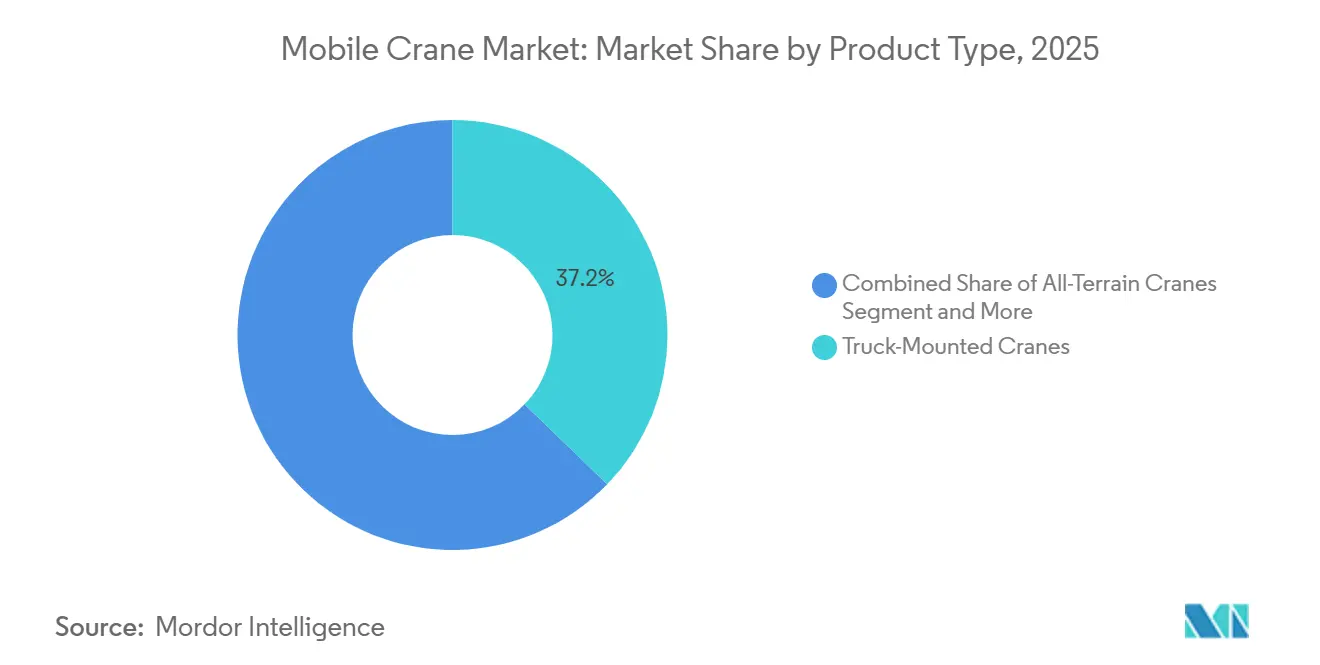
All-Terrain Momentum WidensThe mobile crane market size attributed to product types shows truck-mounted units capturing 37.17% of 2025 revenue, while all-terrain cranes are projected to grow at a 5.83% CAGR through 2031. Liebherr’s LTM 1650-8.1 and Manitowoc’s Grove GMK6400-1 demonstrate how Stage V-compliant single-engine layouts cut fuel use by minimal and simplify maintenance. Operators in Europe and North America value the highway-legal configuration paired with off-road flexibility, a combination that encourages fleet rationalization. Emerging markets retain a preference for truck-mounted cranes because of lower acquisition cost and simpler service networks, yet stricter emission rules are slowly nudging buyers toward modern designs.
OEM differentiation is focusing on modular booms, telematics, and hybrid drivetrains. XCMG’s XCA400L8 integrates load-moment monitoring and automated outrigger deployment to reduce setup time, a feature set aimed at regions facing skilled-operator shortfalls. Crawler cranes maintain relevance for petrochemical and offshore projects, but their lower utilization rates in diverse civil work limit share gains. Rough-terrain and trailer-mounted models target mining, utility maintenance, and industrial plant shut-downs, yet incremental demand rests on commodity cycles rather than steady infrastructure spending. Taken together, the all-terrain segment’s rising share underscores a pivot toward versatile, emission-compliant equipment in the mobile crane market.



By Application:
Offshore Wind Lifts Marine DemandConstruction retained 53.41% of the 2025 mobile crane market share due to housing, commercial, and public works activity. Marine and offshore projects, however, are forecast to post a 5.88% CAGR to 2031 as 50 GW of U.K. offshore wind, Taiwanese multi-gigawatt rounds, and early U.S. Atlantic leases come online. Installation vessels such as Cadeler’s Wind Peak with a 2,500-tonne crane enable rapid turbine stacking, cutting cycle times, and raising demand for feeder cranes at marshaling ports. Industrial modules at data centers and semiconductor fabs also require precise heavy lifts, feeding higher utilization rates for telematics-equipped all-terrain units.
Mining and excavation remain cyclical, with dragline replacements tied to commodity price trends. Utility applications benefit from grid-reinforcement budgets and the roll-out of electric bucket trucks, reflecting broader electrification policies. Shipping and port infrastructure are buoyant in Saudi Arabia and the UAE, where the Port of NEOM deployed ten Liebherr mobile harbor cranes, signaling long-term lift demand as logistics hubs scale up. Collectively, the widening scope of non-building work sustains a diversified demand base within the mobile crane market.
By End User:
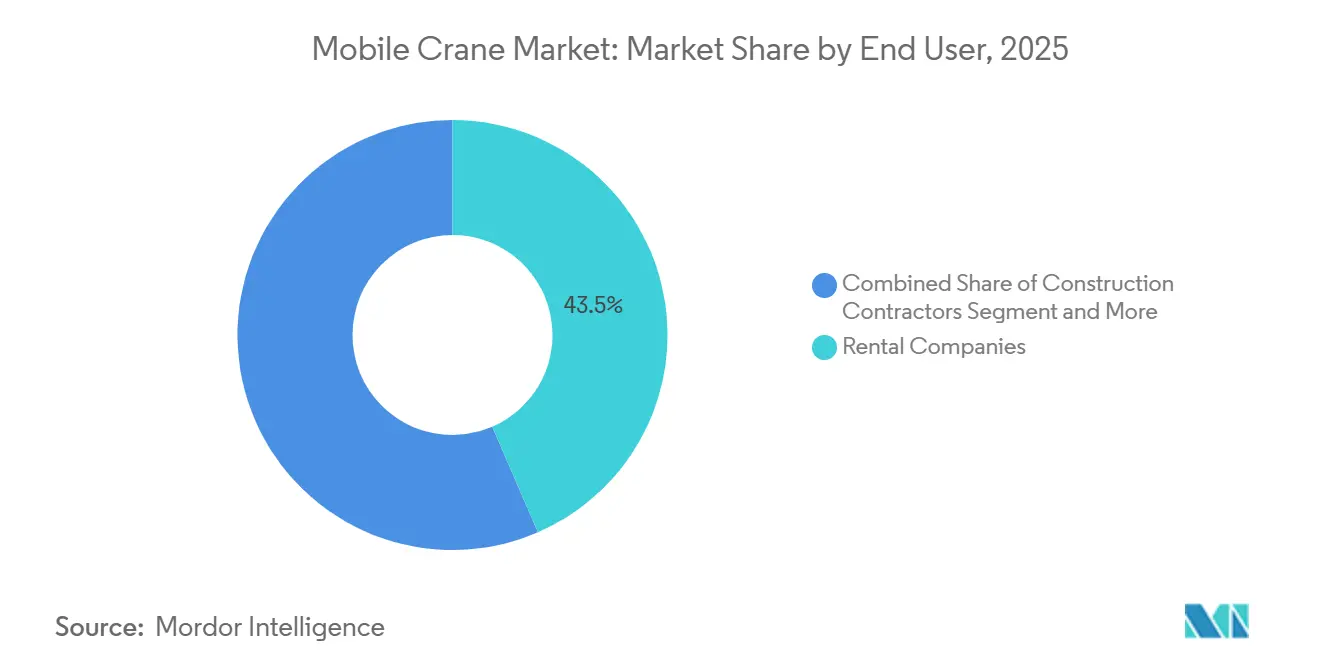
Public Procurement Gains TractionRental companies represented 43.45% of 2025 end-user revenue, cementing their role as the default channel for contractors managing volatile project schedules. Yet government and municipal agencies are estimated to expand purchases at a 5.85% CAGR as national stimulus plans lock in multi-year infrastructure pipelines. Brazil’s Novo PAC allocates a vast amount, while the United Kingdom’s ten-year strategy earmarks a significant amount, translating into predictable tender volumes and framework agreements. Contractors continue to offload ownership risk onto rental firms, but rising sustainability, prevailing-wage, and domestic-content clauses are steering some agencies toward direct fleet acquisitions.
Refinery and power plant owners maintain a baseline of crawler and heavy-lift units for maintenance. However, as predictive analytics extends service intervals, the capital expenditure cycle is becoming more stable. Financing plays a crucial role: While high interest rates in the United States have limited lease affordability, Brazil's national development bank has provided significant financial support, offering a much-needed boost to the market. This shift towards public-sector involvement bolsters the mobile crane market, countering the cyclical nature of private construction.
By Lifting Capacity:
Heavy-Lift Outpaces the Mid-RangeCapacity mix data show the 50-150 ton class accounting for 38.73% of 2025 revenue, yet cranes above 300 tons are expected to rise at a 5.91% CAGR through 2031 on the back of modular nuclear, offshore wind, and hyperscale data center projects. Mammoet’s SK6000 ring crane, now in assembly with a 6,000-tonne maximum capacity, underscores the escalation path for ultra-heavy lifts. Sarens’ SGC-250 offers 5,000 tonnes, allowing single-piece lifts that compress on-site integration schedules.
Below 50 tons, compact all-terrain and city-class units thrive in dense urban cores, aided by zero-emission or hybrid propulsion that keeps them compliant in low-emission zones. The 151-300 ton bracket remains versatile, servicing bridge girders, billboard-sized HVAC modules, and 8-MW wind-turbine nacelles. California’s ACE list already includes Liebherr’s LR 1250.1 unplugged, indicating regulatory momentum toward electric heavy-lift solutions. The evolving capacity spectrum ensures that each project scale finds fit-for-purpose equipment within the mobile crane market.
Geography Analysis
APAC Mobile Crane Market
Asia-Pacific captured 38.86% of the 2025 mobile crane market share, driven by steady growth in infrastructure spending in China and a substantial capital expenditure plan in India. Japan's robust construction activities, including major events like the Osaka Expo and advancements in transportation infrastructure such as maglev routes, continue to sustain demand. Meanwhile, South Korea's strong performance in construction-equipment exports highlights the region's manufacturing capabilities. Although challenges such as labor shortages and supply-chain disruptions persist, they have not significantly hindered the ongoing fleet-renewal cycles.
North America and Europe Mobile Crane Market
North America benefits from substantial investments in construction activities, with a notable focus on nonbuilding structures and a growing number of data-center projects fueled by advancements in artificial intelligence. Despite the impact of higher interest rates on leasing markets, operators are effectively leveraging federal tax incentives and state-level infrastructure grants to modernize equipment and adopt newer technologies. In Canada, while the scope of projects is narrower, key initiatives remain centered on energy infrastructure and transit system expansions. Europe, recovering from a recent downturn, is witnessing a resurgence in construction activities. The United Kingdom is experiencing steady growth, supported by a long-term infrastructure roadmap, while Germany's energy transition efforts are driving the repowering of onshore turbines. Across the European Union, ambitious infrastructure goals over the coming decades are expected to sustain demand for heavy-lift equipment in large-scale transport and grid projects.
South America and MEA Mobile Crane Market
South America is progressing at a slower pace, with Brazil's construction sector showing gradual growth, supported by government funding directed toward numerous concession and public-private partnership initiatives. BNDES credit approvals underscore selective liquidity pockets even as Argentina wrestles with macro instability. The Middle East & Africa corridor holds the fastest 5.87% CAGR, fueled by Saudi Arabia’s project slate and UAE logistics upgrades. NEOM’s deployment of ten Liebherr harbor cranes exemplifies the heavy civil tempo, while South Africa pushes to stabilize power supply before scaling infrastructure outlays.

Regulatory Landscape
The mobile crane market is shaped by safety, machinery, and emissions compliance regimes that affect both product design and fleet renewal. In Europe, Regulation (EU) 2023/1230 on machinery (replacing Directive 2006/42/EC) provides an updated conformity framework with full application from 20 January 2027, prompting OEMs to align technical documentation and risk assessment workflows ahead of that deadline. Standardization work is also progressing through CEN/CENELEC processes, including an updated mobile-crane safety draft standard prEN 13000:2025 intended to supersede EN 13000:2010+A1:2014, while ISO 12480-1:2024 (safe use, general) provides a current global reference point for crane use practices.
In the United States, OSHA requirements remain central for safe operation and recordkeeping across both general industry and construction, including the Crawler, Locomotive, and Truck Cranes standard (29 CFR 1910.180) and construction provisions such as 29 CFR 1926.1433. OSHA activity also continues to reinforce documentation discipline around inspections and certification records, as reflected in the Federal Register notice published on 17 December 2025 addressing information collection requirements for 29 CFR 1910.180. In parallel, fleet replacement behavior in Europe and North America continues to be shaped by Stage V and Tier 4-Final emission mandates, which raises the value of compliant powertrains and lower-emission operating profiles for permitting in regulated jurisdictions.
Value Chain Analysis
The mobile crane value chain starts with upstream inputs dominated by structural steel and engineered subsystems such as hydraulics, drivetrains, axles, and electronic control units, where metal cost swings and the availability of specialized components affect OEM build costs and lead times. Midstream value creation centers on design and validation (including safety and conformity requirements), fabrication of booms and chassis, and final assembly, with differentiation increasingly tied to modular boom engineering, control software, and connectivity. OEM emphasis on digital controls is visible in Manitowoc (Grove CCS 2.0 with MAXbase 2.0) and Liebherr (LICCON3 upgrades), where software, sensors, and embedded diagnostics are becoming core bill-of-material elements rather than add-ons.
Downstream, distribution splits between direct sales to contractors and industrial operators and a broader rental channel supported by dealers and service partners for parts, maintenance, and uptime guarantees. Industry bodies such as the International Crane Stakeholders Assembly (ICSA), alongside associations including FEM and VDMA, help align stakeholders on safety and technical standardization, supporting consistent operator practices and reducing friction for cross-border equipment placement. Service and lifecycle management are reinforced by telematics and operator-assist features that help rental fleets document utilization and compliance, while logistics constraints such as road permits, axle-load limits, and mobilization complexity keep transportability and on-site setup time as major cost drivers throughout the chain.
Competitive Landscape
Global giants like Liebherr, XCMG, SANY, Zoomlion, Tadano, Manitowoc, and Terex collectively dominate a significant portion of the mobile crane market, indicating a moderate level of market concentration. Their strategic priorities are centered on achieving compliance with emission regulations, advancing electrification, and integrating digital technologies. Liebherr’s electric crawler cranes, designed to meet stringent zero-emission mandates in regions such as California and Europe, exemplify this focus. Similarly, Zoomlion’s concept for battery-electric truck cranes highlights the efforts of Chinese OEMs to cater to cost-sensitive markets with innovative solutions.
Rental-fleet consolidators are increasingly adopting advanced telematics systems, such as Tadano’s Hello-Net and Manitowoc’s Crane Control System, to enhance operational efficiency, minimize downtime, and document environmental, social, and governance (ESG) metrics. The volatility in steel prices has intensified the need for cost management, shifting the competitive focus from initial purchase price to the overall cost of ownership. Heavy-lift specialists, including Mammoet and Sarens, are investing in cutting-edge super-ring cranes capable of handling extremely heavy loads. These cranes are being deployed for complex projects such as offshore wind farm staging and the construction of small modular reactors, allowing these companies to establish a premium niche within the broader mobile crane market.
Emerging opportunities are concentrated in areas such as urban infill lifting, upgrades for feeder jack-up vessels, and the production of modular nuclear components. Chinese manufacturers are leveraging their domestic production scale to offer competitively priced solutions, enabling them to outpace Western competitors in regions like Asia, Latin America, and Africa. On the other hand, established players are relying on their extensive service networks and advanced engineering capabilities to maintain their market positions. Although challenges such as fluctuating input costs and a shortage of skilled operators add complexity to operations, the sustained demand for infrastructure development provides original equipment manufacturers (OEMs) and rental firms with a strong foundation to continue investing in technological advancements throughout the forecast period.
Mobile Crane Industry Leaders
Cargotec Corporation
Terex Corporation
TADANO Ltd
Konecranes Plc
Zoomlion Heavy Industry Science & Technology Co., Ltd
- *Disclaimer: Major Players sorted in no particular order

Mobile Crane Market Companies Covered in this Report
- Liebherr-International AG
- XCMG Construction Machinery Co., Ltd
- Zoomlion Heavy Industry Science & Technology Co., Ltd
- SANY Heavy Industry Co., Ltd
- Tadano Ltd
- The Manitowoc Company, Inc
- Terex Corporation
- Kobelco Construction Machinery Co., Ltd
- Cargotec Corporation
- Konecranes Plc
- Hitachi Sumitomo Heavy Industries Construction Crane Co., Ltd
- Palfinger AG
- Sarens NV
- ZoomBoom Crane Inc
- Manitex International Inc
- Fassi Gru S.p.A.
- Sennebogen Maschinenfabrik GmbH
- Elliott Equipment Company
- Franna
- Furukawa UNIC Corporation

Market Opportunities and Future Outlook
A key whitespace is technology-led productivity and safety improvement that addresses skilled-operator constraints and tight jobsite schedules without changing underlying lift demand. OEM actions in 2026 reflect this direction: Manitowoc introduced the Grove GMK8700 (700 t) with CCS 2.0 and MAXbase 2.0, and Liebherr rolled out LICCON3 control upgrades emphasizing connectivity and driver-assistance features, making advanced controls and fleet data more standard purchase considerations. For rental companies that accounted for 43.45% of 2025 end-user revenue, these feature sets create scope for differentiated offerings focused on uptime, standardized operator workflows, and compliance documentation.
A second opportunity cluster comes from project and customer segments that draw in higher-spec cranes and related services, particularly marine, offshore, and port-oriented work. In ports, Konecranes expanded its Generation 6 mobile harbor crane lineup with the Gottwald ESP.4 for smaller ports, and it received a repeat order (July 2025) for three Gottwald ESP.10 mobile harbor cranes for the Port of Manaus with delivery scheduled for Q3 2026, indicating ongoing demand for flexible port-side lifting solutions. In offshore wind-linked heavy lifting, Liebherr concluded an agreement (February 2026) to deliver a BOS 45000 heavy-lift offshore crane for installation on a jack-up barge (VEGA) operated by Eunsung O&C Co., Ltd., reinforcing pull-through for high-capacity lifting tied to specialized marine assets. Parallel whitespace also exists in regional localization and service expansion, where OEMs broaden manufacturing and support footprints to reduce lead times and total cost of ownership in markets with active infrastructure pipelines and public procurement.
Recent Industry Developments in Mobile Crane Market
- July 2026: Terex highlighted continued investment in new manufacturing capacity for Franna cranes, reinforcing its push to scale specialty lifting products and associated support capability. The move aligns with portfolio focus around niche mobile lifting requirements, while improving supply availability for pick-and-carry style applications.
- July 2025: Konecranes received a repeat order from Super Terminais Comercio e Industria Ltda for three Konecranes Gottwald ESP.10 mobile harbor cranes for the Port of Manaus, with delivery scheduled for Q3 2026. The follow-on purchase indicates customer preference for mobile harbor crane solutions in river and regional ports, supporting equipment utilization across mixed cargo profiles.
- December 2024: Robert Bosch began manufacturing electric steering systems in Hungary, strengthening European supply of electrified steering components relevant to heavy mobile platforms. A deeper local component base supports OEM and tier supply-chain resilience as equipment makers increase electrification and electronically controlled subsystems in newer crane platforms.


Mobile Crane Market Report Scope and Research Methodology
Market Definition and Coverage
This market covers revenue generated from sales of mobile cranes that can be transported and used for lifting and handling loads across job sites, including common wheeled and truck-mounted configurations, with demand tied to construction, mining, and industrial lifting activity.
Scope exclusions: We exclude tower cranes, fixed overhead cranes, and non-crane lifting equipment, and we also exclude service-only revenue such as operator labor, repairs, and long-term maintenance contracts.
Segments Covered in This Report
- By Product Type
- Truck-Mounted Cranes
- Trailer-Mounted Cranes
- Crawler Cranes
- All-Terrain Cranes
- Rough Terrain Cranes
- Others
- By Application
- Construction
- Mining & Excavation
- Industrial Applications
- Marine & Offshore
- Utility
- Shipping & Port Building
- By End User
- Rental Companies
- Construction Contractors
- Government & Municipalities
- Industrial Operators
- By Lifting Capacity
- Below 50 Tons
- 50–150 Tons
- 151–300 Tons
- Above 300 Tons
- By Geography
- North America
- United States
- Canada
- Rest of North America
- South America
- Brazil
- Argentina
- Rest of South America
- Europe
- Germany
- United Kingdom
- France
- Italy
- Spain
- Rest of Europe
- Asia Pacific
- China
- India
- Japan
- South Korea
- Rest of Asia Pacific
- Middle East and Africa
- United Arab Emirates
- Saudi Arabia
- South Africa
- Turkey
- Rest of Middle East and Africa
- North America
Data Sources, Market Sizing, and Validation
Desk Research
Desk research was used to build the basic demand picture and set realistic input ranges before interviews began. We relied on public construction and mining activity indicators, trade and production signals, and macro series that influence fleet purchases and replacement cycles.
Sources we typically lean on include items such as US Census construction spending releases, Bureau of Labor Statistics series for construction and heavy equipment related employment, USGS mining and commodity summaries, World Bank infrastructure and macro indicators, customs trade statistics where available, and peer reviewed papers on lifting safety and equipment utilization. We also reviewed company filings, investor presentations, earnings call notes, and reputable industry press, then used paid subscriptions for company financials and news intelligence plus an import-export shipment level database to sanity-check cross-border equipment flows. These examples are not exhaustive, and other public and paid sources were also referred to for data collection, validation, and research clarification.
Primary Interviews and Surveys
Primary work focused on confirming what actually drives purchase decisions and pricing in mobile cranes, which tends to differ by application and lifting capacity. We spoke with a mix of crane OEM and component-side participants, rental-focused buyers, contractors, and distributors across APAC, EMEA, and the Americas, so assumptions on replacement cycles, utilization, and average selling prices could be stress-tested and corrected where needed.
Distribution of primary research fieldwork respondents
| Company type | Respondent position | Region |
|---|---|---|
| Top tier: 26% | CXOs: 15% | APAC: 37% |
| Mid tier: 53% | Functional/Unit leaders: 31% | EMEA: 36% |
| Smaller Players: 21% | Managers: 54% | Americas: 27% |
Market-Sizing & Forecasting
Sizing starts from a top-down build where construction and industrial capex signals, equipment replacement timing, and trade and production data are used to reconstruct the annual demand pool for mobile cranes by major region, and the value is then derived through region-appropriate ASP bands. Once that structure is in place, selective bottom-up approximations are used to corroborate totals, such as sampled price lists, distributor channel checks, and limited roll-ups of supplier revenue where disclosures allow it.
Key model inputs include infrastructure and non-residential construction spending trends, mining and excavation activity indicators, fleet age and replacement cycle assumptions, utilization patterns in rental fleets, lifting capacity mix shifts (for example, below 50 tons versus higher classes), and observed price progression tied to steel costs and emissions compliant powertrain updates. Where data is patchy for smaller countries, we fill gaps using proxy indicators like construction output growth and import intensity, followed by interview checks so the implied unit demand stays realistic.
For forecasting, scenario analysis is used as the main technique because end markets can swing with project approvals and financing conditions. The scenarios are anchored to outlook ranges for construction starts, mining capex, and interest rate sensitivity, and then we align the final trajectory with the consensus heard from primary respondents on order books, rental utilization, and pricing behavior.
Data Validation & Update Cycle
Validation is handled through several rounds of cross-checks so extreme values do not slip into the final market series. We compare outputs against independent signals like construction equipment trade trends, regional project pipeline direction, and the implied unit volumes versus reasonable fleet replacement logic, then review unusual variances again before sign-off.
When a major mismatch is found, respondents are re-contacted to confirm whether the issue is a definition problem, a timing shift in deliveries, or a pricing assumption that needs to be reset. Reports are refreshed annually, and interim updates are made when material events occur, such as sharp cost inflation or large infrastructure funding changes. Before delivery, a final analyst pass is completed so clients receive the latest updated view.
Mordor Intelligence's Mobile Crane Market Size Compared Against Other Published Estimates
Published market values for mobile cranes can vary a lot because different studies define what counts as a crane sale, which year is treated as the anchor point, and how pricing changes are handled across regions. Even when the topic sounds the same, the totals move when rental-related services are blended into equipment revenue or when adjacent crane categories are bundled together.
Tower cranes and service-only rental revenue sit outside Mordor Intelligence's scope, which is one key reason the value for mobile crane equipment can come out lower than estimates that bundle lifting services or broader crane classes. Differences also show up when one source reports a 2024 base and another reports a 2026 base, since currency timing, steel-driven price moves, and capacity mix shifts can change the value even if unit demand is similar.
Benchmark comparison
| Source | Market Size | Gaps in Research Methodology |
|---|---|---|
| Mordor Intelligence | USD 21.63 B (2026) | |
| Global Consultancy A | USD 15.37 B (2024) | Uses a 2024 base year and can reflect a different revenue boundary by mixing broader crane coverage or service-adjacent revenue, and the faster stated CAGR suggests a more aggressive price or demand path than what is supported by replacement-cycle checks. |
| Industry Research Publisher B | USD 17.41 B (2024) | Reports an earlier base year and a wider application bucket, which can pull in additional use cases and create a different capacity mix. The estimate can also shift if ASP progression is applied uniformly across regions without adjusting for local spec and import intensity. |
The spread in the table is mainly explained by what is included in revenue, which base year is used, and how pricing is carried forward by region and capacity class. By keeping the model tied to construction and mining demand signals, realistic replacement timing, and interview-checked ASP bands, the final number stays traceable to inputs that can be revisited and repeated.


Key Questions Answered in the Report
What is the projected value of the mobile crane market by 2031?
The market is forecast to reach USD 28.68 billion by 2031, growing at a 5.81% CAGR.
Which product type is expanding fastest in mobile lifting?
All-terrain cranes are projected to post the highest 5.83% CAGR through 2031, due to emission compliance and multi-terrain agility.
How large is Asia-Pacific’s share of global demand?
Asia-Pacific accounted for 38.86% of 2025 revenue and continues to anchor growth through large-scale infrastructure spending.
Why are heavy-lift cranes above 300 tons in demand?
Ultra-large wind turbines, modular nuclear components, and hyperscale data center modules require single-piece lifts that only heavy-lift models can handle.
What regulatory trend is accelerating fleet renewal?
Stage V and Tier 4-Final emission mandates push fleet owners to replace older diesel units with compliant, fuel-efficient models.
How are operator shortages being addressed?
Rental firms and OEMs deploy telematics, load-moment indicators, and remote-assist systems to boost safety and productivity while training programs scale up new talent.
Page last updated on:


 Your data is secure and never sold or shared.


