
Mining Laboratory Automation Market Size and Share
Market Overview
| Study Period | 2020 - 2031 |
|---|---|
| Market Size (2026) | USD 7.95 Billion |
| Market Size (2031) | USD 12.88 Billion |
| Growth Rate (2026 - 2031) | 10.13 % |
| Fastest Growing Market | Middle East and Africa |
| Largest Market | Asia Pacific |
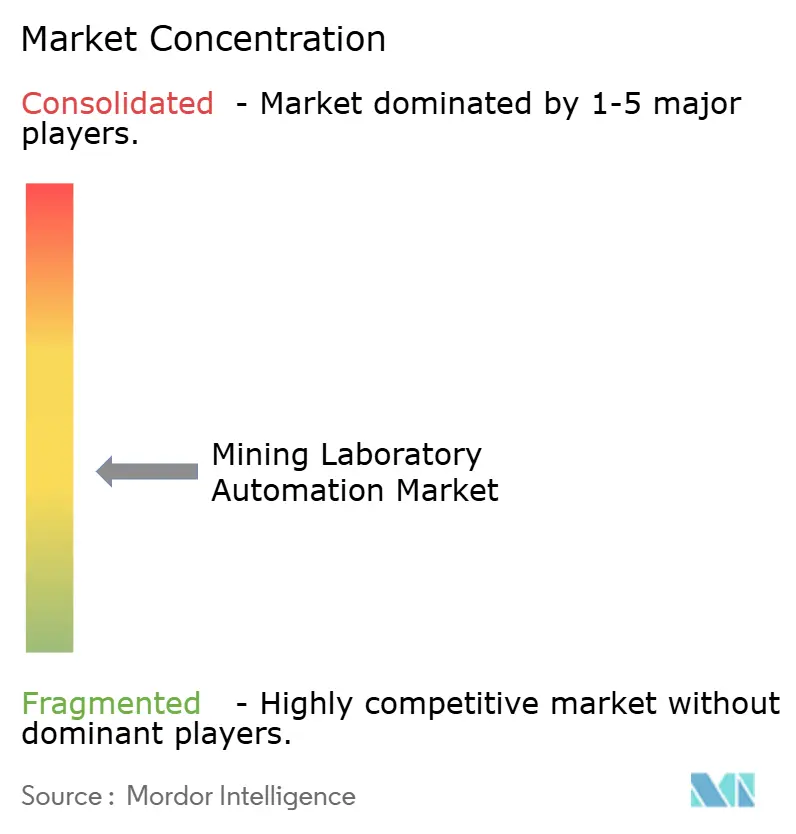
| Market Concentration | Medium |
Major Players *Disclaimer: Major Players sorted in no particular order Image © Mordor Intelligence. Reuse requires attribution under CC BY 4.0. | |
Mining Laboratory Automation Market Analysis by Mordor Intelligence
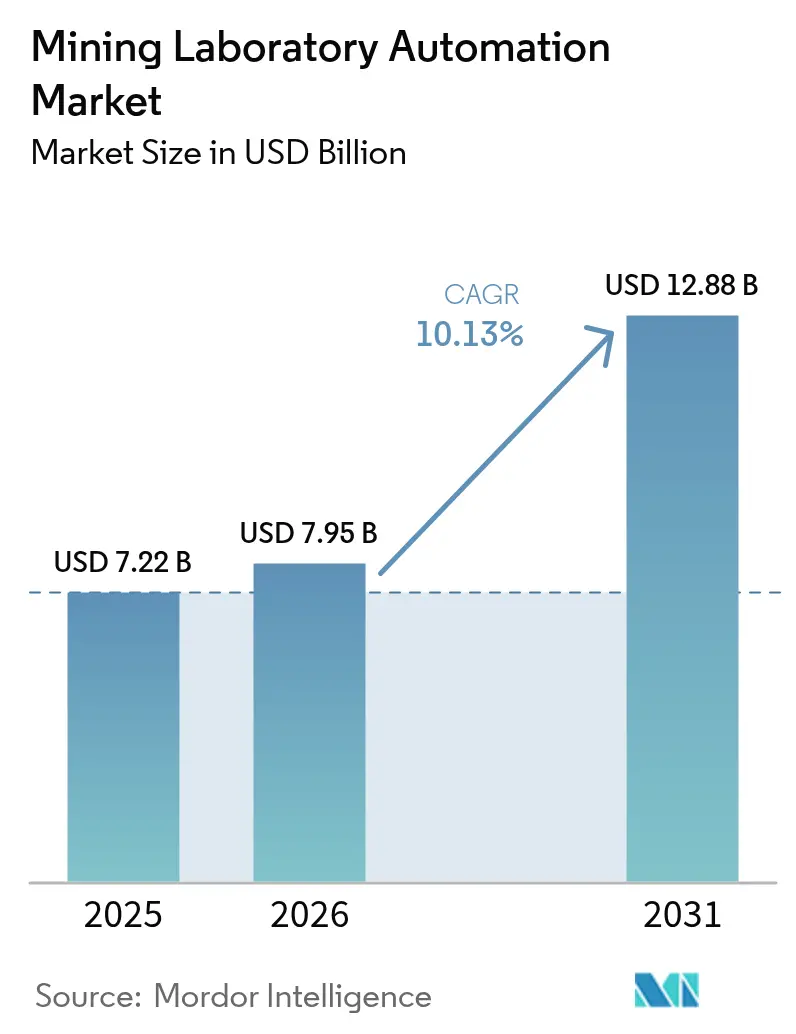
Mining Laboratory Automation market size in 2026 is estimated at USD 7.95 billion, growing from 2025 value of USD 7.22 billion with 2031 projections showing USD 12.88 billion, growing at 10.13% CAGR over 2026-2031. Robust demand stems from mine-site digitalization programs that seek faster turn-around of assays, tighter grade control, and lower human-exposure to hazardous environments. Autonomous sampling systems now link directly with cloud-hosted LIMS platforms, enabling pit-to-port traceability that boosts ore recovery, trims re-handling costs, and strengthens ESG compliance. Mid- and large-scale miners are digitizing laboratories to counter scarce skilled labor, while containerized labs shorten development timelines for green-field projects. Convergence of robotics, AI, and modular instrumentation is creating scalable ecosystems that lower total cost of ownership and give early adopters 18–24-month payback horizons. Investment momentum is reinforced by regional policy pushes, particularly in Australia, Chile, Saudi Arabia, and Ghana, where regulators and sovereign funds are steering capital toward automated mining value chains.
Key Report Takeaways
- By product category, robotics led with 33.60% revenue share in 2025; LIMS is forecast to expand at a 12.15% CAGR through 2031.
- By automation level, modular systems held 50.20% of the Mining Laboratory Automation market share in 2025, while total lab automation is projected to grow at 14.51% CAGR to 2031.
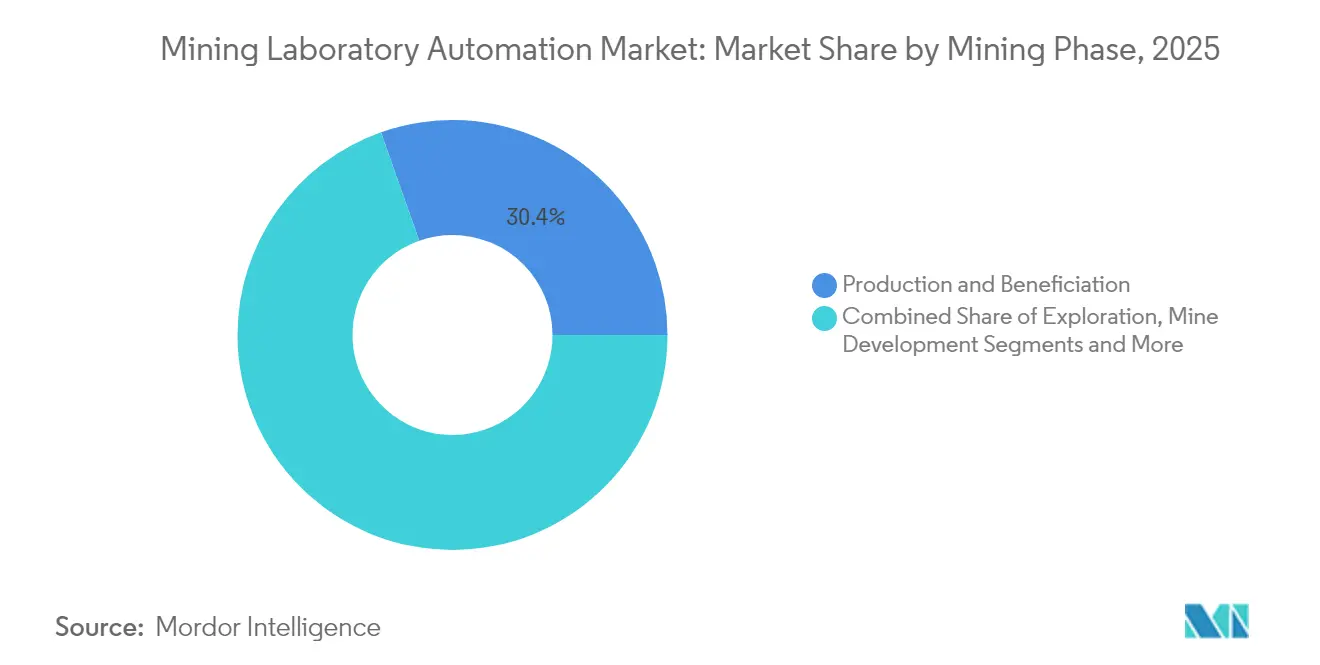
- By mining phase, production and beneficiation accounted for 30.40% share of the Mining Laboratory Automation market size in 2025; exploration and grade control is advancing at a 12.98% CAGR through 2031.
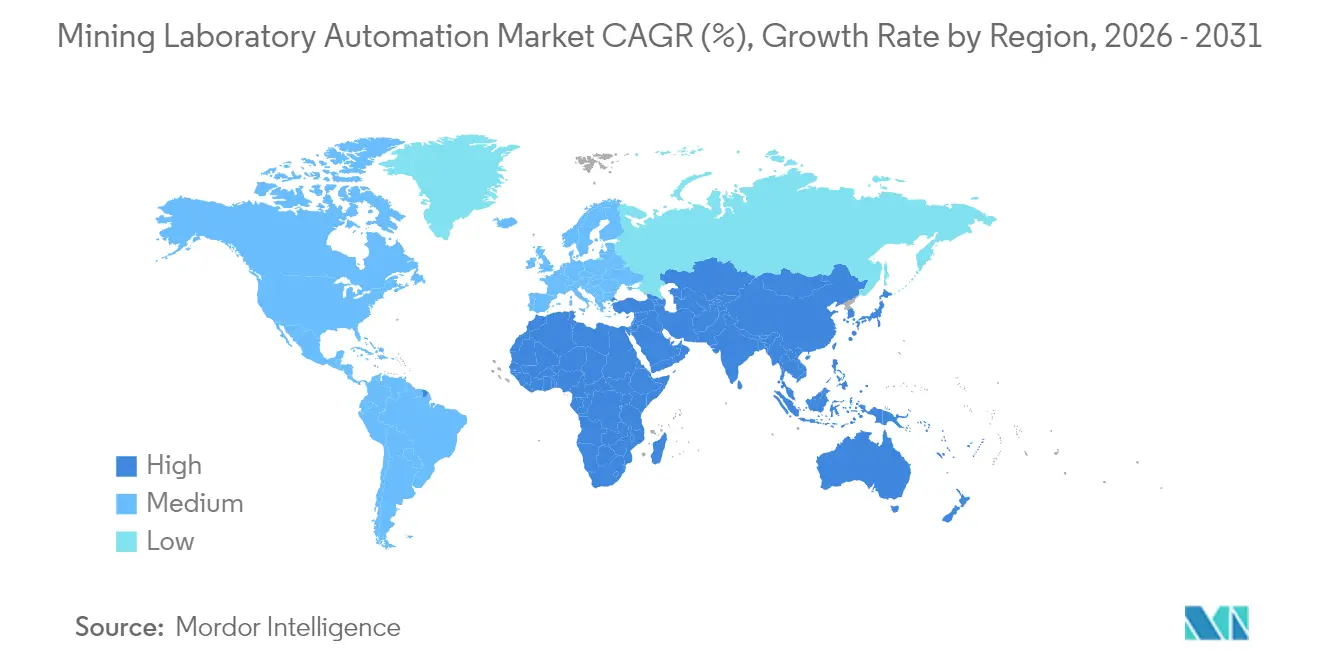
- By geography, Asia-Pacific commanded 31.20% share in 2025, whereas Middle East & Africa posts the fastest 14.86% CAGR to 2031.
- By end-user, large enterprises captured 57.10% of the Mining Laboratory Automation market size in 2025; mid-tier and junior miners represent the fastest-growing user group at 13.88% CAGR.
- FLSmidth, Thermo Fisher Scientific, and Bruker collectively held 25.60% Mining Laboratory Automation market share in 2025, reflecting a moderately fragmented landscape.
Note: Market size and forecast figures in this report are generated using Mordor Intelligence’s proprietary estimation framework, updated with the latest available data and insights as of 2026.
Global Mining Laboratory Automation Market Trends and Insights
Drivers Impact Analysis*
| DRIVER | (~) % IMPACT ON CAGR FORECAST | GEOGRAPHIC RELEVANCE | IMPACT TIMELINE |
|---|---|---|---|
| Digital-first "Pit-to-Port" Sampling Initiatives in Australia | 1.8% | Australia, with spillover to Canada and Brazil | Medium term (2-4 years) |
| Mandatory On-site Assay Turn-around in Chilean Copper Mines | 1.5% | Chile, Peru, with adoption in APAC copper operations | Short term (≤ 2 years) |
| Rapid Grade-Control Needs in West African Gold Super-Pits | 1.2% | West Africa, expanding to East Africa and South America | Medium term (2-4 years) |
| Stricter Tailings-Dam Monitoring Rules in Brazil | 0.9% | Brazil, with regulatory spillover to global operations | Long term (≥ 4 years) |
| Rise of Containerized "Hub-and-Spoke" Labs Across the Nordics | 0.7% | Nordic countries, expanding to remote mining regions globally | Long term (≥ 4 years) |
| AI-Enabled Predictive Maintenance for Robotic Sample Prep | 1.4% | Global, with early adoption in Australia and North America | Medium term (2-4 years) |
| Source: Mordor Intelligence | |||
Digital-first “Pit-to-Port” Sampling Initiatives in Australia
Mining majors now integrate autonomous drills, automated crushers, and robotic fire-assay lines into unified data backbones that push geochemical results into planning software within minutes. Rio Tinto reports annual savings of USD 200 million after deploying predictive maintenance on robotic lab assets, while BHP’s Spence mine in Chile logged three months of full autonomy with zero safety incidents in 2024. Continuous data flow removes manual choke points, cuts contamination risk by 40%, and lifts ore recovery 3–5% in large iron-ore operations.[1]BHP Editorial Team, “Artificial Intelligence is unearthing a smarter future,” bhp.com
Mandatory On-site Assay Turn-around in Chilean Copper Mines
Four-hour regulatory limits for grade-control assays have forced Chilean sites to adopt automated sample preparation and portable XRF units capable of 90-minute results. Codelco’s USD 2.5 billion agreement with ABB bundles electrification and laboratory automation, giving early movers 2–3-point boosts in copper recovery and shaping similar mandates in Peru.[2]Mining Digital Staff, “ABB and Codelco Partner on Chilean Mine Decarbonisation,” miningdigital.com
Rapid Grade-Control Needs in West African Gold Super-Pits
Gold mega-pits have introduced high-throughput robotic labs that process 500+ samples per day. AngloGold Ashanti gained a 650% ROI at Iduapriem by pairing blast-movement monitoring with automated assay workflows, which raised gold recovery 4–6%. Success is spurring similar investments across Ghana, Mali, and Suriname.
AI-Enabled Predictive Maintenance for Robotic Sample Prep
Machine-learning models review vibration and thermal signals to forecast failures 72–96 hours in advance. Gecko Robotics documented 35% less unplanned downtime and 8–12% higher equipment availability at pilot mine sites. Lower maintenance costs accelerate project paybacks and encourage bundled hardware-and-software contracts.
Restraints Impact Analysis*
| RESTRAINTS | (~) % IMPACT ON CAGR FORECAST | GEOGRAPHIC RELEVANCE | IMPACT TIMELINE |
|---|---|---|---|
| CAPEX Pay-back > 3 Years for Mid-Tier Mines | -1.6% | Global, particularly affecting junior and mid-tier operations | Short term (≤ 2 years) |
| Limited Inter-operability Between Legacy Assay Hardware | -1.2% | North America and Europe with aging infrastructure | Medium term (2-4 years) |
| Scarcity of Robotics Technicians in Africa & Caribbeans | -0.8% | Sub-Saharan Africa and Caribbean mining regions | Long term (≥ 4 years) |
| Data-sovereignty Barriers to Cloud-Hosted LIMS in EU | -0.7% | European Union, with potential spillover to other regions | Medium term (2-4 years) |
| Source: Mordor Intelligence | |||
CAPEX Pay-back > 3 Years for Mid-Tier Mines
Mid-tier mining operations face significant financial constraints when evaluating laboratory automation investments, as extended payback periods often exceed acceptable risk thresholds for companies with limited capital resources. SRK Consulting's analysis of mining operational costs reveals that automation projects requiring initial investments above USD 5 million typically face scrutiny from boards when payback periods extend beyond 36 months. The challenge is compounded by volatile commodity prices that make long-term ROI calculations unreliable, particularly for gold and base metal operations where price fluctuations can exceed 20% annually. Teck Resources' Quebrada Blanca II project exemplifies this challenge, with development costs escalating to USD 8.5-9 billion significantly above initial estimates, highlighting the risk of cost overruns in major automation initiatives. Equipment financing options and leasing arrangements are emerging as potential solutions, but adoption remains limited due to concerns about technology obsolescence and maintenance responsibilities.
Limited Inter-operability Between Legacy Assay Hardware
The mining industry's substantial installed base of legacy analytical equipment creates significant integration challenges when implementing modern automation systems, as many instruments lack standardized communication protocols required for seamless data exchange. Laboratory information management systems must accommodate dozens of different instrument interfaces, with some facilities operating equipment from 15+ different manufacturers spanning 20+ years of technology evolution. The complexity increases exponentially when attempting to integrate fire assay furnaces, X-ray fluorescence spectrometers, and atomic absorption systems from different eras into unified automated workflows. Retrofit solutions can cost 40-60% of new equipment purchases while delivering only partial functionality, creating difficult capital allocation decisions for mining companies. The emergence of universal communication standards and middleware solutions offers potential relief, but implementation requires significant technical expertise that many mining operations lack internally.
*Our forecasts treat driver/restraint impacts as directional, not additive. The impact forecasts reflect baseline growth, mix effects, and variable interactions.
Segment Analysis
By Product: Robotics Accelerate Hazard Reduction
Robotics generated the largest 33.60% slice of the Mining Laboratory Automation market in 2025, underpinned by the need to shield personnel from high-temperature furnaces and carcinogenic dust. Scott Automation’s turnkey cells now deliver crushing, milling, weighing, and fire-assay pouring in sealed environments, lifting throughput and repeatability. LIMS, while smaller, is the fastest climber at 12.15% CAGR, as executives value data integrity and regulatory traceability more than incremental hardware speed. Container labs meet exploration campaigns that require rapid mobilization; one 40-foot module can be on-line within three weeks. Automated analyzers adopt AI-assisted calibration, trimming reagent use and boosting precision.




By Automation Level: Modular Dominates but TLA Gains Traction
Firms prefer modular islands that replace discrete tasks—crushing, splitting, or fusion—without destabilizing whole workflows. Such systems accounted for 50.20% of the Mining Laboratory Automation market share in 2025. As payback proof accumulates, total lab automation grows 14.51% per year, particularly in iron-ore and copper hubs where sample volumes are extreme. ABB’s alliance with Agilent to provide integrated robotic-chemistry islands signals a shift toward vendor ecosystems that deliver cradle-to-gate solutions.
By Mining Phase: Production Dominates, Exploration Races Ahead
Production and beneficiation stages consumed 30.40% of 2025 revenue as operators demand real-time process control to meet contract specs. Exploration and grade control, however, post the 12.98% CAGR headline because complex ore bodies require rapid drill-core analytics. Giant Mining’s deployment of AI-powered geomet modeling before its 2025 drill campaign shows how early geochemical intelligence de-risks later capex.
By End-User: Large Enterprises Still Rule
Major diversified miners held 57.10% of the Mining Laboratory Automation market size in 2025 because they can fund multi-site roll-outs and sustain in-house R&D. Cost declines and leasing models let mid-tier players grow their outlay at 13.88% CAGR. Orexplore’s pay-per-sample gold detection service proves attractive for juniors seeking capital-light exploration.
Geography Analysis
Asia-Pacific anchored 31.20% of global revenue in 2025, with Australia’s autonomous iron-ore chain and China’s vast base-metal capacity driving demand. Australian robotics spending in mining stood at USD 63 billion in 2022 and is projected to jump to USD 218 billion by 2030, a trend mirrored in laboratory settings. Japan and South Korea supply precision sensors and AI chips that sharpen assay accuracy.
Middle East & Africa records the quickest 14.86% CAGR, catalyzed by sovereign funds. Saudi miner Ma’aden’s tie-up with Hexagon to open the region’s first digital mine—budgeted at USD 2 billion—sets a template for lab automation across phosphate, gold, and copper assets. African deployments lean heavily on container labs and remote monitoring to sidestep weak infrastructure and scarce technicians.
North America shows steady replacement demand as legacy uranium, potash, and precious-metal labs age. Vendors must navigate inter-operability retrofits and unionized labor environments. Europe’s picture is mixed: Nordic iron-ore producers pioneer hub-and-spoke automated labs that support numerous satellite mines, but the wider EU struggles with data-sovereignty hurdles that complicate cloud-based LIMS models. South America benefits from Chile’s assay-turn-around law and Peru’s lithium boom.

Regulatory Landscape
Regulation affecting mining laboratory automation is anchored in occupational health and safety regimes and technical standards for autonomous systems, with enforcement and guidance varying by jurisdiction. In the United States, the Mine Safety and Health Administration (MSHA) sets the baseline through 30 CFR Parts 1-199, which mine operators and on-site laboratories must align with when introducing automated sample handling, robotics, and associated safeguarding. Canada is also refining guidance for mobile autonomous mining, referenced through provincial approaches such as British Columbia guidance and Ontario Occupational Health and Safety Act applications, shaping how automated in-pit labs and robotic sample-prep cells are risk assessed, maintained, and staffed.
Standards and due-diligence expectations increasingly influence how assay data, traceability, and digital workflows are implemented. ISO frameworks commonly referenced in autonomous and machinery safety, including ISO 17757 and ISO 12100, support risk assessment and system integration decisions for robotic lab lines. In China, YS/T 1821-2025 for intelligent factories in the non-ferrous mining context was issued in August 2025 and implemented on March 1, 2026, reinforcing domestic standardization requirements for intelligent, connected operations. In Europe, sustainability reporting and due diligence requirements, including CSRD-driven expectations, elevate documentation and auditability needs for laboratory results, increasing emphasis on LIMS traceability and controlled data handling across global mineral supply chains.
Value Chain Analysis
The value chain starts with automation OEMs and system integrators supplying robotic sample handling, crushing/splitting/prep modules, and automated analyzers (XRF, XRD, ICP-MS, LIBS), and then moves into software layers where LIMS and connectivity tools integrate instruments with mine planning, SAP/ERP, and QA/QC workflows. Upstream providers include Scott Technology (Rocklabs), FLSmidth, Alsys International, and QCS LabAutomation GmbH, while downstream digital integration and data exchange are supported by LIMS and platform vendors such as Online LIMS Canada Ltd., Datamine (AssayNet), MineHub, and aXedras.
Deployment typically progresses from engineering design and workflow mapping through factory acceptance testing, site commissioning, and long-term service contracts covering calibration, spares, and uptime. Two prominent channels are mine-site laboratories supporting grade control and production, and third-party commercial laboratories (TIC providers) that standardize assay workflows across multiple mining clients. Scott Technology’s June 2026 deployment of an AMS crush cell into a large-scale commercial laboratory illustrates this downstream expansion. Key bottlenecks center on integration with legacy assay hardware, driven by interface diversity and retrofit costs, and on building data pipelines that preserve chain-of-custody and ISO 17025-aligned traceability while enabling near-real-time decision loops between lab results and operations.
Competitive Landscape
The Mining Laboratory Automation market balances between scale incumbents and nimble disrupters. FLSmidth, Bruker, and Thermo Fisher wield global service fleets, integrated analytics suites, and robust after-sales contracts—together capturing 26% share. They solidify positions through retrofit packages that bolt robotics onto legacy instruments. Challenger firms like Chrysos (PhotonAssay) and GeologicAI deliver game-changing non-destructive analysis and AI-core scanning that compress assay lead-times from hours to minutes. Partnership webs multiply: ABB joins Agilent for robotic wet-chemistry cells; ABB also links with Mettler-Toledo’s LabX to overlay weight data onto LIMS, responding to laboratories starved of skilled technicians.
Automation-as-a-service emerges as a battleground. Scott Technology and Intertek pilot outcome-based contracts where miners pay per analyzed sample rather than own equipment outright. Meanwhile, equipment OEMs embed AI-driven predictive maintenance to slash unplanned downtime—a differentiator highlighted by Gecko Robotics’ field results. Sustainability imperatives push vendors to design low-energy fusion furnaces and smart ventilation, addressing stricter tailings analytics and decarbonization metrics.
Mining Laboratory Automation Industry Leaders
FLSmidth A/S
Thermo Fisher Scientific
SGS SA
Intertek Group PLC
Rocklabs (Scott Technology)
- *Disclaimer: Major Players sorted in no particular order

Market Opportunities and Future Outlook
Whitespace is building around scaling modular automation beyond single mine sites into the commercial laboratory and multi-client testing ecosystem, where standardization and throughput are monetized across many operators. Scott Technology’s June 2026 contract to place an Automated Modular Solution (AMS) crush cell into a large-scale commercial minerals laboratory is a concrete signal that modular lab islands are being packaged for broader service-lab workflows, not only owner-operator deployments. This creates room for vendors that can deliver repeatable modules, rapid commissioning, and consistent QA/QC, while integrating outputs into client LIMS and reporting formats.
Faster quantitative ore characterization also remains a strong opportunity area for grade control and process optimization, particularly as ore bodies become more complex and critical minerals programs demand tighter traceability. Metso’s June 2026 installation of a TESCAN TIMA automated mineralogy analyzer at its Pori, Finland research center targets characterization cycles compressed from days to hours, aligning with demand for high-throughput, data-rich workflows supported by automated handling and digital data management. Vale’s June 2026 commissioning of an AI-enabled processing plant in Itabira, Brazil, with extensive automation and remote robotic capabilities, further reinforces pull-through for integrated analytics and data pipelines from sample to decision. Together, these evidence points support opportunities for vendors to bundle robotics, analyzers, and LIMS connectivity with open interfaces, validated traceability, and automation-as-a-service structures that reduce upfront risk for mid-tier and junior miners constrained by payback.
Recent Industry Developments
- June 2026: Scott Technology secured a contract to deploy its Rocklabs Automated Modular Solution (AMS) crush cell into a large-scale commercial minerals testing laboratory. The move extends modular lab automation from mine-site deployments into third-party testing workflows, where standardized throughput and repeatability can be scaled across multiple mining clients.
- May 2026: FLSmidth was awarded an order worth DKK 300 million to supply key beneficiation technologies for a banded hematite quartzite (BHQ) iron ore project in South Asia, including High-Pressure Grinding Rolls and stirred media mills. The award strengthens integrated processing flowsheets that increasingly rely on tighter measurement, sampling, and laboratory-control loops to stabilize product quality.
- September 2024: FLSmidth agreed to acquire Tipco (TIPCO Tudeshki Industrial Process Control GmbH) to strengthen its digital pumps, cyclones, and valves offering with particle size distribution measurement capability. Adding instrumentation and control know-how supports more automated process control architectures, increasing demand for compatible laboratory and at-line analytics that can feed closed-loop optimization.


Research Methodology Framework and Report Scope
Market Definition and Coverage
For this methodology, the market covers automation solutions used inside mining laboratories to prepare, test, analyze, and report samples, including related hardware, software, and supporting services tied to lab workflows in mining.
Scope exclusions: It does not count general mine-site automation that is outside the lab, and it does not include routine consumables that are not part of an automation solution.
Segmentation Overview
- By Product
- Robotics
- Laboratory Information Management Systems (LIMS)
- Container Laboratory
- Automated Analyzers and Sample Preparation Equipment
- By Automation Level
- Total Lab Automation (TLA)
- Modular / Island Automation
- By Mining Phase
- Exploration and Grade Control
- Mine Development and Planning
- Production and Beneficiation
- Closure and Environmental Monitoring
- By Commodity Processed
- Iron Ore
- Copper
- Gold
- Coal and Battery Minerals (Ni, Li, Co)
- By Geography
- North America
- United States
- Canada
- Mexico
- Europe
- United Kingdom
- Germany
- France
- Italy
- Rest of Europe
- Asia-Pacific
- China
- Japan
- India
- South Korea
- Rest of Asia-Pacific
- Middle East
- Israel
- Saudi Arabia
- United Arab Emirates
- Turkey
- Rest of Middle East
- Africa
- South Africa
- Egypt
- Rest of Africa
- South America
- Brazil
- Argentina
- Rest of South America
- North America
Data Sources, Market Sizing, and Validation
Desk Research
To build a clean starting dataset, we map how mining lab automation demand connects to exploration and production activity, then align it with public indicators that can be tracked year over year. Common inputs include government mining statistics and mineral production series from sources such as the USGS, national geological surveys, and energy or mining ministries, which help frame commodity activity and country exposure.
We also use standards and technical references that shape laboratory workflows and quality requirements, such as ISO methods used in assay and sample handling, plus peer-reviewed papers on automated sample preparation and analytical instrumentation performance. For market context and adoption signals, we review company annual reports, investor presentations, reputable press coverage, and association materials on mining and laboratory practices. Where needed, paid subscriptions are used for company financials and intelligence, patent lookups, shipment or trade checks, and tender tracking to confirm timing of larger lab buildouts. These sources are illustrative, and we also used other public and paid references to collect data, validate assumptions, and clarify gaps.
Primary Interviews and Surveys
Primary work was used to pressure-test scope boundaries and make sure the model reflects what labs actually buy and deploy, not only what is marketed. We spoke with a mix of solution providers, mining lab operators, and engineering or procurement stakeholders across major producing regions so pricing ranges, rollout cadence, and replacement cycles could be confirmed. When responses conflicted, we rechecked definitions and followed up until the core assumptions (automation level, mine phase linkage, and service attachment) matched how projects are delivered.
Distribution of primary research fieldwork respondents
| Company type | Respondent position | Region |
|---|---|---|
| Top tier: 29% | CXOs: 13% | APAC: 39% |
| Mid tier: 55% | Functional/Unit leaders: 35% | EMEA: 37% |
| Smaller Players: 16% | Managers: 52% | Americas: 24% |
Market-Sizing & Forecasting
Sizing starts from a top-down build where mining activity and lab workload intensity are translated into an addressable demand pool for automated sample preparation, analytical systems, robotics, and lab informatics. Country and commodity exposure is reconstructed using public production and project signals, then adjusted by adoption rates that differ by mine phase and lab maturity.
To keep the numbers grounded, we corroborate totals using selective bottom-up checks, such as sampled system pricing, typical module counts per lab, and service and software attachment rates gathered from interviews and public materials. Inputs that matter most in this market include exploration and grade control spend direction, production and beneficiation throughput, the shift toward battery minerals testing, average selling price progression for modular systems, and lab staffing constraints that push automation projects forward. Where data is missing for smaller geographies, we handle gaps by using comparable mining profiles and then applying conservative penetration assumptions, which are later validated in calls.
Forecasts are built using scenario analysis around commodity cycles and mining capex, followed by expected automation penetration gains and replacement demand. Assumptions are tightened using expert views on project lead times, procurement behavior, and the pace of LIMS and robotics upgrades so the forecast remains repeatable and explainable.
Data Validation & Update Cycle
Outputs are cross-checked against independent signals, including mining production trends, announced lab expansions, and the implied spend per active lab footprint, which helps spot results that drift too far from reality. Variances are reviewed in steps, first by the lead analyst and then through an internal peer review where definitions and formulas are rechecked before sign off.
If an outlier appears, for example a jump that cannot be explained by commodity, region, or price movement, we revisit assumptions and, when needed, recontact interviewees for clarification. Reports are refreshed annually, with interim updates when material events occur, such as major project delays, regulatory changes affecting lab practices, or sudden shifts in mining investment. Before delivery, a final pass is completed so clients receive an updated view based on the latest available information.
Mordor Intelligence's Mining Laboratory Automation Market Sizing Compared With Other Published Estimates
Published market sizes for mining laboratory automation often do not match because each publisher chooses a different line for what counts as automation inside the lab, how services are attached, and which years are treated as the main reference points.
A common source of spread is whether the estimate includes only mining-specific lab deployments or also folds in adjacent industrial lab spending that is not tied to mining workflows. Differences also come from how fast ASPs are assumed to rise as labs move from modular to fuller automation. The table points to these scope and pricing choices, and the model keeps the total tied to mining lab use cases and a 2025 value anchor of USD 7.22 B, which is why the reference year alignment looks different for Mordor Intelligence.
Benchmark comparison
| Source | Market Size | Gaps in Research Methodology |
|---|---|---|
| Mordor Intelligence | USD 7.22 B (2025) | |
| Trade Publisher A | USD 2.50 B (2024) | Uses a narrower definition that appears to focus on automation systems sold as packaged solutions, and it likely excludes several mining lab informatics and modular upgrade spend lines that are counted when deployed as part of lab workflows. |
| Industry Report B | USD 2.68 B (2025) | Seems to emphasize a limited product basket and applies a lower adoption curve, which reduces the modeled installed base expansion and keeps software and services attachment smaller than what interviews suggested. |
Across the three figures, the main lesson is that scope and the treatment of modular upgrades drive most of the difference, followed by how software and services are bundled into the total. By keeping each line item linked to mining lab activities and cross-checking assumptions with project and pricing signals, we end up with a total that is easier to trace and update as new deployments are announced.


Key Questions Answered in the Report
What is the current size of the Mining Laboratory Automation market?
The market is valued at USD 7.95 billion in 2026 and is forecast to reach USD 12.88 billion by 2031.
Which product segment leads spending today?
Robotics holds the largest 33.60% share, driven by the need to automate hazardous sample-preparation tasks.
Why are containerized laboratories gaining interest?
They offer fully equipped analytical capabilities that can be deployed on-site within weeks, ideal for remote exploration and fast-tracked green-field projects.
Which region is growing fastest?
Middle East & Africa posts the highest 14.86% CAGR, propelled by sovereign wealth fund investments and new digital mines.
How long is the typical payback period for automation projects?
Large operations report 18–24-month paybacks, while mid-tier mines often face periods longer than 3 years unless leasing or service-based models are used.
What role does AI play in laboratory automation?
AI underpins predictive maintenance, real-time data analytics, and advanced image-based ore characterization, reducing downtime and enhancing decision accuracy.
Page last updated on:





