Total Lab Automation Market Size and Share
Market Overview
| Study Period | 2020 - 2031 |
|---|---|
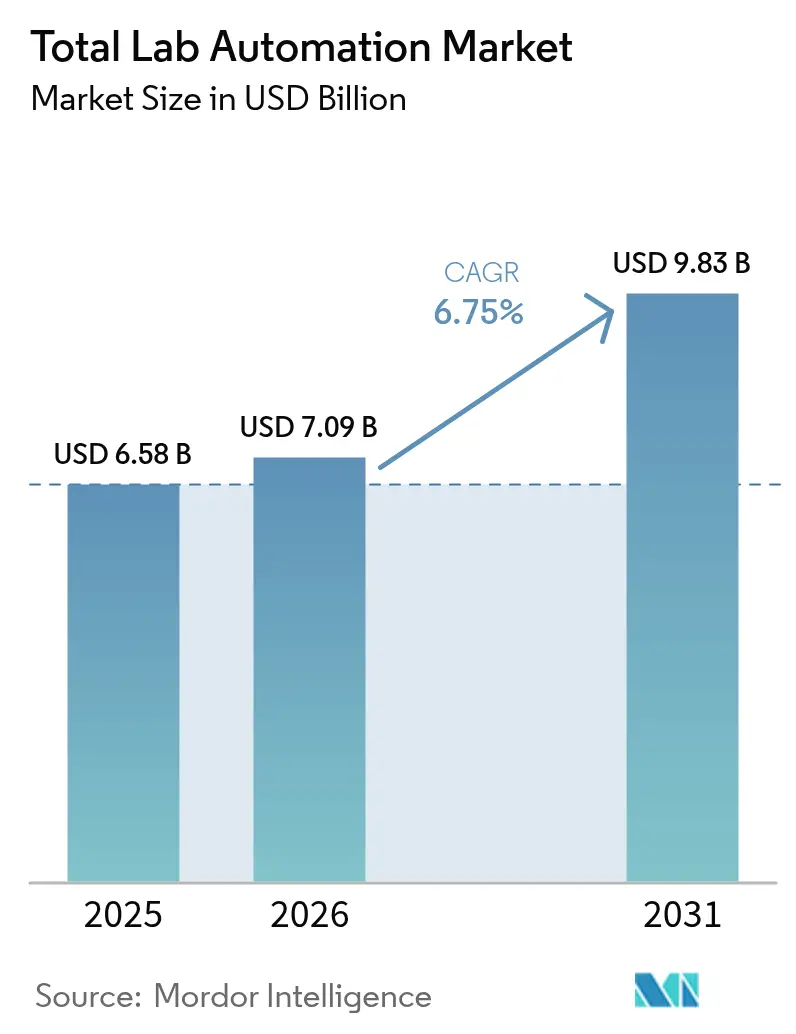
| Market Size (2026) | USD 7.09 Billion |
| Market Size (2031) | USD 9.83 Billion |
| Growth Rate (2026 - 2031) | 6.75% CAGR |
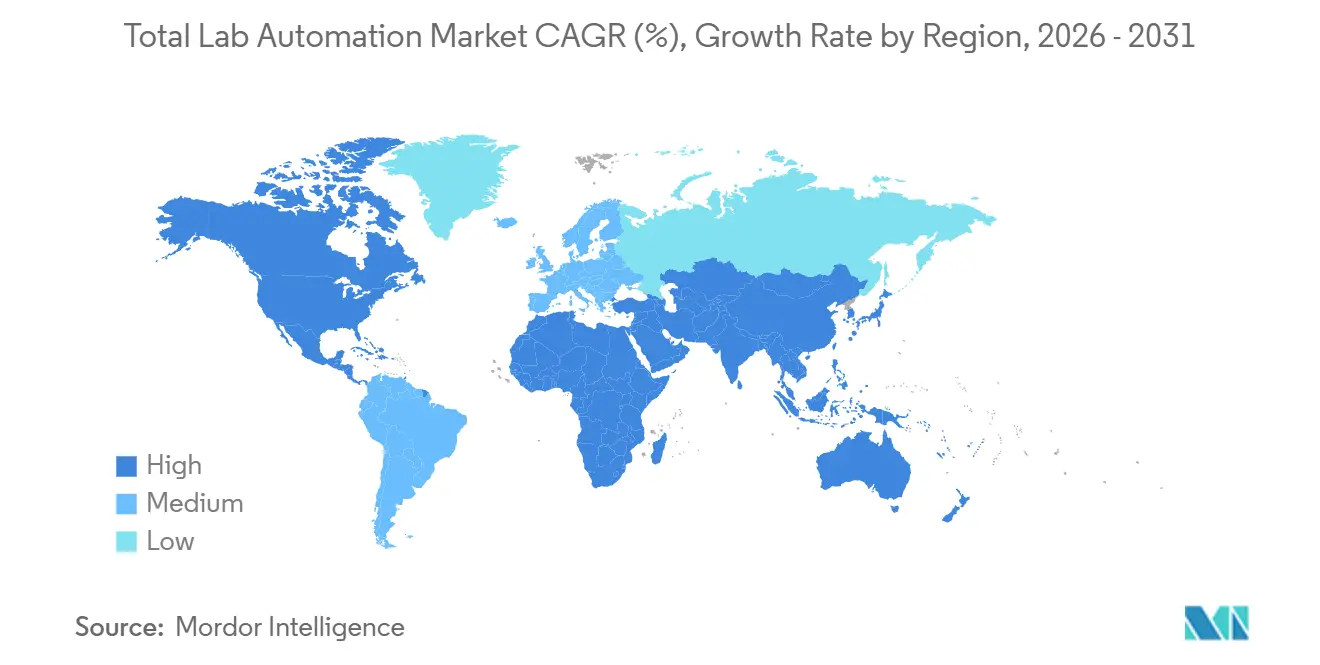
| Fastest Growing Market | Asia Pacific |
| Largest Market | North America |
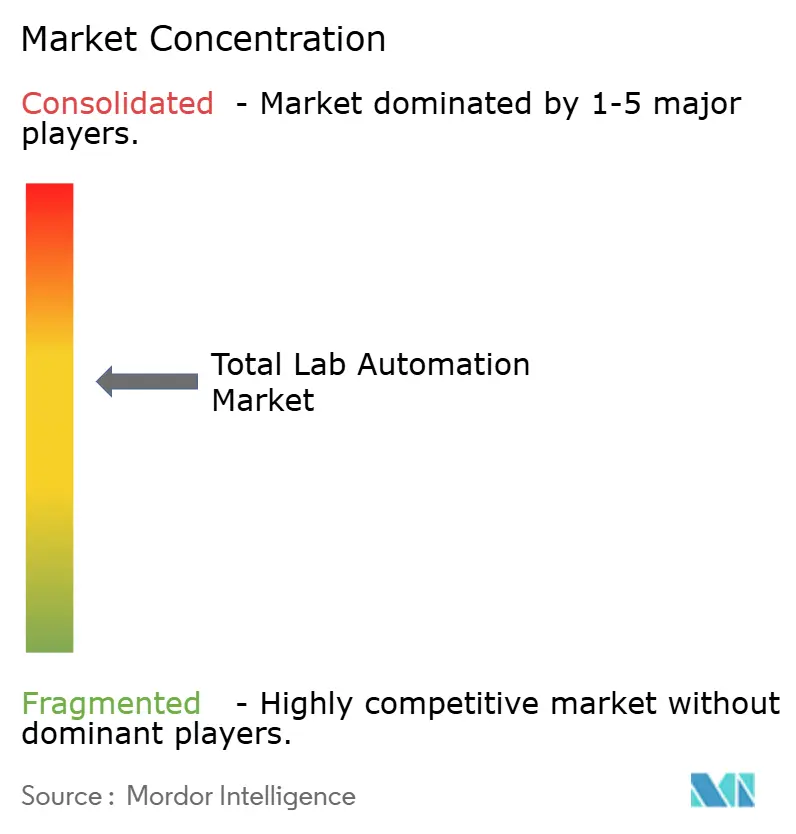
| Market Concentration | Medium |
Major Players *Disclaimer: Major Players sorted in no particular order Image © Mordor Intelligence. Reuse requires attribution under CC BY 4.0. | |
Total Lab Automation Market Analysis by Mordor Intelligence
The total lab automation market size was valued at USD 6.58 billion in 2025 and estimated to grow from USD 7.09 billion in 2026 to reach USD 9.83 billion by 2031, at a CAGR of 6.75% during the forecast period (2026-2031). Continuous migration from manual workflows toward integrated automation islands, rising compliance costs under the EU IVDR, and quality-control demands in cell and gene-therapy manufacturing keep capital flowing into high-throughput liquid handlers, track systems, and laboratory information software. Hospital laboratories cite double-digit technologist vacancy rates, so management teams view robotics as a hedge against staffing volatility. Vendors now embed artificial-intelligence firmware that flags calibration drift before downtime, giving procurement officers extra justification for six-figure purchases. Collectively, these factors position the Total lab automation market for durable mid-single-digit growth as adoption spreads from Tier-1 reference labs to mid-volume regional centers.
Key Report Takeaways
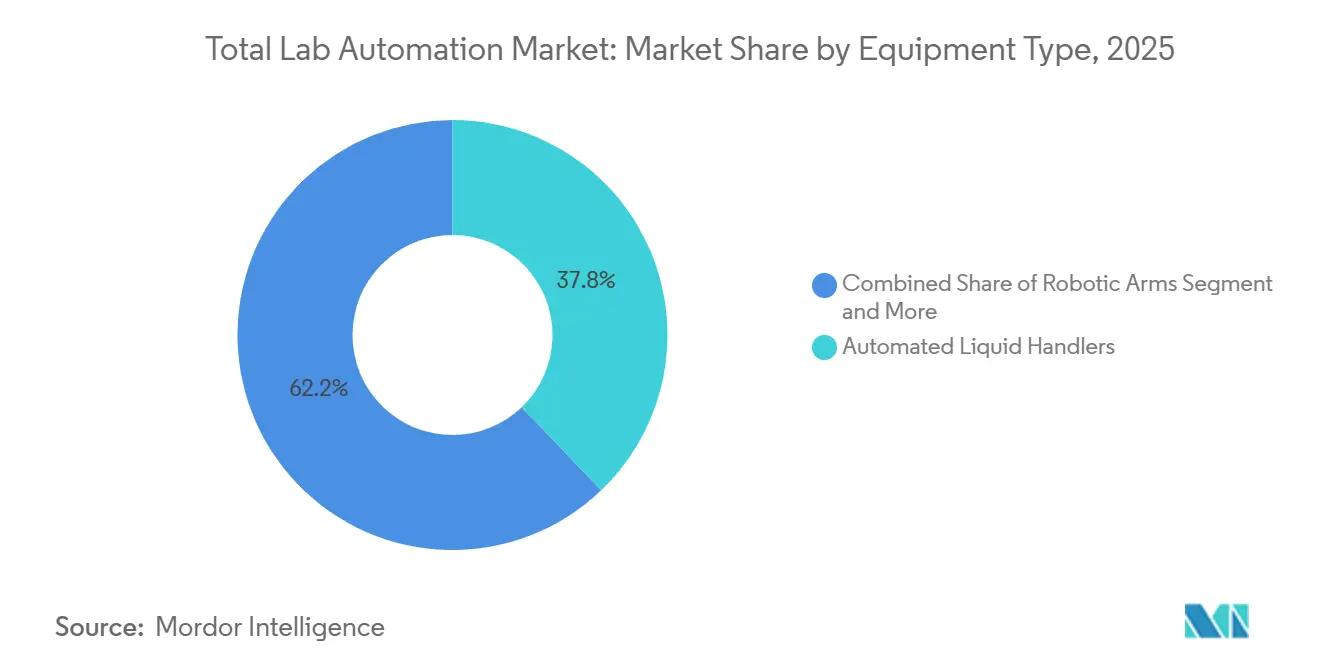
- By equipment type, automated liquid handlers led with 37.83% of the Total lab automation market share in 2025, while automated storage and retrieval systems are projected to expand at an 8.41% CAGR through 2031.
- By software, laboratory information management systems held 45.67% of the Total lab automation market size in 2025, and electronic lab notebooks are advancing at an 8.01% CAGR to 2031.
- By automation scope, analytical and core-lab automation captured 50.21% of 2025 revenue, yet post-analytical solutions record the fastest 7.21% CAGR over the forecast window.
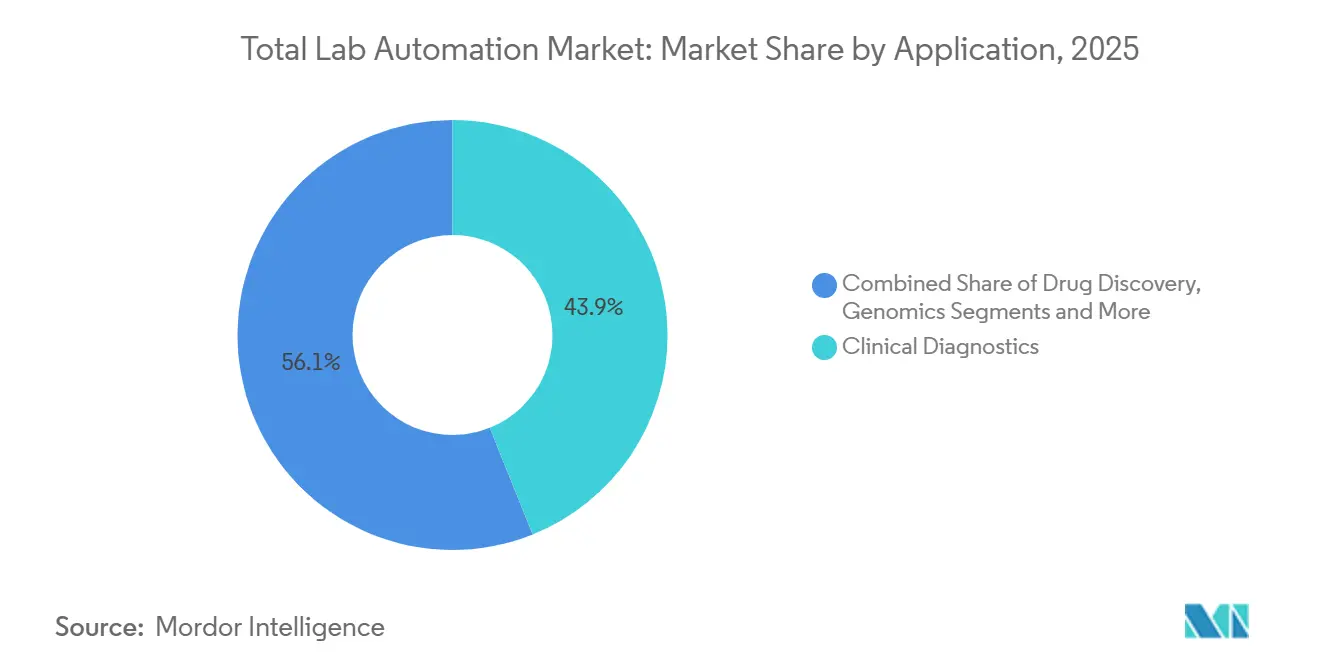
- By application, clinical diagnostics accounted for 43.92% of the 2025 Total lab automation market size, whereas genomics is growing at a 7.99% CAGR between 2026-2031.
- By end user, hospitals and diagnostic reference labs held 42.68% share in 2025 while CROs and CDMOs post the highest 7.02% CAGR to 2031.
- By geography, North America contributed 38.11% of 2025 revenue and Asia-Pacific is set to rise at a 6.99% CAGR, narrowing the gap by 2031.
Note: Market size and forecast figures in this report are generated using Mordor Intelligence’s proprietary estimation framework, updated with the latest available data and insights as of 2026.
Global Total Lab Automation Market Trends and Insights
Drivers Impact Analysis*
| Driver | (~) % Impact on CAGR Forecast | Geographic Relevance | Impact Timeline |
|---|---|---|---|
| Integration of AI-enabled predictive maintenance | +1.2% | Global, led by North America and Western Europe | Medium term (2–4 years) |
| EU IVDR-driven upgrade cycle in clinical diagnostics | +1.5% | Europe, spill-over to UK and Middle East | Short term (≤ 2 years) |
| High-throughput QC demand in cell and gene-therapy manufacturing | +1.3% | North America, Europe, Asia-Pacific core | Long term (≥ 4 years) |
| Decentralized and virtual-trial micro-labs | +0.8% | North America, Western Europe | Medium term (2–4 years) |
| Rising biobank volumes needing ultra-cold automated storage | +0.7% | Global, concentrated in research hubs | Long term (≥ 4 years) |
| Government-funded smart-hospital build-outs (GCC and China) | +1.0% | Middle East (GCC), China, spill-over to SEA | Short term (≤ 2 years) |
| Source: Mordor Intelligence | |||
Integration of AI-Enabled Predictive Maintenance
Machine-learning algorithms now ship inside liquid-handler firmware, predicting pump-seal wear and robotic-arm drift before downtime disrupts sample runs. A 2025 study of clinical and research laboratories showed mean time-to-repair dropping by roughly 30%, directly improving instrument utilization.[1]Mayo Clinic Laboratories, “Predictive Maintenance Case Study,” mayocliniclabs.com Contract research organizations with penalty-laden service agreements are early adopters, while hospitals appreciate that predictive alerts align with scheduled maintenance windows. Still, 2025 polling of laboratory scientists revealed widespread “shadow AI” use of consumer chatbots that fall outside validated systems, exposing audit-trail gaps the FDA is beginning to scrutinize. As regulators outline guidance, vendor-embedded AI is likely to outpace informal workarounds, reinforcing this driver’s momentum.
EU IVDR-Driven Upgrade Cycle in Clinical Diagnostics
The European Union’s In Vitro Diagnostic Regulation set May 2022 and May 2025 transition deadlines that forced laboratories to retire legacy Class B, C, and D devices or validate costly middleware retrofits. Many facilities chose turnkey automation islands that bundle analyzers, tracks, and compliant software into a single conformity assessment. Procurement teams condensed multi-year roadmaps into 18-month buying sprees, igniting demand peaks that persist through 2026 as grace periods expire. Real-time performance-evaluation clauses embedded in the regulation also require continuous data aggregation, something standalone boxes cannot deliver without new middleware. These combined compliance triggers make IVDR the single most significant near-term growth catalyst for the Total lab automation market in Europe.
High-Throughput QC Demand in Cell and Gene-Therapy Manufacturing
Autologous CAR-T and allogeneic stem-cell therapies generate thousands of batch-specific sterility, potency and identity tests that manual pipetting cannot scale. Leading CDMOs invested heavily in liquid handlers with sterile-tip disposal and environmental enclosures to meet FDA 21 CFR Part 211 and EMA Annex 1 quality mandates.[2]Lonza, “Vacaville Site Investment Announcement,” lonza.com At Lonza’s Vacaville campus, a USD 500 million retrofit linked upstream bioreactor data directly to downstream analytics, shaving hours off batch-release timelines. Thermo Fisher Scientific made similar moves, pairing single-use bioreactors with automated fill-finish modules that transmit process data into the LIMS backbone.[3]Thermo Fisher Scientific, “Biologics Manufacturing Expansion,” thermofisher.com These investments prove that automation is becoming non-negotiable for CGT economics rather than an optional efficiency upgrade.
Government-Funded Smart-Hospital Build-Outs
Gulf Cooperation Council states, and several Chinese provinces stipulate automation readiness in new hospital tenders, embedding track systems, middleware, and robotic arms at the design phase. The United Arab Emirates’ PureLab hub consolidates specimens from multiple hospitals under ISO 15189 accreditation, trimming per-test labor costs and harmonizing quality metrics. China’s provincial health commissions are pursuing similar regional diagnostic centers that process up to 15,000 specimens daily, mirroring Mayo Clinic’s Rochester throughput benchmark. Local-content requirements push multinational vendors into joint ventures, yet enormous volume potential offsets margin compression, delivering a powerful, government-anchored demand stream.
Restraints Impact Analysis*
| Restraint | (~) % Impact on CAGR Forecast | Geographic Relevance | Impact Timeline |
|---|---|---|---|
| Seven-figure CAPEX and lengthy ROI for true TLA islands | -1.1% | Global, acute in mid-sized labs | Medium term (2–4 years) |
| Legacy middleware gaps with next-gen analyzers | -0.9% | North America, Europe | Short term (≤ 2 years) |
| Cybersecurity and data-sovereignty compliance burden | -0.7% | Global, stringent in EU and North America | Long term (≥ 4 years) |
| Supply-chain volatility in precision mechatronics | -0.8% | Global, concentrated in Asia-Pacific supply base | Short term (≤ 2 years) |
| Source: Mordor Intelligence | |||
Seven-Figure CAPEX and Lengthy ROI for True TLA Islands
Complete automation islands often exceed USD 1 million once track hardware, middleware licenses and building modifications are tallied. A peer-reviewed South Korean hospital study placed payback between 3.54-6.24 years, even after 86-90% manual-step reduction. Mid-volume labs handling fewer than 5,000 daily samples struggle to clear capital-budget hurdles, opting instead for incremental pre- or post-analytical modules. This staggered adoption pattern tempers the overall Total lab automation market growth trajectory despite clear long-term efficiency benefits.
Legacy Middleware Gaps with Next-Gen Analyzers
Many labs still run 10-year-old middleware that cannot parse HL7 FHIR or proprietary data packets sent by modern analyzers. Interface validation for each new connection can consume several weeks of informatics labor, extending instrument commissioning and exposing manual transcription risk. Middleware vendors sell upgrade paths, but schema migrations and staff retraining raise total ownership costs, delaying analyzer refresh cycles. Standards bodies are working on unified data models, yet implementation lags, making this a persistent headwind.
*Our forecasts treat driver/restraint impacts as directional, not additive. The impact forecasts reflect baseline growth, mix effects, and variable interactions.
Segment Analysis
By Equipment Type: Liquid Handlers Anchor Pharma Workflows
Automated liquid handlers held 37.83% of the 2025 Total lab automation market share, underscoring their role in ELISA, high-throughput screening and nucleic-acid extraction. Robotic arms shuttle specimen racks between centrifuges, analyzers and archival modules, forming the mechanical backbone of many islands. Automated storage and retrieval systems, the fastest-growing subsegment at an 8.41% CAGR, safeguard millions of biobank vials at minus 80 °C, tracking barcodes and chain-of-custody logs. Together these platforms illustrate the sector’s pivot toward modular ecosystems where specialized hardware collaborates through middleware rather than monolithic single-vendor solutions.
Second-tier devices, clinical chemistry analyzers, automated plate handlers, and specialty robotic accessories, round out the equipment landscape. Hospitals favor chemistry-immuno tracks that guarantee same-day turnaround, while proteomics labs rely on plate handlers feeding mass spectrometers. Vendors focusing on narrow performance niches, such as sub-nanoliter dispensing or cryogenic retrieval speed, win contracts even against diversified conglomerates, sustaining a vibrant competitive fabric within the Total lab automation market.


By Software: LIMS Dominance Faces ELN Disruption
Laboratory information management systems commanded 45.67% of 2025 software revenue, providing specimen tracking, audit trails and electronic signatures that satisfy FDA 21 CFR Part 11 and ISO 17025. Electronic lab notebooks, however, are on pace for an 8.01% CAGR as researchers abandon paper for searchable, cloud-connected records. User surveys show only 62% are happy with current ELNs and just 5% can analyze data inside the platform, fueling demand for next-generation offerings with embedded analytics. Scientific data management systems, LIS and chromatography data systems occupy specialty niches but require tight middleware coupling to avoid siloed archives.
Procurement teams now evaluate software roadmaps as carefully as hardware specs. A hospital may deploy a LIS for patient reporting, a LIMS for specimen logistics and an ELN for method development, each needing secure interfaces. Vendors that ship low-code integration tools gain favor, signaling software interoperability as a future purchase criterion across the Total lab automation market.
By Automation Scope: Post-Analytical Gains Momentum
Analytical and core-lab automation captured 50.21% of 2025 spending because chemistry and immunoassay tracks deliver the clearest labor savings. Yet post-analytical modules—auto-verification, archival and data reconciliation—show the quickest 7.21% CAGR as labs recognize that releasing results, not running assays, often sets the turnaround clock. Auto-verification algorithms compare findings with patient history, freeing technologists for complex reviews and trimming average result release time by meaningful minutes.
Pre-analytical robotics that decap, aliquot and sort tubes protect sample integrity upstream. Full-scope islands promise end-to-end automation but remain viable mainly for mega-volume centers processing over 5,000 daily specimens. Mid-volume hospitals instead adopt pre- or post-analytical modules first, adding core-lab tracks when volumes scale, an incremental pathway that broadens the Total lab automation market addressable base.
By Application: Genomics Outpaces Legacy Diagnostics
Clinical diagnostics contributed 43.92% of 2025 revenue, driven by routine panels reimbursed on throughput. Genomics, however, posts a 7.99% CAGR as falling sequencing costs unlock oncology, rare-disease and pharmacogenomic testing. Illumina’s NovaSeq X, launched in 2024, pushes genome costs near USD 200, catalyzing national screening pilots. Automation platforms that integrate library prep, run setup and downstream bioinformatics are in high demand.
Drug discovery, proteomics, metabolomics and biobank management together form a diversified tail. High-density liquid handlers capable of nanoliter dispensing support 1,536-well screening, while cryogenic stores keep longitudinal cohort samples viable for decades. This spread of use cases ensures that the Total lab automation market does not rely solely on clinical diagnostics for growth.
By End User: CROs and CDMOs Lead Growth
Hospitals and diagnostic reference labs retained 42.68% of 2025 revenue yet CROs and CDMOs record the highest 7.02% CAGR, reflecting biopharma’s outsourcing wave. Quality-control release testing, sterility assays and potency checks are now routinely automated inside contract facilities, shortening batch-release lead times. Lonza’s Vacaville upgrade and Thermo Fisher’s new single-use bioreactors exemplify capacity-plus-automation investments that smaller CDMOs scramble to match.
Pharmaceutical manufacturers automate stability studies and real-time release tests, while academic institutes pool grant budgets to share automation cores. Government reference labs adopt robotics in biosafety-level facilities to limit pathogen exposure. Each archetype values a different return metric, labor cost, sample throughput, regulatory compliance or safety, broadening solution diversity within the Total lab automation market.
Geography Analysis
North America generated 38.11% of 2025 revenue as Medicare fee schedules reward rapid turnaround and laboratories address double-digit technologist vacancies. Mayo Clinic’s Rochester core lab handles more than 6 million tests annually after halving required blood volume through micro-sample analyzers, underscoring scale achievable under full islands. Labcorp’s 2026 installation of the cobas Mass Spec platform introduced U.S. commercial labs to mass-spectrometry immunoassays, elevating automation sophistication and spurring competitors to evaluate similar upgrades.
Asia-Pacific is the fastest-growing region at a 6.99% CAGR through 2031. Provincial governments in China bankroll regional diagnostic centers with integrated tracks, while India embeds automation clauses in greenfield hospital tenders. Japan’s aging population drives hematology and coagulation analyzer demand, and Singapore positions itself as an automation startup hub. Collectively, these trends narrow the historic volume gap with North America and expand the Total lab automation market footprint eastward.
Europe’s sizable share stems from IVDR deadlines that bundle analyzer and middleware replacement into single procurements. Smaller but rapidly scaling pockets exist in South America, the Middle East and Africa. The United Arab Emirates’ PureLab hub processes multi-hospital specimens under ISO 15189 accreditation, illustrating a regionalization model that Brazil and Mexico watch closely. Emerging-market labs often start with modular solutions, building toward full islands as reimbursement and infrastructure mature.

Competitive Landscape
The Total lab automation market remains moderately fragmented. Danaher, Roche Diagnostics, Siemens Healthineers and Abbott Laboratories form the lead pack, yet none tops 20% share, leaving space for niche innovators. Danaher’s 2024 acquisition of an AI-driven middleware startup underscores the arms race toward predictive maintenance and orchestration intelligence. Roche pairs chemistry, immunoassay and emerging mass-spec modules on a single track, betting on consolidated conformity assessment to win IVDR-pressed labs.
Specialists thrive in white spaces. Opentrons Labworks sells open-source liquid handlers under USD 10,000, unlocking robotics for academic labs. Biosero and Formulatrix integrate third-party devices through software SDKs, offering vendor-neutral cells for protein crystallography and high-throughput screening. Cryogenic-storage experts Brooks and Azenta dominate ultra-cold automation, a fast-expanding niche tied to biobank growth.
Cybersecurity and data-sovereignty laws spur demand for on-premises LIMS in jurisdictions restricting cross-border transfers. Local vendors in China and India thus gain share when multinationals favor cloud deployment. Overall, suppliers able to blend hardware reliability, middleware openness and validation support are positioned to outpace those competing mainly on mechanical specs.
Total Lab Automation Industry Leaders
Danaher Corp. (Beckman Coulter)
Roche Diagnostics International AG
Siemens Healthineers AG
Abbott Laboratories
Tecan Group Ltd.
- *Disclaimer: Major Players sorted in no particular order

Recent Industry Developments
- January 2026: Labcorp began deploying Roche Diagnostics’ cobas Mass Spec platform in Burlington, North Carolina, introducing mass-spectrometry immunoassays to U.S. commercial laboratories.
- December 2025: Thermo Fisher Scientific added 8 single-use bioreactors and multiple fill-finish lines, supported by a USD 1.5 million digital-enablement program linking process data to analytics.
- January 2025: Cimcorp and Murata Machinery partnered to debut dual-reach shuttles and fully automated “Dreamfield” sample warehouses, advancing high-density, refrigerated storage solutions for laboratories.
- December 2024: Thermo Fisher Scientific launched the InnoviGene Suite, automating capillary electrophoresis for genomic analysis and boosting reproducibility in precision medicine pipelines.


Global Total Lab Automation Market Report Scope
Total Laboratory Automation (TLA) is a laboratory automation system to carry out very repetitive activities. Robotic equipment is used in place of human operators to prepare and transport specimens.
The Total Lab Automation Market Report is Segmented by Equipment Type (Liquid Handlers, Robotic Arms, Storage Systems, Analyzers, and Plate Handlers), Software (LIMS, SDMS, ELN, LIS, and CDS), Automation Scope (Pre-Analytical, Analytical, Post-Analytical, and TLA Islands), Application (Diagnostics, Genomics, Drug Discovery, and More), End-User (Pharma/Biotech, and More), and Geography. The Market Forecasts are Provided in Value (USD).
| Automated Liquid Handlers |
| Robotic Arms |
| Automated Storage and Retrieval Systems |
| Clinical Chemistry and Immuno-Analysers |
| Automated Plate Handlers |
| Laboratory Information Management Systems (LIMS) |
| Scientific Data Management Systems (SDMS) |
| Electronic Lab Notebooks (ELN) |
| Laboratory Information Systems (LIS) |
| Chromatography Data Systems (CDS) |
| Pre-Analytical Automation |
| Analytical / Core-Lab Automation |
| Post-Analytical Automation |
| Total Lab Automation (TLA) Islands |
| Clinical Diagnostics |
| Genomics |
| Drug Discovery |
| Proteomics and Metabolomics |
| Biobank and Sample Management |
| Pharmaceutical and Biotechnology Companies |
| CROs / CDMOs |
| Hospitals and Diagnostic Reference Labs |
| Academic and Government Institutes |
| North America | United States |
| Canada | |
| Mexico | |
| South America | Brazil |
| Argentina | |
| Rest of South America | |
| Europe | Germany |
| United Kingdom | |
| France | |
| Italy | |
| Spain | |
| Rest of Europe | |
| Asia-Pacific | China |
| India | |
| Japan | |
| South Korea | |
| Australia and New Zealand | |
| Rest of Asia-Pacific | |
| Middle East | Saudi Arabia |
| United Arab Emirates | |
| Turkey | |
| Rest of Middle East | |
| Africa | South Africa |
| Nigeria | |
| Egypt | |
| Rest of Africa |
| By Equipment Type | Automated Liquid Handlers | |
| Robotic Arms | ||
| Automated Storage and Retrieval Systems | ||
| Clinical Chemistry and Immuno-Analysers | ||
| Automated Plate Handlers | ||
| By Software | Laboratory Information Management Systems (LIMS) | |
| Scientific Data Management Systems (SDMS) | ||
| Electronic Lab Notebooks (ELN) | ||
| Laboratory Information Systems (LIS) | ||
| Chromatography Data Systems (CDS) | ||
| By Automation Scope | Pre-Analytical Automation | |
| Analytical / Core-Lab Automation | ||
| Post-Analytical Automation | ||
| Total Lab Automation (TLA) Islands | ||
| By Application | Clinical Diagnostics | |
| Genomics | ||
| Drug Discovery | ||
| Proteomics and Metabolomics | ||
| Biobank and Sample Management | ||
| By End-User | Pharmaceutical and Biotechnology Companies | |
| CROs / CDMOs | ||
| Hospitals and Diagnostic Reference Labs | ||
| Academic and Government Institutes | ||
| By Geography | North America | United States |
| Canada | ||
| Mexico | ||
| South America | Brazil | |
| Argentina | ||
| Rest of South America | ||
| Europe | Germany | |
| United Kingdom | ||
| France | ||
| Italy | ||
| Spain | ||
| Rest of Europe | ||
| Asia-Pacific | China | |
| India | ||
| Japan | ||
| South Korea | ||
| Australia and New Zealand | ||
| Rest of Asia-Pacific | ||
| Middle East | Saudi Arabia | |
| United Arab Emirates | ||
| Turkey | ||
| Rest of Middle East | ||
| Africa | South Africa | |
| Nigeria | ||
| Egypt | ||
| Rest of Africa | ||


Key Questions Answered in the Report
How big will Total lab automation market size be by 2031?
It is forecast to reach USD 9.83 billion, expanding at a 6.75% CAGR over 2026-2031.
Which equipment type generates the highest revenue today?
Automated liquid handlers held 37.83% of 2025 revenue, making them the leading equipment subsegment.
Which geographic region is growing the fastest?
Asia-Pacific is projected to post a 6.99% CAGR, the quickest among all regions through 2031.
What is the main barrier limiting new automation projects?
Seven-figure capital expenditure and payback periods exceeding three years remain the primary adoption restraints for mid-volume laboratories.
Which application area is expanding most rapidly?
Genomics workflows, propelled by falling sequencing costs, are advancing at a 7.99% CAGR through 2031.
Who are the key players shaping competitive dynamics?
Danaher, Roche Diagnostics, Siemens Healthineers and Abbott Laboratories lead, while innovators like Opentrons, Biosero and Brooks Life Sciences exploit specialized niches.
Page last updated on:


