Military Unmanned Ground Vehicle Market Size and Share
Market Overview
| Study Period | 2020 - 2031 |
|---|---|
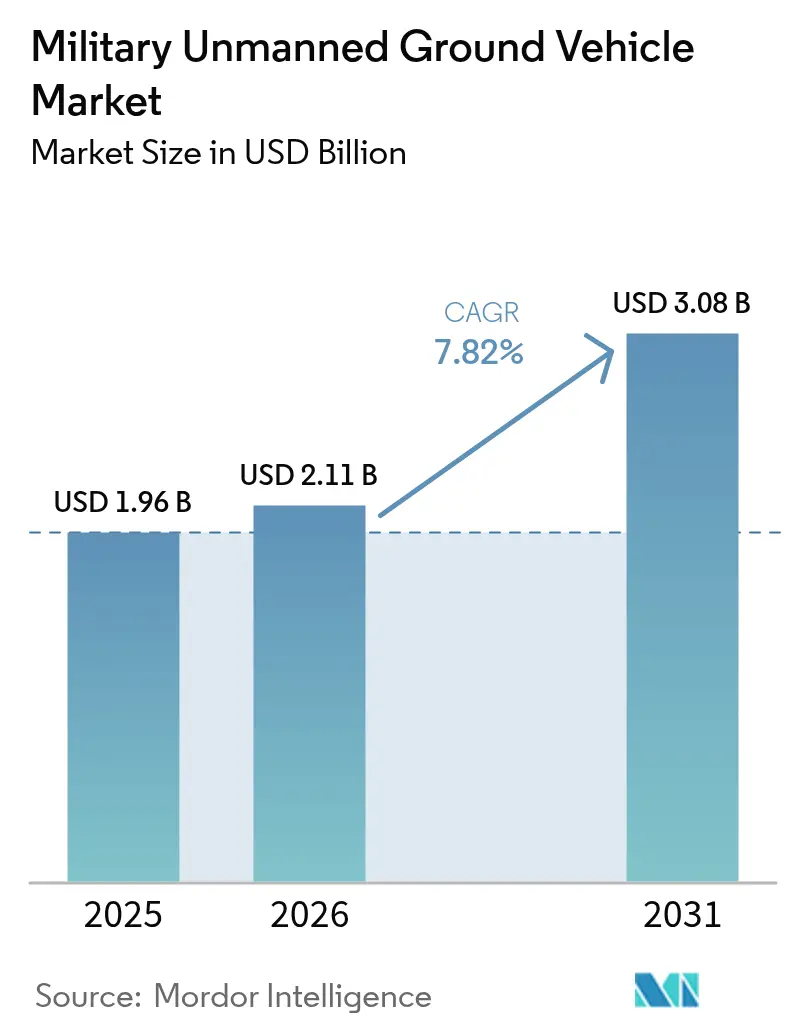
| Market Size (2026) | USD 2.11 Billion |
| Market Size (2031) | USD 3.08 Billion |
| Growth Rate (2026 - 2031) | 7.82% CAGR |
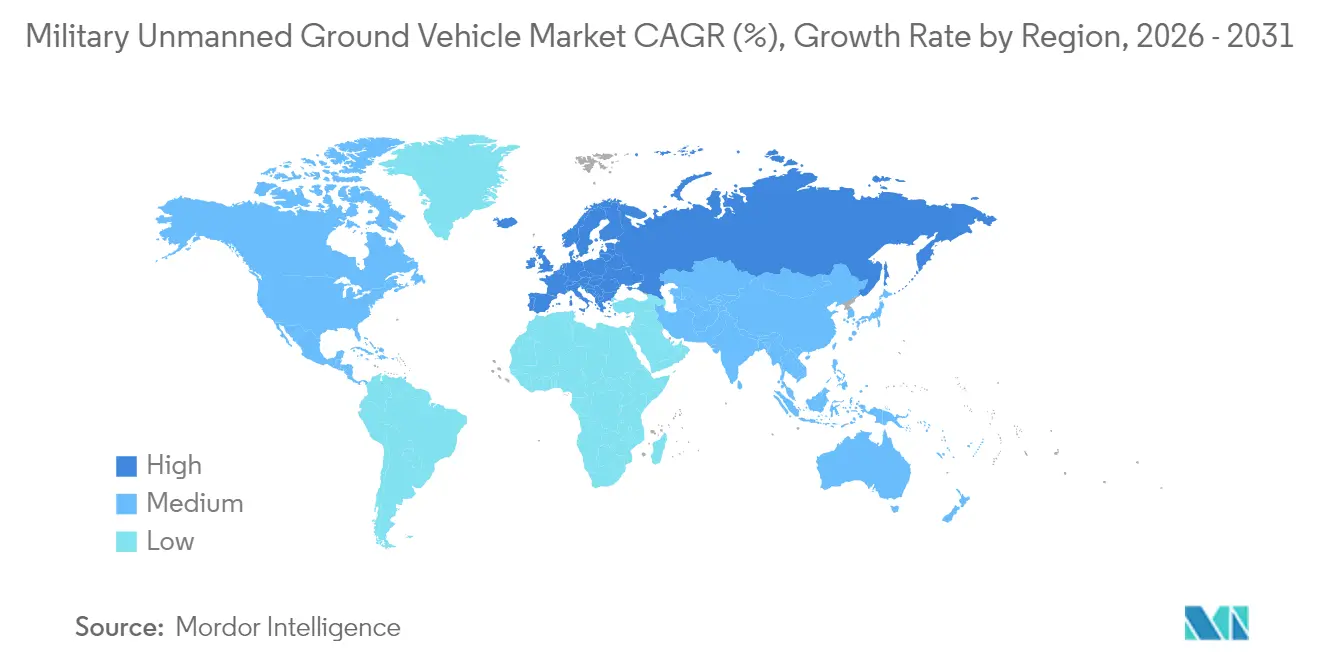
| Fastest Growing Market | Europe |
| Largest Market | North America |
| Market Concentration | Medium |
Major Players *Disclaimer: Major Players sorted in no particular order Image © Mordor Intelligence. Reuse requires attribution under CC BY 4.0. | |
Military Unmanned Ground Vehicle Market Analysis by Mordor Intelligence
The military UGV market size is expected to grow from USD 1.96 billion in 2025 to USD 2.11 billion in 2026 and is forecast to reach USD 3.08 billion by 2031 at 7.82% CAGR over 2026-2031. Strong demand for autonomous platforms that protect soldiers from improvised explosive devices, munitions fragments, and small-arms fire anchors presents revenue opportunities. Rapid advances in artificial intelligence, sensor fusion, and edge computing expand mission profiles from reconnaissance to combat logistics. Heightened geopolitical risk in Eastern Europe and the Indo-Pacific drives urgent procurement cycles, while the growing feasibility of manned–unmanned teaming reshapes tactical doctrine. Competitive intensity remains moderate as prime contractors rely on classified integration skills, yet specialized robotics firms inject innovation through partnerships focused on electronic-warfare (EW)-resilient autonomy.
Key Report Takeaways
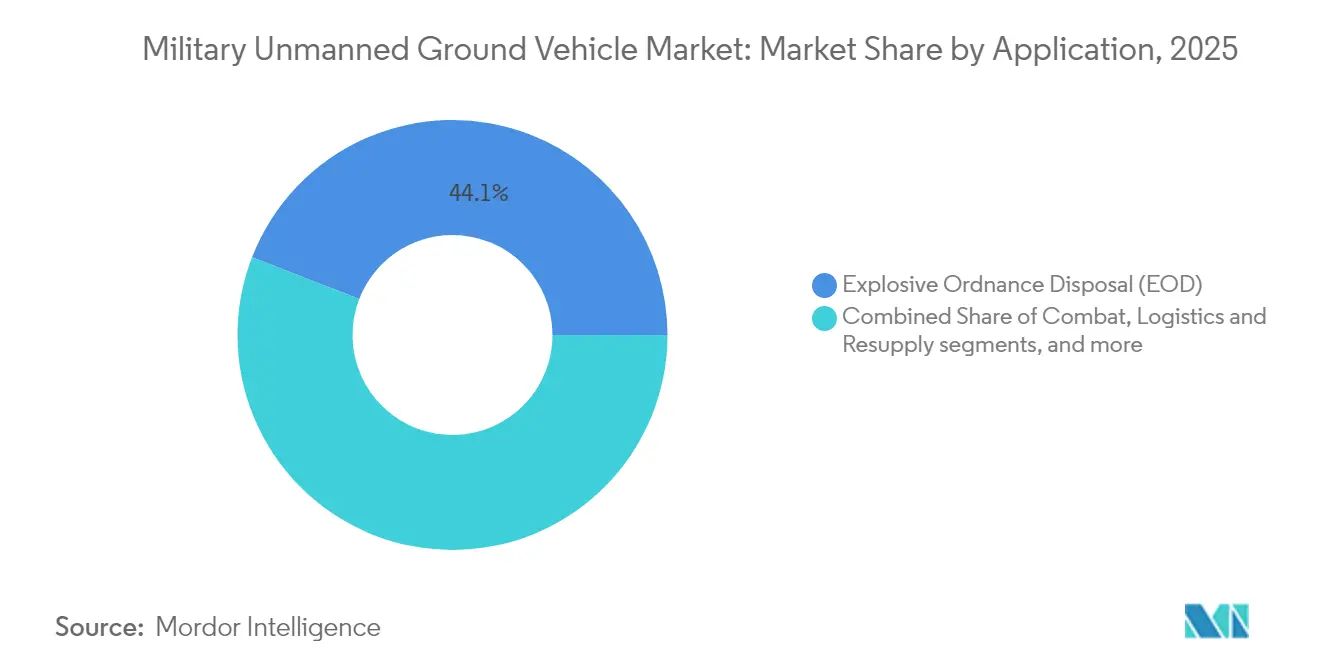
- By application, explosive ordnance disposal (EOD) held 44.12% of the military UGV market share in 2025; intelligence, surveillance, and reconnaissance (ISR) is poised to grow at a 10.05% CAGR through 2031.
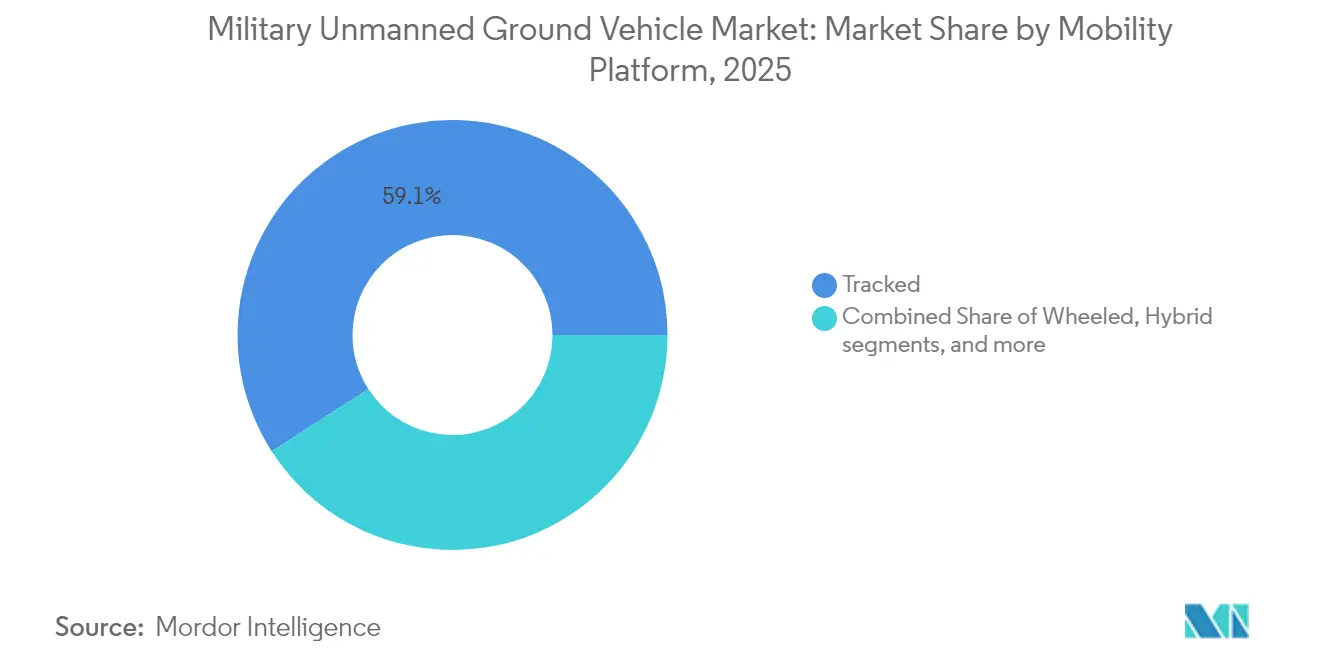
- By mobility platform, tracked systems led with 59.10% share in 2025, while wheeled platforms are forecasted to expand at an 8.21% CAGR to 2031.
- By mode of operation, tele-operated vehicles accounted for 68.10% share in 2025, whereas semi-autonomous platforms will advance at an 8.25% CAGR during the outlook period.
- By weight class, small systems dominated with a 44.00% share in 2025, and medium systems are projected to register a 9.28% CAGR up to 2031.
- By geography, North America captured 38.10% revenue in 2025; Europe is anticipated to record an 8.29% CAGR through 2031
Note: Market size and forecast figures in this report are generated using Mordor Intelligence’s proprietary estimation framework, updated with the latest available data and insights as of 2026.
Global Military Unmanned Ground Vehicle Market Trends and Insights
Drivers Impact Analysis*
| Driver | (~)% Impact on CAGR Forecast | Geographic Relevance | Impact Timeline |
|---|---|---|---|
| Expanding defence budgets among the North Atlantic Treaty Organization (NATO) and Indo-Pacific nations | +1.80% | Global, concentrated in North America, Europe, and Asia-Pacific | Medium term (2-4 years) |
| Soldier-safety focus driving autonomous combat/logistics platforms | +1.50% | Global, particularly US, Israel, European NATO members | Short term (≤ 2 years) |
| AI-enabled sensor-fusion and autonomous navigation breakthroughs | +1.30% | Global, led by US, China, European tech centers | Long term (≥ 4 years) |
| Manned–unmanned teaming doctrine in multi-domain operations | +1.10% | NATO countries, Australia, Japan, South Korea | Medium term (2-4 years) |
| Electronic Warfare (EW)-resilient ground relay nodes demand | +0.90% | Global, priority in contested environments | Short term (≤ 2 years) |
| Climate-disaster engineering missions creating dual-use demand | +0.60% | Global, emphasis on disaster-prone regions | Long term (≥ 4 years) |
| Source: Mordor Intelligence | |||
Expanding defence budgets among NATO and Indo-Pacific nations
Allied commitment to spending at least 2% of GDP on defense funnels unprecedented capital toward autonomous ground platforms. NATO’s Defence Innovation Accelerator directs USD 1.2 billion to cooperative robotics projects that promise economies of scale for sensors, powertrains, and secure communications.[1]Source: NATO Newsroom, “NATO Launches Defence Innovation Accelerator for the North Atlantic,” nato.int Australia allocates USD 180 billion within its force-structure plan to embed unmanned assets across land formations, and Japan raises its robotics appropriation by 40% in fiscal 2024 to fortify island defense. These synchronized budgets shorten production lead times and stabilize supplier tooling, giving established manufacturers predictable volume while inviting new software-centric entrants.
Soldier-Safety Focus Driving Autonomous Combat and Logistics Platforms
Casualty reviews from current conflicts report that 60% of ground vehicle losses occur during supply runs, reinforcing the logic for unmanned resupply convoys that shield personnel from indirect fire.[2]Source: RAND Corporation, “Casualties and Losses in Ground Combat Operations,” rand.orgThe US Army invests USD 1.8 billion in its Robotic Combat Vehicle program for platforms capable of operating in chemical or radiological zones without human presence. Israel demonstrates autonomous border patrol vehicles that reduce troop exposure to hostile fire by 70%, while similar pilot projects expand in the UK and France. The persuasive safety record hastens doctrinal acceptance and accelerates procurement even in budget-constrained services.
AI-Enabled Sensor Fusion and Autonomous Navigation Breakthroughs
Fusion engines that combine LiDAR, thermal, and radar imagery now achieve 95% obstacle recognition accuracy during field trials by the US Joint AI Center.[3]Source: U.S. Department of Defense Joint AI Center, “DoD Adopts Ethical Principles for Artificial Intelligence,” ai.mil European programs funded by the European Defence Fund (EDF) demonstrate 100-kilometer convoy runs without human intervention, proving the reliability of edge computing under electronic warfare stress. Continuous on-board learning reduces bandwidth requirements, allowing vehicles to sustain ISR missions with intermittent communications. These technological milestones unlock wider mission envelopes and lower the cognitive load on operators, broadening the military UGV market across combat arms.
Manned–Unmanned Teaming Doctrine in Multi-Domain Operations
Updated field manuals integrate UGVs as force multipliers that extend human reach in urban canyons, subterranean passages, and chemically contaminated areas. NATO exercises validate standardized messaging protocols that allow crewed tanks to task robotic wingmen for flanking maneuvers. By employing unmanned scouts, infantry units maintain situational awareness without exposing soldiers to small-arms engagement. Asia-Pacific armies adopt similar playbooks that leverage geographic dispersion, reinforcing alliances and building cross-domain resilience.
Restraints Impact Analysis*
| Restraint | (~)% Impact on CAGR Forecast | Geographic Relevance | Impact Timeline |
|---|---|---|---|
| Cyber-/jamming vulnerability of Command and Control (C2) links | -1.2% | Global, acute in near-peer contested environments | Short term (≤ 2 years) |
| High acquisition and life-cycle cost vs manned vehicles | -0.9% | Global, particularly budget-constrained nations | Medium term (2-4 years) |
| Arms-control ambiguity over lethal autonomy | -0.7% | Global, emphasis on NATO and allied nations | Long term (≥ 4 years) |
| Lack of cross-allied interoperability standards | -0.5% | NATO and allied nations, multinational operations | Medium term (2-4 years) |
| Source: Mordor Intelligence | |||
Cyber-/jamming vulnerability of Command and Control (C2) links
Operational reports from Ukraine reveal that sophisticated jamming can disrupt UGV control within minutes after deployment, forcing premature mission aborts. Encryption upgrades and frequency-hopping solutions mitigate part of the risk, yet adversaries adapt quickly. Tactical mesh networks offer redundancy, though they raise complexity and cost. Persistent vulnerability erodes operator confidence and compels continued oversight, slowing the shift toward full autonomy.
High acquisition and life-cycle cost vs manned vehicles
Government audits show that unmanned ground platforms can cost 40-60% more than equivalent manned vehicles once advanced sensors, computing modules and software support contracts are factored in. Rapid technology refresh cycles compel hardware replacement within seven years, compared with two-decade life spans for traditional armored fleets. Smaller nations lack the order volume to negotiate favorable pricing, leading to uneven adoption across alliance partners.
*Our forecasts treat driver/restraint impacts as directional, not additive. The impact forecasts reflect baseline growth, mix effects, and variable interactions.
Segment Analysis
By Application: EOD Leads While ISR Accelerates
Explosive ordnance disposal (EOD) platforms generated 44.12% revenue in 2025 as militaries prioritized remote neutralization of improvised explosives during asymmetric engagements. This dominance persists because small tracked robots consistently navigate rubble and deliver precise disruptor charges that save technicians’ lives in trench networks and urban ruins. Meanwhile, the intelligence segment expands fastest at a 10.05% CAGR as commanders request persistent video and electronic surveillance that a single soldier cannot sustain. ISR robots equipped with mast-mounted optics and low-probability-of-intercept radios provide continuous feeds that fuse into broader command networks, reducing surprise contacts.
Demand for combat robots accompanying infantry grows as manned formations test tactics such as robotic point men that trigger ambushes before troops enter chokepoints. Logistics and resupply variants also gain traction because autonomous trailers and pallet movers eliminate vulnerable driver positions during long convoys. Engineering and route-clearance models benefit from ruggedized blades and roller kits that protect sappers from suspected minefields. Training and decoy applications, though smaller, enable realistic threat emulation that hones soldier readiness and validates EW countermeasures.


By Mode of Operation: Human Control Prevails Yet Autonomy Grows
Tele-operated vehicles held 68.10% market presence in 2025 because policymakers insist that lethal decisions remain under direct human judgment. Real-time video, haptic feedback, and low-latency satellite relays maintain commander confidence during bomb disposal or sentry roles. Semi-autonomous suites, however, record an 8.25% CAGR as algorithms handle waypoint navigation and obstacle avoidance, freeing operators to focus on mission objectives.
When communication is denied, the military UGV market welcomes the gradual integration of fully autonomous behaviors such as convoy following and casualty evacuation. Developers embed ethical guardrails consistent with Department of Defense (DoD) AI principles to mitigate policy resistance. Each incremental software upgrade lifts crew workload and lowers exposure to sniper fire, nurturing enduring adoption momentum.
By Mobility Platform: Tracked Strength Balances Wheeled Momentum
Tracked chassis captured 59.10% of shipments in 2025 because they traverse mud, rubble, and soft sand with a dependable grip. Heavy payload ratings let forces mount counter-IED arms, light cannons, and bridge-laying kits without compromising stability, which preserves the appeal of tracked options despite higher maintenance. The military UGV market size for tracked platforms is forecasted to widen steadily through 2031 as high-threat theaters demand survivability.
Wheeled robots, advancing at 8.21% CAGR, capitalize on fuel efficiency and rapid road speeds when moving supplies between forward operating bases. Hybrid drivetrains that switch between wheel and track modules surface, but complexity tempers adoption for now. Legged concepts progress within research units for cave mapping and stair climbing, though limited payload capacity confines near-term roles. Platform selection increasingly aligns with mission tempo rather than blanket fleet standardization.
By Weight Class: Small Platforms Dominate but Medium Platforms Surge
Robots between 25 kg and 200 kg accounted for 44.00% shipments in 2025 because unit leaders can hand-carry them from armored personnel carriers directly into alleys or culverts. Micro robots under 25 kg excel in discreet reconnaissance of subterranean passages where tunnels constrain heavier systems.
Medium robots in the 200 to 1,000 kg band grow fastest at 9.28% CAGR as armies demand longer endurance, heavier manipulator arms, and modular sensor bays. The military UGV market size for medium platforms is set to rise, propelled by programs that pair them with crewed vehicles in combined arms formations. Heavy robots exceeding 1,000 kg find specialized niches in breaching fortifications and transporting pallets, but face airlift restrictions that slow fleetwide proliferation.
Geography Analysis
North America generated 38.10% of 2025 revenue because the Pentagon underwrites multi-service robotics portfolios and primes such as General Dynamics and Textron maintain mature production lines. Operational use in Afghanistan, Iraq, and rotational deployments in Europe yields battlefield data that feeds iterative upgrades, consolidating regional leadership.
Europe is the fastest-expanding theater with an 8.29% CAGR through 2031 as governments react to near-peer deterrence requirements. The European Defence Fund has committed EUR 8 billion (USD 9.32 billion) to autonomous projects, stimulating consortia that integrate German automotive robotics and French sensor payloads into interoperable fleets. The UK’s Future Soldier program dedicates GBP 6.6 billion (USD 8.85 billion) to next-generation combat systems, including robotic wingmen, anchoring long-term demand.
Asia-Pacific nations accelerate procurement under regional security tensions. China leverages military-civil fusion to convert commercial robotics breakthroughs into armored reconnaissance drones that patrol border outposts. India’s Make in India policy funds indigenous crawler designs aimed at mountainous terrain, while Australia applies AUKUS partnerships to fast-track sovereign production of unmanned logistics carriers. Collectively, these dynamics elevate regional share in the military UGV market and diversify supply chains away from single-region concentration.

Regulatory Landscape
Military UGV procurement is shaped by export-control and autonomy-governance rules, alongside defense acquisition pathways that increasingly emphasize accountable human control. In the United States, congressional work in 2026 advanced draft measures (including S. 4707 and S. 4656) that focus on human accountability and oversight for military AI and autonomous weapon systems, reinforcing requirements such as operator judgment, manual intervention, and law-of-armed-conflict compliance in system design and employment.
Institutional governance also shifted in 2026, as the US Department of Defense created a centralized integrator construct for unmanned and autonomous systems (including autonomous ground vehicles). This affects how programs align requirements, safety policies, and interoperability. Across allied operations, NATO-driven standardization and experimentation (including NATO STO activity focused on UGV use in complex environments and ongoing work on interoperable architectures and protocols) helps keep interoperability and C2 integration as practical compliance anchors for multinational fielding.
Value Chain Analysis
The military UGV value chain starts with specialized subsystems (mobility components, batteries and power management, hardened radios, cameras/thermal/LiDAR, compute modules, and manipulators). Platform OEM integration then adapts these into tracked or wheeled chassis, while software integration covers autonomy, sensor fusion, and electronic-warfare resilience. System-of-systems integration, mission payload tailoring (EOD tools, breaching kits, ISR masts, logistics modules), and certification or testing under contested communications conditions are typically the highest-value steps, with primes and defense-focused robotics firms sharing responsibilities based on program security and integration depth.
Downstream, procurement flows through defense ministries and service-level programs, with accelerated pathways and operational pull-through expanding the role of software-first suppliers and modular architectures. Recent contracting and teaming illustrate this structure: AeroVironment (Telerob) supplying tele-operated EOD platforms to Germany (41 systems), AM General partnering with Carnegie Robotics and Textron Systems for a modular UGV concept for US Army modernization, and USMC production contracting for autonomous ground vehicles under programs tied to air defense. Sustainment, spares, and software updates (including autonomy refresh and cyber hardening) add a significant recurring layer, while allied interoperability work (NATO technical efforts on cooperating unmanned ground systems) influences interface and data-link requirements across the chain.
Competitive Landscape
The market remains moderately consolidated because high reliability, cyber-hardening, and export-control compliance reward incumbents with security clearances. General Dynamics Land Systems, Rheinmetall, and BAE Systems field integrated vehicle families that align with established armored fleets, reducing crew retraining burdens. Contract wins such as the USD 1.2 billion Robotic Combat Vehicle-Light deal exemplify the scale advantages that incumbents wield.
Yet technological velocity creates openings for more miniature robotics and AI specialists. Firms like Milrem Robotics supply open-architecture chassis that prime customization with national subsystems, while cloud-native developers contribute perception stacks that mature faster than traditional waterfall models. Partnerships proliferate, blending defense-grade encryption and safety certification with agile software release cycles.
Competitive strategies emphasize electronic-warfare resilience, modular mission payloads, and dual-use humanitarian applications that justify peacetime budgets. Companies positioning early in mesh networking and swarm orchestration accumulate differentiators that complicate commoditization. Overall rivalry strengthens product quality without triggering price wars, sustaining profitable margins across the military UGV industry.
Military Unmanned Ground Vehicle Industry Leaders
Rheinmetall AG
L3Harris Technologies, Inc.
Israel Aerospace Industries Ltd.
Teledyne FLIR LLC (Teledyne Technologies Incorporated)
QinetiQ Group plc
- *Disclaimer: Major Players sorted in no particular order

Market Opportunities and Future Outlook
Near-term whitespace is clearest where autonomy can be fielded inside constrained, rules-based missions that reduce risk to personnel and simplify verification. This includes minefield breaching, EOD, convoy and base logistics, and air-defense support. In 2026, the US Marine Corps production contract with Overland AI (about USD 20 million) for autonomous ground vehicles integrated into the Marine Air Defense Integrated System (MADIS) shows how autonomy software and vehicle platforms can move beyond trials into operational capability. This creates openings for perception, navigation, and EW-resilient C2 suppliers aligned with programs of record.
A second opportunity cluster centers on fast-track and prototype-led acquisition that brings non-traditional vendors into defense robotics. The US Army selecting Caterpillar, Forterra, IDV USA, and Overland AI in July 2026 to build autonomous minefield-breaching prototypes underscores demand for modular, mission-tailored ground autonomy beyond classic EOD robots. In Europe, formalization of uncrewed ground vehicle funding and initial operational fleets (for example, British Army contracting for an operational ground-robot fleet in 2026) supports demand for interoperable architectures, training and simulation packages, and lifecycle support models that lower total cost versus bespoke platforms.
Recent Industry Developments
- July 2026: Rheinmetall and DOK-ING formed a joint venture in Croatia (Rheinmetall Unmanned Vehicles d.o.o.) focused on developing next-generation unmanned ground platforms. The move expands Rheinmetall’s European industrial footprint for ground robotics and supports faster localization of development and production for allied customers.
- June 2025: Rheinmetall reported deliveries of Hermelin unmanned ground vehicles to Ukraine. The delivery highlights accelerated battlefield-driven demand for practical, field-ready UGVs and raises the importance of ruggedization, maintainability, and rapid sustainment in contested environments.
- September 2024: Kodiak introduced the RIPSAW M3 tracked vehicle for reconnaissance and tactical roles, positioned for robotic combat vehicle trials. The launch reinforced momentum toward medium-class tracked platforms that can host modular payloads and autonomy kits for multi-mission use.


Research Methodology Framework and Report Scope
Market Definition and Coverage
For this methodology, the military unmanned ground vehicle market covers ground-based robotic platforms procured or funded for defense missions, including the vehicle, mission payload integration, and onboard control and autonomy hardware counted at the system level.
Scope exclusions: We exclude commercial and law-enforcement UGVs, warehouse AGVs, and legacy bomb-disposal robots that are counted only as standalone tools rather than mission-capable ground platforms.
Segmentation Overview
- By Application
- Combat
- Intelligence, Surveillance, and Reconnaissance (ISR)
- Explosive Ordnance Disposal (EOD)
- Logistics and Resupply
- Engineering and Route Clearance
- Training and Decoy
- By Mobility Platform
- Wheeled
- Tracked
- Legged
- Hybrid
- By Mode of Operation
- Tele-operated
- Autonomous
- Semi-Autonomous
- Fully Autonomous
- By Weight Class
- Micro (Less than 25 kg)
- Small (25 to 200 kg)
- Medium (200 to 1000 kg)
- Heavy (More than 1000 kg)
- By Geography
- North America
- United States
- Canada
- Europe
- United Kingdom
- France
- Germany
- Italy
- Russia
- Rest of Europe
- Asia-Pacific
- China
- India
- Japan
- South Korea
- Australia
- Rest of Asia-Pacific
- South America
- Brazil
- Rest of South America
- Middle East and Africa
- Middle East
- Israel
- Saudi Arabia
- United Arab Emirates
- Rest of Middle East
- Africa
- South Africa
- Rest of Africa
- Middle East
- North America
Data Sources, Market Sizing, and Validation
Desk Research
Desk research starts by anchoring the defense demand environment and procurement signals that typically precede UGV deliveries. Public and official sources, such as SIPRI military expenditure series, NATO defense expenditure releases, US DoD budget justification books, and congressional or parliamentary budget hearings, help us map where funding is actually flowing.
We also referenced sources such as national procurement portals and tender bulletins, contract award notices, and export control and trade statistics from agencies such as the US International Trade Commission and UN Comtrade (where applicable to defense electronics categories). Context was supplemented using company annual reports, 10-K filings, and investor presentations, along with defense ministry releases and open doctrine publications that discuss EOD, ISR, and logistics robotics use cases. When program visibility was limited, we used a paid subscription for company financials and a global contracts and tenders database selectively to clarify award pipelines and timing. The sources listed here are not exhaustive, and many other public materials were also used for data collection, validation, and clarification.
Primary Interviews and Surveys
Primary work was used to stress-test assumptions behind what counts as a military UGV sale and when it should be recognized, especially when trials, options, and upgrades sit alongside new vehicle buys. We engaged with defense procurement and program stakeholders, system integrators, component suppliers, and domain experts across APAC, EMEA, and the Americas, and their feedback was used to reconcile pricing, delivery timing, and adoption pace.
Distribution of primary research fieldwork respondents
| Company type | Respondent position | Region |
|---|---|---|
| Top tier: 33% | CXOs: 13% | APAC: 39% |
| Mid tier: 52% | Functional/Unit leaders: 30% | EMEA: 36% |
| Smaller Players: 15% | Managers: 57% | Americas: 25% |
Market-Sizing & Forecasting
Sizing is built using top-down and bottom-up logic, where defense procurement and budget signals are first translated into a feasible military UGV demand pool, and then validated using selective roll-ups. On the top-down side, program funding lines, contract awards, and delivery schedules are used to reconstruct annual spending that can realistically land as UGV revenue in a given year.
To keep the model tied to how these platforms are bought, we track variables such as the count of active UGV programs by mission (EOD, ISR, logistics), procurement phase (trial versus production), expected unit deliveries, and system-level ASP bands by weight class and payload complexity. Additional inputs, such as the share of upgrades versus new vehicle buys, regional modernization priorities, and defense spending outlook by country group, are used to shape the demand path. We then use a bottom-up approximation as a check, drawing on a sampled set of supplier revenues, known program quantities, and expected ASPs to test whether totals drift too high or too low. Adjustments are made to close any gaps identified in that cross-check.
Forecasts are developed using scenario analysis supported by expert views on conversion rates from trials to scaled procurement, along with expected pricing progression as autonomy content increases and volumes stabilize. Where bottom-up evidence is thin in smaller geographies, we apply a conservative penetration assumption tied to documented programs, and we only step it up when primary feedback supports adoption and funding continuity.
Data Validation & Update Cycle
Outputs are validated by cross-checking totals against independent signals, such as announced contract values, known delivery batches, and defense budget execution patterns, and then any sharp year-to-year moves are investigated. If a program-level change materially shifts volumes or timing, the assumptions are re-checked and, where needed, an expert is re-contacted to confirm what moved and why.
Before sign-off, the model and assumptions go through multi-step internal review so that pricing, volumes, and currency handling match the defined scope. Reports refresh annually, with interim updates when major contracts, conflicts, or procurement policy changes create a measurable step change. Right before delivery, we run a final pass to capture recent awards and public budget updates, so clients receive the latest updated view.
Mordor Intelligence's Military Unmanned Ground Vehicle Market Sizing Compared With Other Published Estimates
Published numbers for military UGVs can look far apart because the scope line is not drawn the same way, and because program timing is tricky when trials, options, and follow-on lots are mixed together. Differences also come from how studies treat upgrade kits versus new platforms, and whether they normalize currency and inflation in a consistent way.
The biggest gap comes from counting adjacent categories, where Mordor Intelligence counts mission-capable military UGV platforms and system-level payload integration, but it leaves out commercial UGVs, warehouse AGVs, and legacy standalone bomb-disposal tools. Another driver is the assumed conversion from prototype trials to production orders, which can swing the near-term market if it is set aggressively without contract checks. Lastly, some estimates apply one ASP curve across all missions, even though EOD units, ISR carriers, and logistics movers tend to have different payload costs and refresh cycles.
Benchmark comparison
| Source | Market Size | Gaps in Research Methodology |
|---|---|---|
| Mordor Intelligence | USD 1.96 B (2025) | |
| Global Research Publisher A | USD 3.19 B (2025) | Uses a wider definition that appears to blend UGVs with adjacent military robotics categories, and it assumes faster scaling from trials to fleet orders, which lifts the 2025 value. |
| Industry Portal B | USD 5.80 B (2023) | Shows inconsistent base-year statements and likely mixes multiple unmanned and robotic categories together, which reduces traceability to program-level volumes and contract timing. |
Across the three figures, the spread is mainly explained by what is included as a UGV market item and how quickly trial programs are converted into counted deliveries. When inclusion rules are tied to mission-capable platforms and validated against award and delivery signals, the resulting size is more repeatable year to year.


Key Questions Answered in the Report
How large is the military unmanned ground vehicle market in 2026?
The military UGV market is valued at USD 2.11 billion in 2026 and is forecasted to reach USD 3.08 billion by 2031.
Which application currently generates the highest revenue?
EOD platforms lead with 44.12% of 2025 revenue.
What is the fastest-growing mobility platform category?
Wheeled systems are projected to grow at an 8.21% CAGR through 2031.
Why are semi-autonomous modes gaining popularity?
Advances in AI reduce operator workload and allow vehicles to navigate and avoid obstacles without constant remote control, supporting an 8.25% CAGR for semi-autonomous systems.
Which region shows the fastest future growth?
Europe is expected to register an 8.29% CAGR to 2031 as defense budgets rise and European Defence Fund projects mature.
What is the primary restraint on market expansion?
Vulnerability to cyber and jamming attacks limits operational confidence and slows the transition from tele-operated to fully autonomous missions.
Page last updated on:


