Unmanned Combat Aerial Vehicle Market Size and Share
Market Overview
| Study Period | 2020 - 2031 |
|---|---|
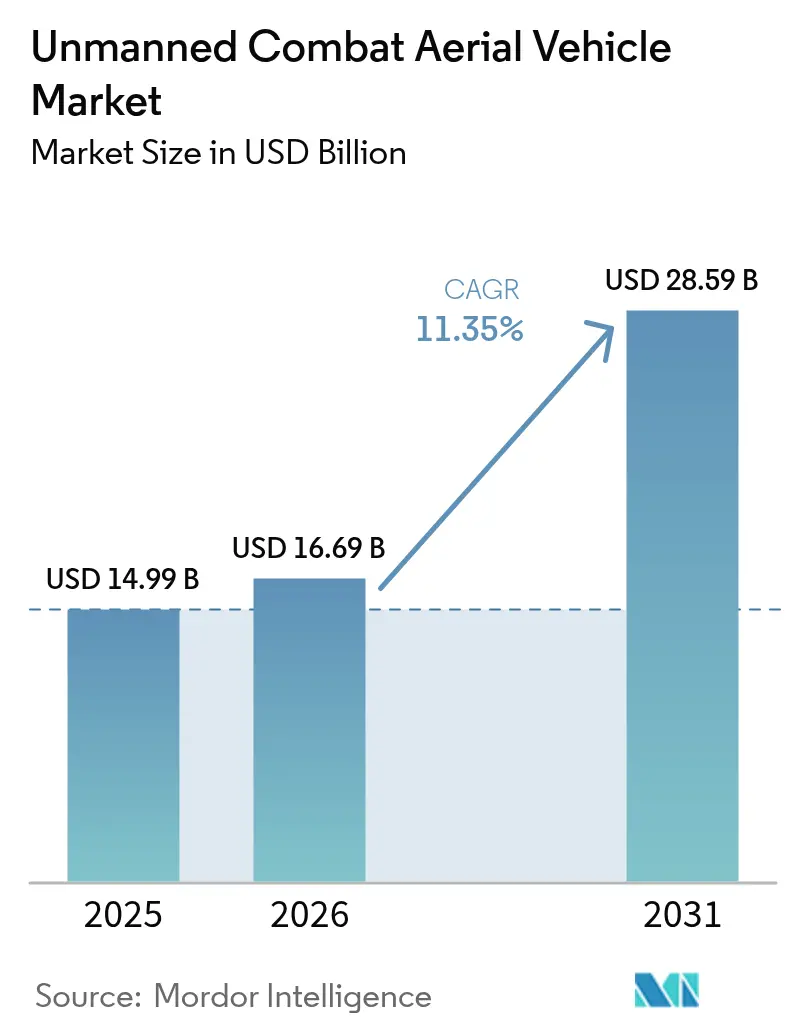
| Market Size (2026) | USD 16.69 Billion |
| Market Size (2031) | USD 28.59 Billion |
| Growth Rate (2026 - 2031) | 11.35% CAGR |
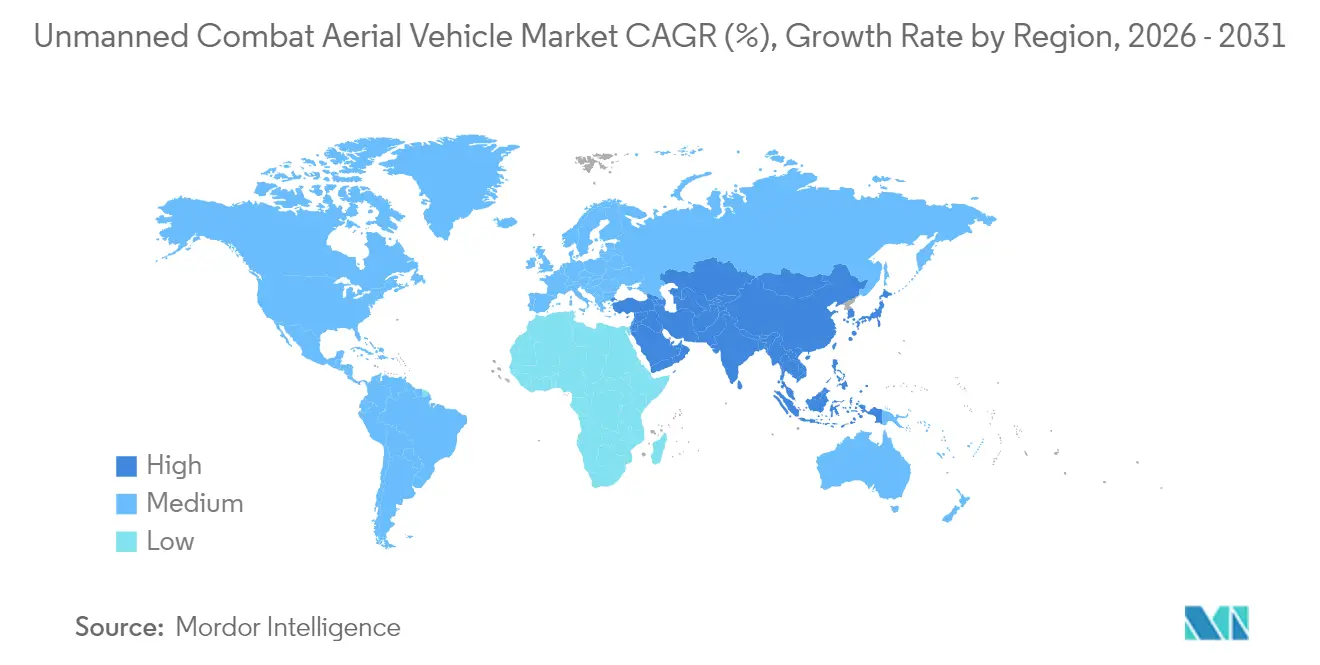
| Fastest Growing Market | Asia Pacific |
| Largest Market | North America |
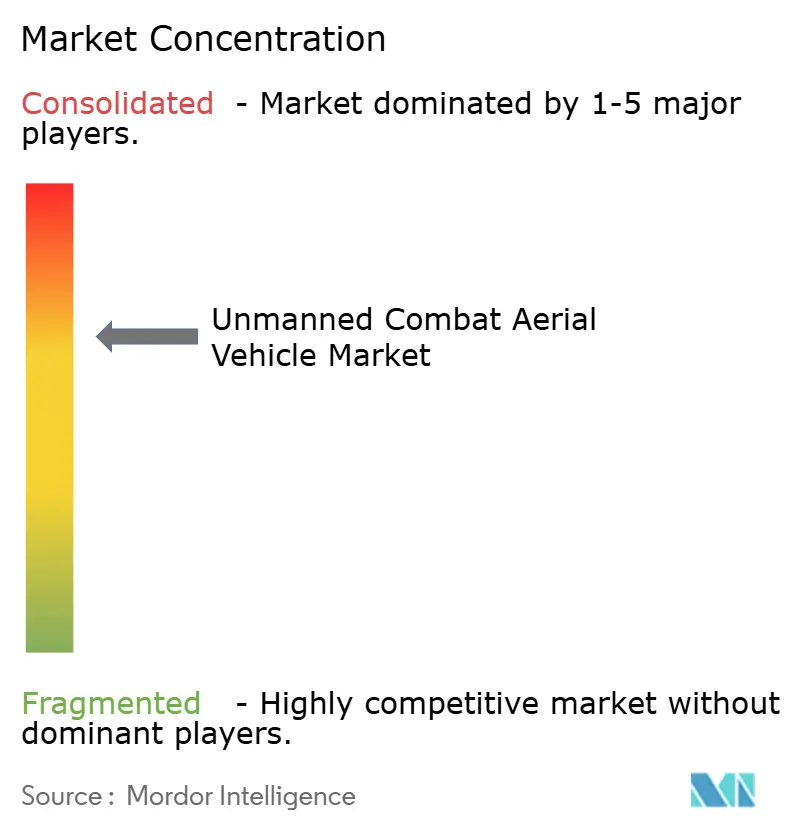
| Market Concentration | Medium |
Major Players *Disclaimer: Major Players sorted in no particular order Image © Mordor Intelligence. Reuse requires attribution under CC BY 4.0. | |
Unmanned Combat Aerial Vehicle Market Analysis by Mordor Intelligence
The unmanned combat aerial vehicle (UCAV) market size in 2026 is estimated at USD 16.69 billion, growing from 2025 value of USD 14.99 billion with 2031 projections showing USD 28.59 billion, growing at 11.35% CAGR over 2026-2031. Demand is accelerating as defense ministries scale budgets, embed autonomous concepts in doctrine, and move AI-enabled teaming projects from prototypes to purchase orders. North America’s lead flows from large US programs such as the 1,000-unit Collaborative Combat Aircraft plan. At the same time, Asia-Pacific’s double-digit expansion mirrors rapid force modernization in China, India, and South Korea. Fixed-wing designs, turboprop propulsion, and 6–24 hour endurance profiles continue to anchor fleet decisions because they balance range, payload, and lifecycle cost. In parallel, miniaturized precision munitions, low-latency satellite links, and self-learning autonomy push performance boundaries, broadening use cases and sharpening the competitive tone across the UCAV market.
Key Report Takeaways
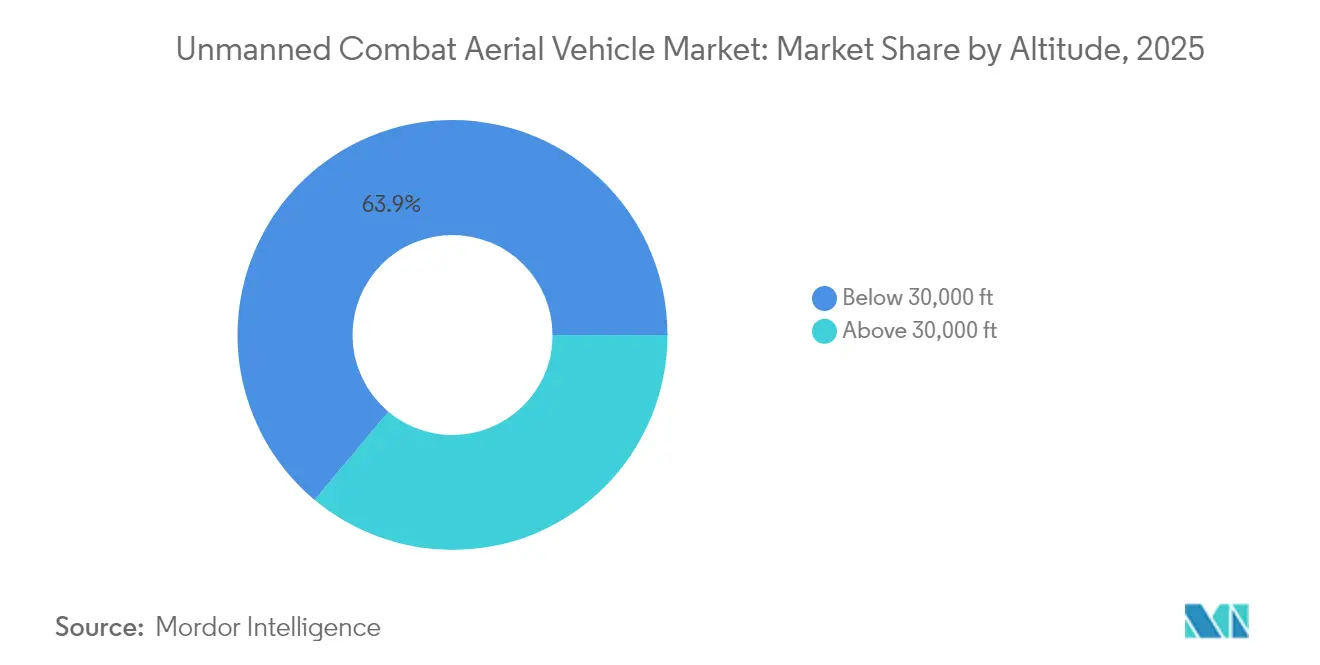
- By altitude of operation, below-30,000 ft platforms held 63.92% of the UCAV market share in 2025, while above-30,000 ft craft is projected to grow at an 11.12% CAGR to 2031.
- By range, the 200-1,000 km band accounted for 53.10% of the UCAV market size in 2025; systems with more than 1,000 km reach are projected to expand at a 12.34% CAGR through 2031.
- By endurance, the 6- to 24-hour airframes captured a 48.90% share of the UCAV market in 2025, whereas the over-24-hour class is forecast to grow at an 11.05% CAGR through 2031.
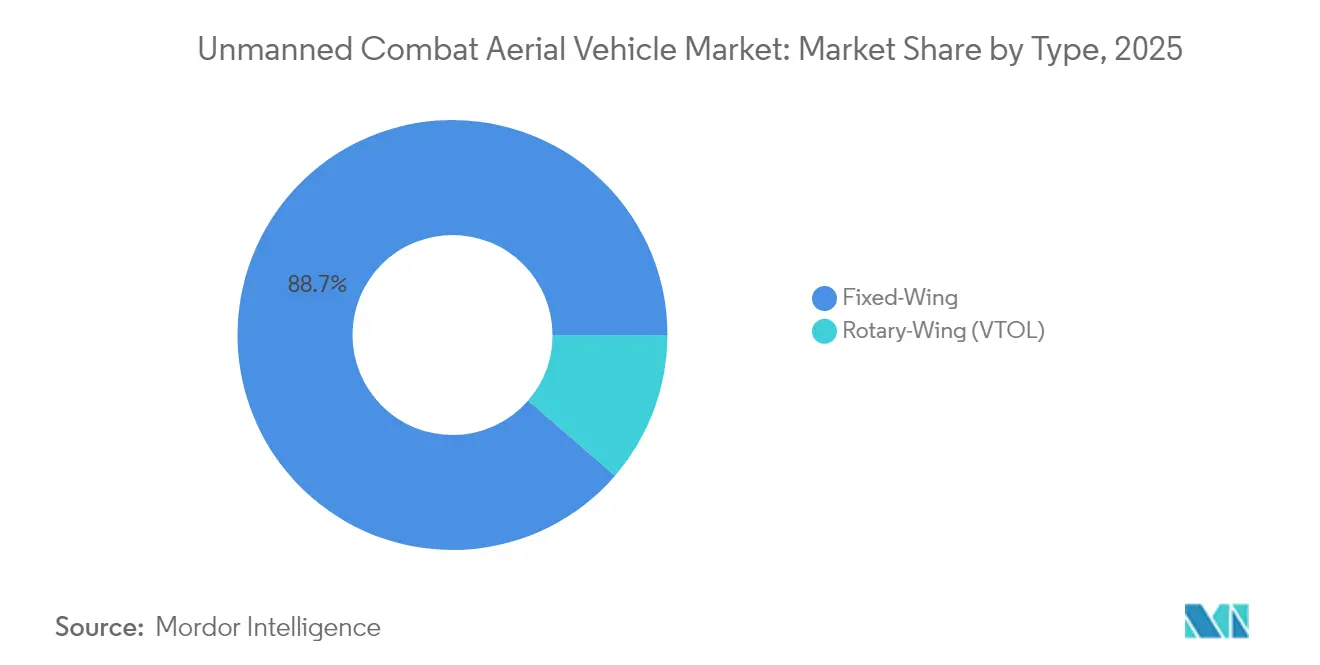
- By type, fixed-wing units dominated with an 88.65% share in 2025; rotary-wing variants are forecast to witness the fastest growth at a 14.02% CAGR through 2031.
- By engine type, turboprop-powered vehicles led with a 61.05% share in 2025, and hybrid-electric or hydrogen solutions are projected to grow at a 15.72% CAGR through 2031.
- By end user, air forces accounted for 72.55% of revenue in 2025; naval and marine aviation is forecast to grow at a 12.78% CAGR through 2031.
- By geography, North America held 42.10% of the UCAV market share in 2025, while Asia-Pacific is forecast to grow at a 12.03% CAGR through 2031.
Note: Market size and forecast figures in this report are generated using Mordor Intelligence’s proprietary estimation framework, updated with the latest available data and insights as of 2026.
Global Unmanned Combat Aerial Vehicle Market Trends and Insights
Drivers Impact Analysis*
| Driver | (~) % Impact on CAGR Forecast | Geographic Relevance | Impact Timeline |
|---|---|---|---|
| Institutionalization of manned-unmanned teaming (MUM-T) doctrines by Tier-1 air forces | + 3.1% | North America, Europe, Japan, South Korea, Australia | Medium term (2-4 years) |
| Integration of Artificial Intelligence–enabled swarm and Loyal-Wingman capabilities | + 2.8% | North America, China, advanced European forces | Medium term (2-4 years) |
| Global rollout of high-throughput Ka/Ku/LEO SATCOM for Beyond-Line-of-Sight (BLOS) control | + 2.5% | Regions with robust satellite infrastructure | Short term (≤ 2 years) |
| Miniaturization of precision-guided munitions for Class-III UCAVs | + 2.3% | North America, Israel, allied partners | Medium term (2-4 years) |
| Increasing defense budgets and military modernization programs globally | + 2.1% | Global, with particular emphasis in Asia-Pacific, North America, and Middle East | Long term (≥ 4 years) |
| Rising geopolitical tensions and regional conflicts driving demand for autonomous systems | + 1.9% | Global, with concentration in Indo-Pacific, Eastern Europe, and Middle East | Short term (≤ 2 years) |
| Source: Mordor Intelligence | |||
Institutionalization of Manned-Unmanned Teaming Doctrines
The operational shift toward formal manned-unmanned teaming (MUM-T) is no longer conceptual; it is being written into acquisition contracts, training syllabi, and even the tail-number nomenclature of front-line squadrons. The US has set the initial pace through its Collaborative Combat Aircraft (CCA) program, awarding parallel April 2024 contracts to Anduril and General Atomics that call for more than 1,000 autonomous wingmen by 2028. The newly assigned designations-YFQ-42A “Gambit” and YFQ-44A “Fury”-place these drones inside the traditional “F-series” taxonomy, signaling that they will occupy roles once reserved only for crewed fighters.
Across the Atlantic, the UK validated its approach in April 2024 when QinetiQ, the Defense Science and Technology Laboratory, and the Royal Navy flew a jet trainer in formation with an autonomous Banshee Jet 80 at 350 knots. Lessons from that sortie now feed directly into the Autonomous Collaborative Platform (ACP) concept, which stresses goal-based autonomy and electronic-attack flexibility. Similar doctrinal pivots are underway on the European continent through the Franco-German Spanish Future Combat Air System (FCAS) and in the Indo-Pacific, where Australia’s MQ-28 Ghost Bat is evolving from demonstrator to operational asset. Collectively, these programs confirm that MUM-T has become a core element of Tier-1 air-power planning.
Integration of AI-Enabled Swarm Capabilities
Demonstrations in early 2025 showcased UCAV swarms autonomously coordinating reconnaissance, electronic attack, and kinetic strike roles, illustrating how distributed algorithms can generate combat mass without increasing proportional costs. Saab’s AUKUS Project Convergence trial, which used BlueBear’s open architecture mission system to “hot swap” algorithms in flight, implicitly revealed that procurement agencies may prioritize software reusability over bespoke airframes. The US Air Force’s USD 100 million award to Firestorm Labs for Tempest 50 swarm drones confirms institutional confidence that algorithmic behaviors can meet stringent rules of engagement. The associated inference is that future export tenders may weigh software-update cadence more heavily than initial airframe specifications, bringing consumer electronics to refresh logic into defense procurement.
Global Rollout of High-Throughput SATCOM
High-throughput satellite constellations now underpin reliable beyond-line-of-sight (BLOS) control across trans-theatre distances, enabling unmanned assets to launch from remote bases yet remain under positive control for extended missions. General Atomics reported in November 2024 that its MQ-20 Avenger executed commanded-autonomy maneuvers over a naval control station via parallel satellite links, one channel for flight commands, another for sensor data, demonstrating resilience should an adversary jam either path. This dual-pipe architecture implicitly alters concept-of-operations planning by letting operators relocate ground control stations outside missile threat rings without sacrificing situational awareness.
Miniaturization of Precision-Guided Munitions
The successful qualification of six-pound Northrop Grumman Hatchet glide weapons for Group 2-5 drones underscores how lethality is decoupling from airframe size, eroding the historical linkage between aircraft payload class and strategic relevance. By enabling light UCAVs to neutralize point targets with meter-level accuracy, militaries can adopt a volume-based rather than platform-based approach to strike planning, enhancing flexibility during surge operations. This trend also places a premium on modular store management systems that can accommodate legacy and novel small-diameter munitions, thereby extending the service life of existing drone inventories.
A downstream effect is that supply-chain planners must re-evaluate storage and transport footprints because the same magazine space can now hold more effectors, subtly influencing logistics budgeting. Growing adoption of additive manufacturing for mission-specific warheads suggests that ordnance depots might evolve into hybrid production-storage nodes, blending manufacturing and maintenance functions.
Restraints Impact Analysis*
| Restraint | (~) % Impact on CAGR Forecast | Geographic Relevance | Impact Timeline |
|---|---|---|---|
| Cyber-hardening challenges for Beyond-Line-of-Sight missions | -1.8% | Global contested electromagnetic zones | Medium term (2-4 years) |
| MTCR and Wassenaar Regime export restrictions on Category-I UCAVs | -1.5% | Worldwide, heavier burden on emerging suppliers | Long term (≥ 4 years) |
| Dependence on limited-volume aero-turbine supply chain for high-thrust small engines | -1.2% | Global, with concentration in countries with advanced aerospace manufacturing | Medium term (2-4 years) |
| Civilian air-traffic integration hurdles in Europe and the Caribbean FIRs | -0.9% | Europe, Caribbean, and regions with congested airspace | Short term (≤ 2 years) |
| Source: Mordor Intelligence | |||
Cyber-hardening Challenges for Beyond-Line-of-Sight Missions
As per the contracting notice issued by DARPA in March 2025, it launched the Security and Privacy Assurance for Embedded Reasoning (SABER) program in March 2025 to expose data-poisoning and adversarial-input vulnerabilities in autonomous control loops, confirming that cyber validity is now a prerequisite for operational release. The initiative highlights a core tension: every additional sensor and communications channel widens the attack surface even as mission designers crave richer data. Consequently, primes are spending more on zero-trust architecture and real-time anomaly detection investments that heighten non-recurring engineering costs but strengthen competitiveness when export customers demand verified cyber assurance.
MTCR and Wassenaar Regime Export Restrictions
Category I payload-range thresholds under the Missile Technology Control Regime pose an immediate ceiling on market access for vendors targeting non-allied customers, effectively shaping the competitive landscape, favoring non-signatory exporters. The bifurcated environment allows Chinese suppliers to expand their share. In contrast, Western primes face licensing denials, yet it also prompts creative design strategies such as modular fuel tanks or interchangeable wings to downgrade range on export variants.
As a result, companies that master variable-geometry or power-limiting solutions can straddle both sides of the regulatory divide without duplicating production lines, an efficiency likely to compress delivery timelines. Policymakers are consequently reconciling non-proliferation goals with industrial-based vitality, leading to incremental loosening proposals relying on end-use monitoring rather than blanket denial. This regulatory elasticity could unlock pent-up demand among second-tier militaries, suggesting a latent upwards inflection point for the overall UCAV market share once policy revisions crystallize.
*Our forecasts treat driver/restraint impacts as directional, not additive. The impact forecasts reflect baseline growth, mix effects, and variable interactions.
Segment Analysis
By Altitude of Operation: Tactical dominance below 30,000 ft, strategic shift above
Platforms cruising under 30,000 ft generated 63.92% revenue in 2025 because they fill ISR and close-air-support roles at sustainable fuel burn rates. Affordable airframes such as Bayraktar TB2 and MQ-9 variants offer 27-hour endurance yet remain agile enough for dynamic retasking. However, high-altitude designs above 30,000 ft post the fastest 11.12% CAGR as nations seek surveillance persistence over anti-access zones.
Stealth shaping and turbojet propulsion let these aircraft loiter above most surface-to-air coverage, adding resilience in peer conflicts. This dual-track demand keeps manufacturers investing in pressurized fuselages and high-aspect wings to elevate ceilings without sacrificing payload. The UCAV market size for high-altitude craft could double by 2030, supported by satellite-enabled command loops.


By Range: Medium-range workhorses, long-range penetrators accelerate
UCAVs capable of 200-1,000 km dominate with a 53.10% share, supporting cross-border missions and maritime patrols at manageable logistics cost. Theater commanders value their flexibility to redeploy quickly among dispersed forward bases. Yet, requirements for stand-off strikes and Indo-Pacific reach spur the growth of the greater than 1,000 km class by 12.34% annually. Integrating multi-band SATCOM and efficient turbine-hybrid engines underpins this surge, as does doctrine prioritizing deep penetration against integrated air defenses. Consequently, the UCAV market anticipates a portfolio tilt toward fuel-efficient designs that pair high transit speed with broadband connectivity.
By Endurance: Day-long sorties still rule, ultra-persistence gains ground
Airframes offering 6-24 hour station time contributed 48.90% of 2025 sales by matching most ISR tasking windows and easing crew scheduling. They remain procurement defaults for border security and counter-terrorism. Advances in power-dense batteries and low-drag pylons now propel the > 24-hour cohort at an 11.05% CAGR, supporting theater-wide watch circles without recovery. Solar-assisted wings and hydrogen fuel cells, proven on the US Naval Research Laboratory’s Hybrid Tiger, illustrate how next-generation propulsion elevates persistence while trimming infrared signature. As fuel-versus-payload trade-offs improve, the UCAV market size for ultra-long-endurance craft will widen, especially for maritime and strategic ISR customers.
By Type: Fixed-wing supremacy, rotary-wing versatility rises
Fixed-wing models maintained an 88.65% share in 2025 owing to superior range and payload. Their aerodynamic efficiency suits strike and electronic-warfare packages, and modular bays allow quick sensor swaps. Nonetheless, rotary-wing or tail-sitting VTOL concepts now log 14.02% CAGR because they launch from confined decks and alpine clearings where runways are absent. Naval forces appreciate their hover stability for shipboard resupply and submarine hunt roles. As electric-lift motors gain thrust-to-weight and noise control, rotorcraft UCAVs will claim niche missions previously served by manned helicopters, incrementally broadening the UCAV market.
By Engine Type: Turboprop reliability leads, hybrids redefine persistence
Turboprops deliver 61.05% share through proven fuel economy and straightforward maintenance, ideal for austere bases. Operators trust their steady torque for loitering at mid-altitude with heavy sensor pods. Meanwhile, hybrid-electric or hydrogen concepts expand at 15.72% CAGR after lab tests showed 38.4% thrust gains when combining solid-oxide fuel cells with micro-turbines. Reduced thermal and acoustic signatures enhance survivability in contested airspace, while modular powertrains support plug-and-play upgrades. Commercial availability of proton-exchange membrane stacks by 2027 may catalyze this shift, setting new benchmarks inside the UCAV market.
By End User: Air force backbone, naval aviation’s rapid uptake
Air forces controlled 72.55% of spending in 2025 as UCAVs integrate seamlessly with legacy jet tactics and command networks. Combat cloud concepts advance kill-chain speed and distribute sensors across multiple unmanned nodes. Yet, naval and marine branches registered a 12.78% CAGR because sea-based tanking, ISR, and anti-surface warfare benefit from attritable launch-and-recover assets like the MQ-25A Stingray. Deck-handling trials prove unmanned platforms can withstand saltwater corrosion while easing carrier sortie tempo. As maritime threat envelopes widen, the UCAV market sees navies earmark larger budget slices for vertical-recovery and fold-wing designs.
Geography Analysis
North America generated 42.10% revenue in 2025, propelled by a USD 61.2 billion US defense appropriation for aviation systems and an industrial base that couples platform manufacture with secure communications, propulsion, and AI software. Contract awards to General Atomics for the XQ-67A and Boeing for the MQ-25A indicate sustained capital flow toward complementary crewed-uncrewed force packages. Long-lead component suppliers benefit from multiyear production lots that stabilize demand forecasts.
Asia-Pacific posts the quickest 12.03% CAGR as China, India, and South Korea channel modernization funds toward indigenous unmanned strike capabilities. China’s aero-engine initiatives seek self-reliance, reducing reliance on foreign hot sections while powering FH-97 loyal-wingman demonstrators. Japan’s tilt-rotor and VTOL explorations add lift-capable unmanned systems to maritime patrol arsenals. Regional procurement aims to counterbalance contested sea lanes and archipelagic chokepoints, enlarging the UCAV market in quantity and technological sophistication.
Europe sustains steady adoption through multinational collaborations that share risk and integrate UCAVs into next-generation manned fighters. The Leonardo-Baykar accord to feed Kizilelma data into the Global Combat Air Programme underpins broaderer drive to converge sensors, datalinks, and weapons across alliance fleets. Regulatory alignment on civilian air-traffic integration remains a hurdle, yet EU defense-preparedness recommendations urge acceleration of UCAV market uptake to strengthen collective deterrence.

Competitive Landscape
The market shows moderate concentration: the five largest primes and specialized UCAV builders control roughly 70% of revenue. General Atomics, Northrop Grumman, and Boeing leverage scale, certification know-how, and export reach. Israel Aerospace Industries and Baykar Tech carve out a share via cost-efficient designs proven in live conflicts, compelling budget-constrained customers to diversify suppliers. Strategic partnerships multiply; Leonardo teams with Baykar for loyal-wingman roles, and EDGE of the UAE co-develops payload suites to widen addressable missions.
Software-centric entrants such as Anduril disrupt by shipping AI mission autonomy first, then iterating airframes around code. The firm’s Lattice operating system won the US Air Force funding for Collaborative Combat Aircraft prototypes, exemplifying how agile sprints outperform waterfall development cycles. Supply-chain resilience emerges as a new battleground: command of high-thrust micro-turbine output and composite airframe lines determines delivery cadence once bulk orders materialize. Governments encourage domestic motor programs- India’s aero-engine push is a case in point- to insulate readiness from foreign chokepoints.
As production ramps shift from batches of tens to hundreds yearly, leading vendors invest in digital twins and automated lay-up cells that halve cycle time. Those unable to finance such capital outlays risk sliding from prime contractor to subsystem supplier status, realigning peer standings across the UCAV market.[4]US Department of Defense, “FY 2025 Budget Request – Defense,” defense.gov
Unmanned Combat Aerial Vehicle Industry Leaders
General Atomics
China Aerospace Science and Technology Corporation
BAE Systems plc
Northrop Grumman Corporation
Israel Aerospace Industries Ltd.
- *Disclaimer: Major Players sorted in no particular order

Recent Industry Developments
- March 2025: Leonardo and Baykar formalized cooperation to field the Kizilelma loyal-wingman within Europe’s Global Combat Air Programme.
- November 2024: General Atomics and Anduril completed critical design reviews for drone wingmen prototypes on the USAF CCA path.
- July 2024: The Royal Australian Air Force accepted its first MQ-4C Triton long-range maritime ISR platform.
- May 2024: Germany’s Luftwaffe conducted the maiden flight of its inaugural Heron TP UAV for high-end ISR duties.


Research Methodology Framework and Report Scope
Market Definitions and Key Coverage
Our study treats the unmanned combat aerial vehicle (UCAV) market as all newly built, weapon-capable fixed or rotary wing drones that fly without an onboard pilot and are fielded for precision strike, suppression of enemy defenses, or armed intelligence, surveillance, and reconnaissance (ISR) missions. Platforms in concept or prototype stage are not counted until a production contract is awarded.
Scope exclusion: unarmed ISR drones, target UAVs, loitering munitions below 150 kg, and retrofit weapon kits for legacy UAVs are outside this estimate.
Segmentation Overview
- By Altitude of Operation
- Below 30,000 ft
- Above 30,000 ft
- By Range
- Short-Range (Less than 200 km)
- Medium-Range (Between 200 and 1,000 km)
- Long-Range (Greater than 1,000 km)
- By Endurance
- Up to 6 hours
- 6 to 24 hours
- More than 24 hours
- By Type
- Fixed-Wing
- Rotary-Wing (VTOL)
- By Engine Type
- Turboprop
- Turbojet/Turbofan
- Hybrid-Electric/Hydrogen
- By End-User
- Air Force
- Army (Ground Forces)
- Navy/Marine Corps
- Joint Special Operations Commands
- By Geography
- North America
- United States
- Canada
- Mexico
- Europe
- United Kingdom
- France
- Germany
- Russia
- Rest of Europe
- Asia-Pacific
- China
- India
- Japan
- South Korea
- Rest of Asia-Pacific
- South America
- Brazil
- Rest of South America
- Middle East and Africa
- Middle East
- Saudi Arabia
- United Arab Emirates
- Israel
- Rest of Middle East
- Africa
- South Africa
- Nigeria
- Rest of Africa
- Middle East
- North America
Detailed Research Methodology and Data Validation
Primary Research
Multiple interviews and short surveys with air force planners, UAV program offices, propulsion integrators, and SATCOM vendors across North America, Europe, Israel, India, and the Gulf clarified unit cost bands, lead times, and expected retirement schedules. Responses also tested our early assumptions on swarm adoption rates and export restrictions before numbers were locked.
Desk Research
Analysts first mapped the global defense drone fleet and procurement pipeline through open government budget papers (e.g., US DoD R-1, India MoD Demand for Grants), Stockholm International Peace Research Institute's military spending tables, and UN Comtrade shipment codes for turbojet UAV engines. Production volumes and average sell prices were refined with company 10-Ks and investor decks, while trend context came from NATO Allied Air Command statements and think tank journals such as RUSI Defence Systems. Subscription datasets, D&B Hoovers for contractor revenues and Aviation Week for active UCAV programs, supplied additional cross-checks.
Trade association bulletins from AUVSI, patent counts in Questel, and customs alerts in Volza helped verify emerging suppliers and payload flow. The sources noted illustrate, not exhaust, the larger pool that underpinned secondary validation.
Market-Sizing & Forecasting
A top-down reconstruction begins with country defense capital outlays earmarked for combat drones and associated munitions; these budgets are converted into expected deliveries using historical contract value to unit ratios, which are then sampled against bottom-up indicators such as OEM shipment disclosures and tender awards for sanity checks. Key drivers inside the model include (1) annual fighter replacement budgets, (2) price erosion on MALE/HALE airframes, (3) satellite bandwidth costs per flight hour, (4) export license approvals under MTCR Category I, and (5) attritable drone demand in live conflicts. Multivariate regression paired with scenario analysis projects each driver and feeds a five-year forecast that reconciles to our base year value. Data gaps, especially on classified fleet sizes, are bridged by regional penetration rates benchmarked against known manned combat aircraft inventories.
Data Validation & Update Cycle
Model outputs pass a three-layer review: automated variance flags, peer analyst audit, and leadership sign-off. Figures are refreshed annually, with interim revisions triggered by multi-billion dollar contract wins, export policy shifts, or major combat loss events, ensuring clients always receive the latest calibrated view.
Why Our Unmanned Combat Aerial Vehicle Baseline Commands Reliability
Published UCAV estimates often diverge because firms choose different platform scopes, assign contrasting average selling prices, or freeze exchange rates at varied cut-off dates.
Key gap drivers include whether loitering munitions are rolled in, how aggressively future attritable swarms are priced, and the cadence of model refresh when large defense budgets swing from R&D to procurement.
Benchmark comparison
| Market Size | Anonymized source | Primary gap driver |
|---|---|---|
| USD 14.99 B (2025) | Mordor Intelligence | - |
| USD 15.78 B (2025) | Global Consultancy A | Includes light loitering munitions and prototypes, raising topline |
| USD 10.47 B (2024) | Regional Consultancy B | Uses conservative ASPs and excludes payload packages, lowering value |
| USD 16.24 B (2024) | Trade Journal C | Counts unarmed ISR variants retrofitted for weapons, expanding scope |
Taken together, the comparison shows that Mordor's disciplined platform definition, dual-track pricing verification, and yearly refresh deliver a balanced, transparent baseline that decision makers can retrace and replicate with confidence.


Key Questions Answered in the Report
What is the current value of the unmanned combat aerial vehicle market?
The UCAV market stands at USD 16.69 billion in 2026 and is on track to reach USD 28.59 billion by 2031, reflecting an 11.35% CAGR.
Which region leads the unmanned combat aerial vehicle market?
North America holds 42.10% share in 2025, supported by large US defense programs such as the Collaborative Combat Aircraft procurement.
What segment shows the fastest growth by engine type?
Hybrid-electric and hydrogen powertrains grow at 15.72% CAGR as they promise longer endurance and lower signatures.
How are manned-unmanned teaming doctrines influencing demand?
MUM-T concepts increase procurement of lower-cost wingmen drones that augment crewed fighters, driving a 3.1% positive impact on forecast CAGR.
Which customer group is expanding fastest?
Naval and marine aviation users exhibit a 12.78% CAGR as they deploy carrier-based refueling and ISR drones like the MQ-25A Stingray.
Page last updated on:


