Unmanned Aerial Vehicles Market Size and Share
Market Overview
| Study Period | 2019 - 2031 |
|---|---|
| Market Size (2026) | USD 18.55 Billion |
| Market Size (2031) | USD 26.05 Billion |
| Growth Rate (2026 - 2031) | 7.03% CAGR |
| Fastest Growing Market | Asia Pacific |
| Largest Market | North America |
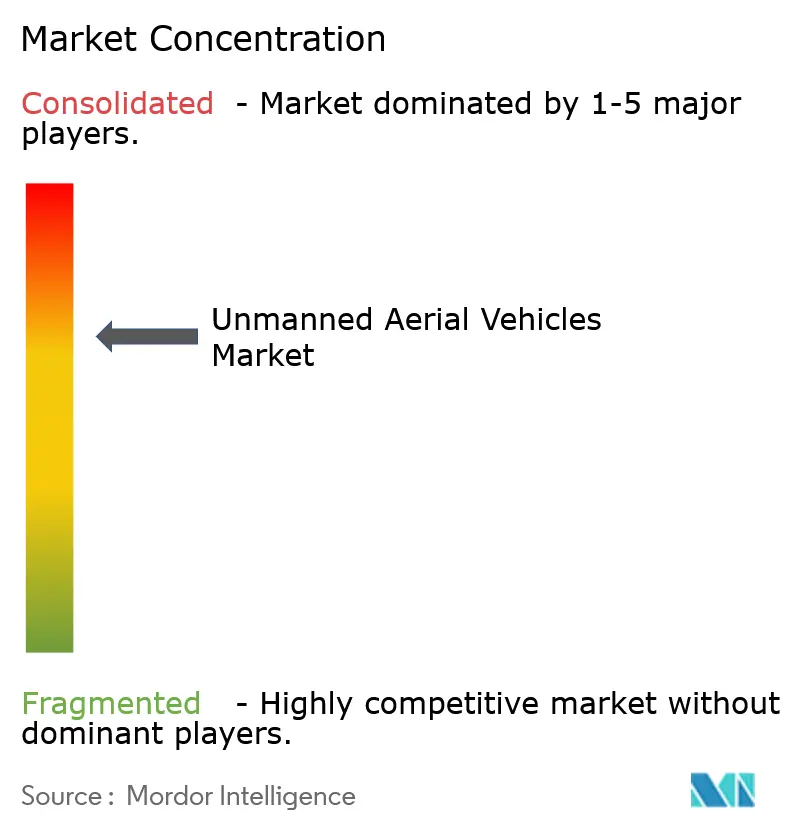
| Market Concentration | Medium |
Major Players
*Disclaimer: Major Players sorted in no particular order Image © Mordor Intelligence. Reuse requires attribution under CC BY 4.0. |
|
Unmanned Aerial Vehicles Market Analysis by Mordor Intelligence
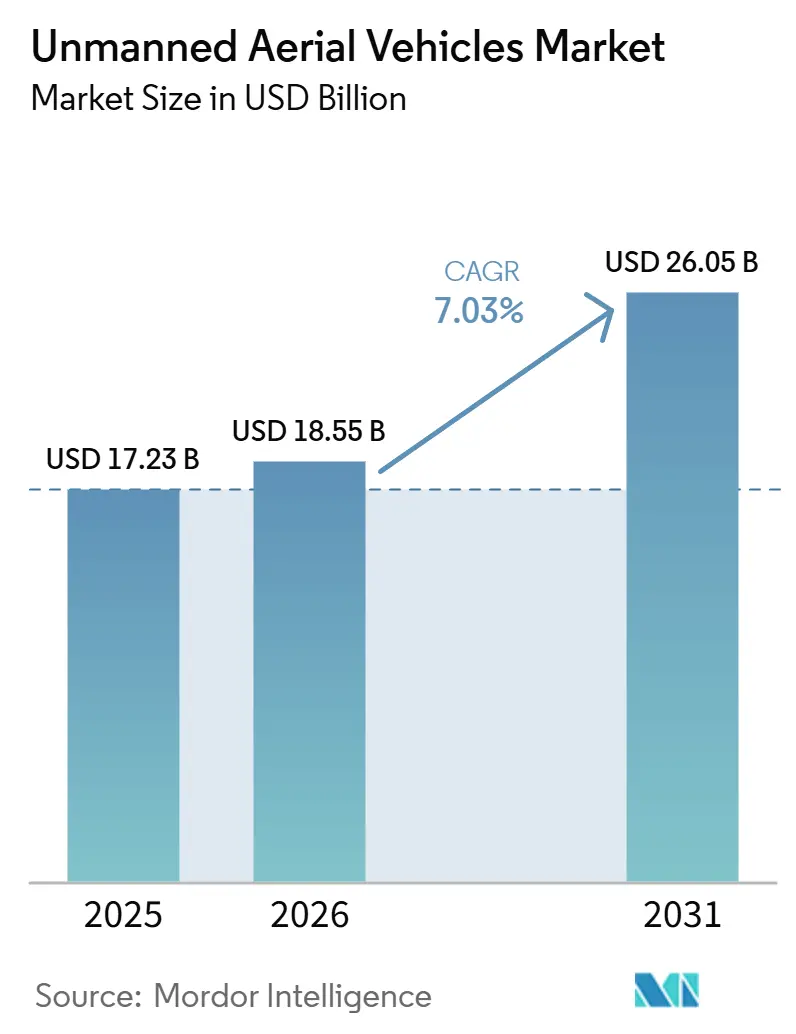
The unmanned aerial vehicles market is expected to grow from USD 17.23 billion in 2025 to USD 18.55 billion in 2026, and is forecasted to reach USD 26.05 billion by 2031 at a 7.03% CAGR over 2026-2031. This growth profile positions the UAV market size as one of the most resilient pockets of defense spending despite overall budget pressures. Demand is anchored in a decisive shift toward distributed, lower-cost airframes that can be fielded in large numbers, saturate sophisticated air-defense networks, and be replaced quickly when lost. Converging drivers include rapid autonomy gains that reduce operator workload, the attritable-drone doctrine that accepts higher loss rates in exchange for increased volume, and satellite-mesh networking that maintains viable command links in jammed theaters. Competitive dynamics are changing just as quickly, with software-native entrants challenging legacy primes on speed and price, while governments tighten export-control rules that reshape the revenue pools available to companies. Opportunities, therefore, focus on mid-sized Class II airframes, hybrid VTOL designs for shipboard use, and payload-agnostic autonomy stacks that can be migrated across various airframe classes.
Key Report Takeaways
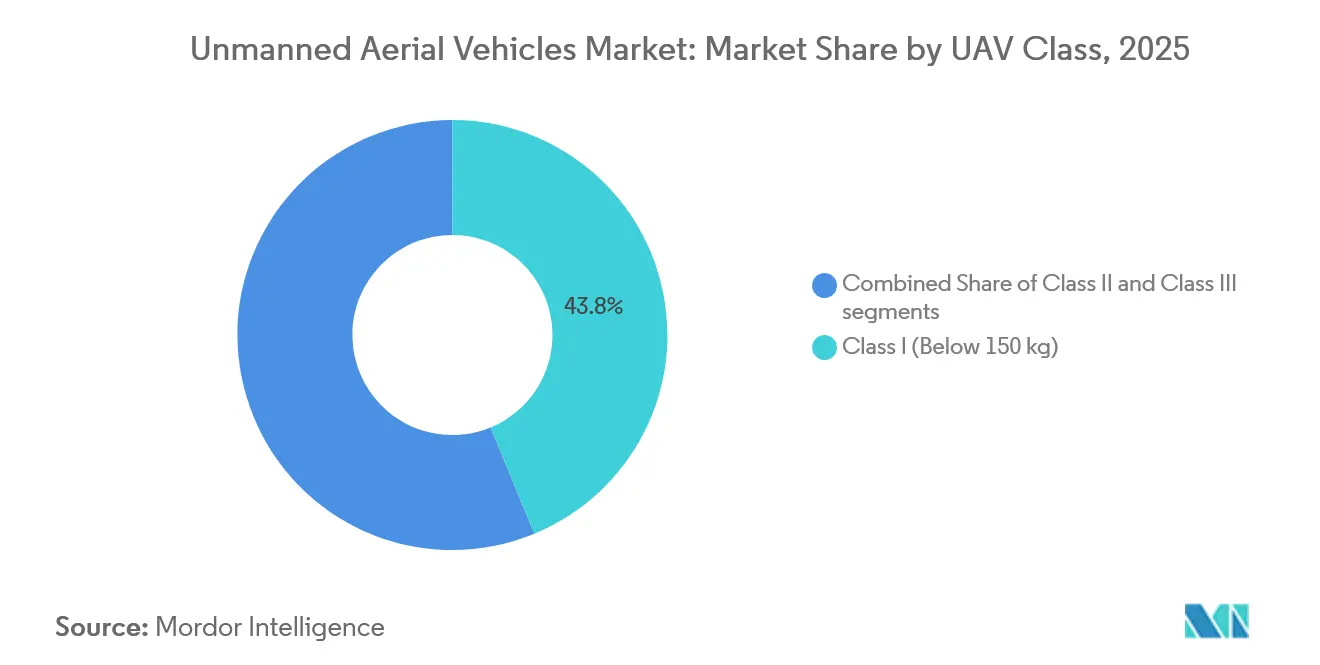
- By UAV class, platforms Class I (below 150 kg) held 43.78% of the 2025 unmanned aerial vehicles market share, whereas the Class II (150-600 kg) tier is projected to post a 7.55% CAGR to 2031.
- By platform type, fixed-wing designs dominated with a 74.78% share in 2025; however, hybrid VTOL concepts are expected to record a 9.25% CAGR through 2031.
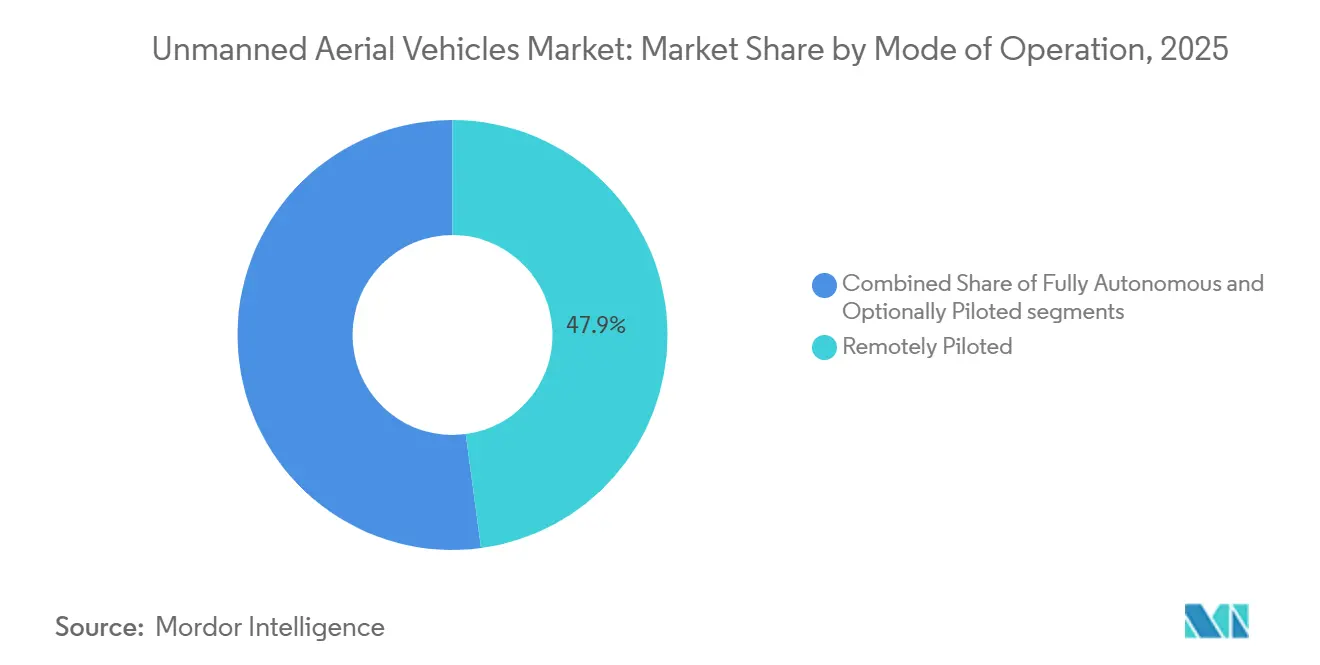
- By mode of operation, remotely piloted systems controlled 47.89% of 2025 activity, yet fully autonomous modes are set to expand at a 7.72% CAGR.
- By application, ISR accounted for 51.27% of 2025 revenue, while combat roles are forecast to climb at a 10.16% CAGR.
- By geography, North America accounted for 40.12% of 2025 revenue; the Asia-Pacific region is the fastest-growing, with an 8.29% CAGR.
Note: Market size and forecast figures in this report are generated using Mordor Intelligence’s proprietary estimation framework, updated with the latest available data and insights as of January 2026.
Global Unmanned Aerial Vehicles Market Trends and Insights
Drivers Impact Analysis*
| Driver | (~) % Impact on CAGR Forecast | Geographic Relevance | Impact Timeline |
|---|---|---|---|
| Rising defense budgets fueling UAV fleet expansion | +1.80% | Global, led by North America and APAC | Medium term (2-4 years) |
| Operational demand for real-time, all-weather ISR | +1.50% | Eastern Europe, Indo-Pacific | Short term (≤ 2 years) |
| Rapid advances in onboard autonomy and AI-driven mission systems | +1.30% | North America, APAC | Long term (≥ 4 years) |
| Manned–unmanned teaming concepts entering procurement cycles | +1.10% | North America, Europe, APAC | Medium term (2-4 years) |
| Attritable-drone doctrine lowering cost threshold for mass deployment | +0.90% | US, Ukraine, China | Short term (≤ 2 years) |
| Satellite-mesh networking enabling resilient BVLOS comms | +0.70% | Indo-Pacific, Eastern Europe | Medium term (2-4 years) |
| Source: Mordor Intelligence | |||


Rising Defense Budgets Fueling UAV Fleet Expansion
Defense ministries have increased the procurement of unmanned aerial vehicles after battlefield evidence demonstrated that inexpensive drones can deliver results previously achievable only with manned assets. India approved USD 3.5 billion for indigenous platforms through 2027 to sustain Himalayan surveillance. These allocations underscore a shift from exquisite survivability to quantity, mirroring Ukraine’s experience, where low-cost drones neutralized armor at scale. As multi-domain operations demand persistent sensing and rapid strike cycles, legislatures continue to ring-fence UAV spending even where other line items decline. The outcome is a steady baseline of orders that stabilizes supplier revenue and de-risks R&D for next-generation systems.
Operational Demand for Real-Time, All-Weather ISR
Commanders seek 24-hour coverage that compresses kill chains from hours to minutes. The US Air Force’s MQ-9 Reaper fleet exceeded 3 million flight hours by late 2024, with 70% logged in ISR sorties rather than kinetic missions. Israeli Hermes 900 operations demonstrated actual day-night persistence, informing doctrine that now expects sensor feeds regardless of weather. Synthetic-aperture radar and electro-optical payloads deliver cloud-penetrating imaging, limiting adversaries’ ability to mask movements. As peer competitors disperse assets and employ camouflage, real-time feeds become more valuable, reinforcing procurement of multi-sensor airframes and driving payload upgrades to legacy fleets.
Rapid Advances in Onboard Autonomy and AI-Driven Mission Systems
AI chips and advanced perception software are making the UAV market less dependent on high-bandwidth datalinks. Skydio integrated vision-language models that enable a single operator to issue natural-language commands, reducing training cycles and manpower costs.[1]Skydio Inc., “Skydio Integrates Vision-Language Models into X10 Platform,” skydio.com DARPA flight tests in 2024 demonstrated that AI pilots outperformed humans in close-in maneuvering, validating autonomy for tasks that overwhelm remote operators. These capabilities enable swarms that self-deconflict and dynamically re-task, a critical edge when communications are jammed. As autonomy migrates from prototypes to deployable software stacks, operators expect lower latency, improved survivability, and the ability to supervise dozens of airframes simultaneously.
Manned–Unmanned Teaming Concepts Entering Procurement Cycles
Loyal-wingman architectures move from lab to flight line. Boeing’s MQ-28 Ghost Bat demonstrated secure data sharing with F-35 and F/A-18 fighters during 2025 demonstrations.[2]The Boeing Company, “MQ-28 Ghost Bat Completes First International Flight,” boeing.mediaroom.com The US Air Force aims to field 1,000 collaborative combat aircraft by 2030, assigning high-risk suppression and reconnaissance to attritable escorts. Europe, Australia, and Japan follow similar paths. Teaming preserves human decision-making for weapons release while multiplying sensor reach, making every fifth-generation fighter a force multiplier and strengthening the business case for autonomous adjuncts.
Restraints Impact Analysis*
| Restraint | (~) % Impact on CAGR Forecast | Geographic Relevance | Impact Timeline |
|---|---|---|---|
| Stringent export-control and security-prohibition regimes | -0.9% | US, Europe, Israel, emerging markets | Long term (≥ 4 years) |
| High acquisition and life-cycle cost of HALE/MALE platforms | -0.7% | Africa, South America, SE Asia | Medium term (2-4 years) |
| Escalating electronic-warfare/counter-UAS threat environment | -0.6% | Eastern Europe, Indo-Pacific | Short term (≤ 2 years) |
| Supply-chain security restrictions driving component scarcity | -0.5% | North America, Europe, APAC allies | Medium term (2-4 years) |
| Source: Mordor Intelligence | |||
Stringent Export-Control and Security-Prohibition Regimes
The Missile Technology Control Regime (MTCR) bars systems with a range beyond 300 km and a payload over 500 kg, fragmenting demand and steering some governments toward indigenous suppliers. US FAR 40.2 further restricts the use of components of Chinese origin, adding redesign costs for integrators. Case-by-case licensing in Israel delays large foreign sales, creating an opportunity for Turkish vendors that face fewer political constraints. Cumulatively, these rules shrink the accessible unmanned aerial vehicles market for Western primes and elongate sales cycles, diverting capital toward domestic programs in emerging economies.
High Acquisition and Life-Cycle Cost of HALE/MALE Platforms
Large-airframe systems such as the MQ-9B SkyGuardian can exceed USD 30 million fly-away, while the RQ-4 Global Hawk tops USD 120 million, straining budgets outside the G-7. Life-cycle support often triples purchase price over 20 years, with manpower requirements undercutting the supposed crew-savings business case. Nations with fewer than a dozen airframes struggle to justify secure datalink networks and spare-parts pipelines, slowing adoption and forcing some to extend manned reconnaissance fleets instead.
*Our forecasts treat driver/restraint impacts as directional, not additive. The impact forecasts reflect baseline growth, mix effects, and variable interactions.
Segment Analysis
By UAV Class: Tactical Proliferation Versus Mid-Altitude Surge
Class I platforms, which weigh under 150 kg, accounted for 44% of 2025 revenue, underscoring that organic ISR at the battalion level currently dominates demand. These lightweight airframes cost under USD 100,000, utilize commercial parts, and launch without runways, allowing budget-constrained forces to field hundreds of units. In dollar terms, Class I accounted for the largest share of the unmanned aerial vehicles market; however, growth moderates as many armies complete their initial rollouts. Class II platforms, weighing between 150 kg and 600 kg, are forecast to lead the expansion at a 7.55% CAGR, bridging the gap between pocket-sized quadcopters and strategic HALE systems. The segment benefits from 12-hour endurance and multi-sensor payloads yet still fits on C-130-class transports, a mobility advantage that resonates with expeditionary forces. Class III platforms weighing more than 600 kg maintain strategic relevance for long-range ISR and strike, but unit costs exceeding USD 30 million discourage widespread adoption.
Rapid operational feedback from Ukraine validated the Class II impact of the Bayraktar TB2, which delivered precision strikes without the logistics footprint of larger drones. General Atomics’ Mojave STOL variant targets this category, promising highway operations and payload commonality with legacy Reapers. Meanwhile, loitering munitions keep Class I procurement lively, as Switchblade 600 and Harop variants add anti-armor punch to the lowest weight class. Ultimately, the UAV market balances high-volume Class I orders with value-dense Class II contracts, while Class III programs increasingly bundle service contracts to ease sticker shock.


By Platform Type: Fixed-Wing Dominance Challenged by Hybrid Innovation
Fixed-wing airframes accounted for 74.78% of 2025 revenue, reflecting their unmatched endurance and payload-to-weight ratios. For strategic ISR, 20-hour loiter times and 1,500 km range justify investments in runways and arresting gear. Rotary-wing drones serve specialized roles in urban or mountainous terrain, where hovering is essential, but their endurance typically lasts only four hours. Hybrid VTOL models that take off vertically then transition to wing-borne cruise are forecast to expand at a 9.25% CAGR, the fastest clip across the platform-type continuum. Navies prize such airframes because most ship decks lack catapults; Bell’s V-247 Vigilant tilt-rotor completed deck trials in 2016, proving the concept viable.[3]Bell Textron Inc, :v-247-tiltrotor-drone-downsized-to-maritime-strike-for-navy-warships" bellflight.com
Hybrid platforms now capture new-build spending in the UAV market, benefiting from improved battery density and lightweight composite rotors. Northrop Grumman’s canceled Tern project nevertheless validated tail-sitting aerodynamics, and several startups apply those lessons to smaller resupply craft. Fixed-wing manufacturers respond with detachable booster pods and autoland algorithms to avoid catapults, blurring the lines between categories. Rotary-wing suppliers focus on sensor-mast integration and near-silent electric rotors for close-quarters reconnaissance. While fixed-wing models remain the revenue anchor, the growth of hybrid VTOL models signals a long-term pivot toward flexible basing and maritime operations.
By Mode of Operation: Autonomy Gains as Latency Becomes Liability
Remotely piloted aircraft made up 47.89% of 2025 sorties, a legacy effect of regulations that require a human-in-the-loop for weapons employment. However, communications-denied environments expose the vulnerability of high-bandwidth control links, encouraging adoption of autonomous modes that rely on onboard decision engines. Optionally piloted designs provide a migration bridge, allowing crews to override AI when rules of engagement require. Fully autonomous aircraft are projected to record a 7.72% CAGR, outpacing other modes as AI validation frameworks mature and international norms coalesce. DARPA dogfight trials demonstrated that AI pilots can execute 9-g turns beyond human tolerance, setting confidence markers for autonomy in combat.
The unmanned aerial vehicles market size attached to autonomy is significant because software licenses scale across fleets, unlike hardware-bound revenue. Skydio’s vision-language interface reduces operator headcount, while Shield AI’s Hivemind enables multi-airframe swarms without pre-planned waypoints. Regulatory bodies lag the technology curve; civilian BVLOS rules still mandate visual observers, yet defense users operate under national-security exemptions, accelerating fielding. Suppliers that can certify safety cases and provide explainable AI will enjoy first-mover advantage as procurement shifts from airframe metrics to algorithmic reliability.
By Application: ISR Primacy Erodes as Strike Roles Expand
ISR missions accounted for 51.27% of 2025 revenue, reflecting a decades-long reliance on drones as persistent eyes rather than shooters. Still, combat applications are forecast to grow at a 10.16% CAGR as militaries embrace the unmanned-first-strike doctrine. Loyal-wingman concepts, loitering munitions, and swarming micro-drones blur traditional mission boundaries, allowing single frames to identify, track, and engage targets without human intervention. Delivery and logistics remain a niche area, but they are gaining traction in resupplying dispersed forward operating bases, where road convoys frequently face ambushes.
The unmanned aerial vehicles market share tilt toward combat stems from cost-exchange realities; an FPV drone that costs USD 500 yet destroys a USD 3 million tank resets procurement math. Israel’s Harop demonstrated air-defense suppression without risking manned assets, and the Pentagon’s Replicator initiative prioritizes attritable strike platforms. For ISR-centric fleets, payload retrofit programs add hardpoints and guidance kits, signaling a gradual convergence of sensor and shooter roles. Logistics drones await regulatory harmonization, but they are already being used to carry blood supplies and ammunition to austere sites, proving their value in humanitarian relief and special-operations support.
Geography Analysis
North America generated 40.12% of 2025 revenue, sustained by US outlays exceeding USD 12 billion annually for unmanned systems. Programs such as the Collaborative Combat Aircraft aim to achieve 1,000 autonomous escorts by this decade, ensuring a steady backlog for domestic primes.[4]US Naval Institute, "Report to Congress on U.S. Air Force Collaborative Combat Aircraft" news.usni.org/2025/12/02/report-to-congress-on-u-s-air-force-collaborative-combat-aircraft Canada’s Arctic-domain surveillance orders for SkyGuardian drones illustrate diversification into sovereignty missions, while Mexico’s Hermes 900 fleet addresses cartel interdiction, broadening regional demand beyond peer-war contingencies. Intellectual-property barriers remain low due to strong venture financing, enabling dozens of software startups to enter the supply chain.
The Asia-Pacific region is the fastest-growing theater, with an 8.29% CAGR. China mass-produces Wing Loong and CH-series drones and exports them to Middle Eastern buyers unconstrained by MTCR. India’s CATS Warrior project aims to procure 200 units by 2028, thereby reducing its reliance on Israeli imports. Australia’s MQ-4C Triton deals strengthen maritime domain awareness across vast Exclusive Economic Zones, and Japan’s SeaGuardian acquisition signals similar priorities in the East China Sea. Regional tensions over Taiwan and the South China Sea catalyze procurement, while domestic champions in South Korea and Indonesia vie to capture adjacent Southeast Asian markets.
Europe, the Middle East, and Africa form the remaining opportunity set. European NATO members accelerated purchases after Russia’s 2022 invasion of Ukraine; Germany ordered MQ-4C Tritons and France lengthened Reaper operations. Turkey disrupted the status quo by selling TB2 and Akinci drones under fewer export constraints, gaining footholds in Central Asia and North Africa. In the Middle East, Israel, the UAE, and Saudi Arabia are upgrading their fleets with multi-sensor payloads, although budgetary and oil-price fluctuations still influence the timing. Africa remains nascent; South Africa’s Paramount Group and Kenya’s embryonic programs indicate green shoots, but infrastructure and funding gaps temper uptake. South America lags due to fiscal constraints, yet Brazil’s Embraer RQ-900 demonstrates that an indigenous industry can emerge when border surveillance is a strategic imperative.
Competitive Landscape
At the high end, the UAV market exhibits moderate concentration, with BAYKAR A.S., General Atomics, Northrop Grumman Corporation, Elbit Systems Ltd., and BAE Systems plc collectively accounting for a majority of MALE/HALE revenue. Their strengths lie in systems integration, classified supply chains, and the organizational weight to meet security-clearance demands. Yet the tactical and software layers fragment heavily, with hundreds of entrants vying for autonomy, IP, and niche airframes. Turkish Aerospace and Baykar utilize export diplomacy, securing USD 1.7 billion in contracts, including the sale of 100 Akinci units to Saudi Arabia in 2024. US disruptors like Skydio and Shield AI pitch software-defined capability that drops into commodity hardware, accelerating update cycles and undercutting price points.
Strategic differentiation revolves around openness and attritability. Legacy primes respond with modular architectures and partnerships; Lockheed teaming with Kratos on low-cost airframes demonstrates willingness to outsource manufacturing innovation. Startups counter with swarm coordination, low-observable composites, and zero-trust cybersecurity baked into flight controls. Patent filings in autonomous navigation increased by 40% from 2023 to 2025, signaling an intellectual property race. Counter-UAS technologies represent a parallel growth story as governments seek layered defenses against the very proliferation they foster.
High export-control hurdles act as both a barrier and a moat. Western primes that navigate compliance secure premium, long-tail support contracts, while non-aligned producers gain market access by accepting higher political risk. As attritable doctrine normalizes, the revenue mix tilts from low-volume, high-margin sales toward high-volume, moderate-margin runs, pressuring incumbents to streamline factory cycles and adopt just-in-time components.
Unmanned Aerial Vehicles Industry Leaders
-
BAYKAR A.S.
-
General Atomics
-
Northrop Grumman Corporation
-
Elbit Systems Ltd.
-
BAE Systems plc
- *Disclaimer: Major Players sorted in no particular order

Recent Industry Developments
- December 2025: GKN Aerospace, Anduril, and Archer collaborated to develop advanced military drones for the UK armed forces, focusing on the forthcoming Land ACP and Project NYX programs, which are anticipated to launch in early 2026.
- December 2025: The US Army awarded AeroVironment a five-year contract valued at USD 874 million to support foreign military sales of Group 1–3 unmanned aerial systems (UAS) and counter-drone systems. The contract includes provisions for training, spare parts, and logistics support.


Global Unmanned Aerial Vehicles Market Report Scope
This report analyzes the global unmanned aerial vehicles market, focusing on the development, production, and deployment of unmanned aerial systems for military and commercial applications. These applications include combat, intelligence, surveillance, and reconnaissance (ISR), as well as delivery and loitering missions. The market encompasses fixed-wing, rotary-wing, and hybrid platforms that operate in remotely piloted, optionally piloted, and fully autonomous modes, along with related mission systems and ground control infrastructure.
The unmanned aerial vehicles market is segmented by UAV class, platform type, mode of operation, application, and geography. By UAV class, the market is segmented into Class I, Class II, and Class III. By platform type, the market is segmented into fixed-wing, rotary-wing, and hybrid. By mode of operation, the market is segmented into remotely piloted, optionally piloted, and fully autonomous. By application, the market is segmented into combat, ISR, delivery, and loitering munition. The report also covers the market sizes and forecasts for the unmanned aerial vehicles market in major countries across different regions. For each segment, the market size is provided in terms of value (USD).
| Class I (Below 150 kg) |
| Class II (150-600 kg) |
| Class III (Above 600 kg) |
| Fixed-wing |
| Rotary-wing |
| Hybrid |
| Remotely Piloted |
| Optionally Piloted |
| Fully Autonomous |
| Combat |
| Intelligence, Surveillance & Reconnaissance (ISR) |
| Delivery |
| Loitering Munition |
| North America | United States | |
| Canada | ||
| Mexico | ||
| South America | Brazil | |
| Rest of South America | ||
| Europe | United Kingdom | |
| France | ||
| Germany | ||
| Russia | ||
| Rest of Europe | ||
| Asia-Pacific | China | |
| India | ||
| Japan | ||
| Australia | ||
| Rest of Asia-Pacific | ||
| Middle East and Africa | Middle East | Saudi Arabia |
| United Arab Emirates | ||
| Israel | ||
| Rest of Middle East | ||
| Africa | South Africa | |
| Rest of Africa | ||
| By UAV Class | Class I (Below 150 kg) | ||
| Class II (150-600 kg) | |||
| Class III (Above 600 kg) | |||
| By Platform Type | Fixed-wing | ||
| Rotary-wing | |||
| Hybrid | |||
| By Mode of Operation | Remotely Piloted | ||
| Optionally Piloted | |||
| Fully Autonomous | |||
| By Application | Combat | ||
| Intelligence, Surveillance & Reconnaissance (ISR) | |||
| Delivery | |||
| Loitering Munition | |||
| By Geography | North America | United States | |
| Canada | |||
| Mexico | |||
| South America | Brazil | ||
| Rest of South America | |||
| Europe | United Kingdom | ||
| France | |||
| Germany | |||
| Russia | |||
| Rest of Europe | |||
| Asia-Pacific | China | ||
| India | |||
| Japan | |||
| Australia | |||
| Rest of Asia-Pacific | |||
| Middle East and Africa | Middle East | Saudi Arabia | |
| United Arab Emirates | |||
| Israel | |||
| Rest of Middle East | |||
| Africa | South Africa | ||
| Rest of Africa | |||


Key Questions Answered in the Report
What is the forecast value of the unmanned aerial vehicles market by 2031?
The unmanned aerial vehicles market is projected to reach USD 26.05 billion by 2031 from USD 18.55 billion in 2026, reflecting a 7.03% CAGR.
Which UAV class will grow fastest through 2031?
Class II platforms in the 150-600 kg range are expected to post a 7.55% CAGR as they balance endurance with deployability.
How dominant are fixed-wing designs today?
Fixed-wing configurations accounted for 74.78% of 2025 revenue, though hybrid VTOL airframes are gaining at a 9.25% CAGR.
Which region is expanding most quickly?
Asia-Pacific is set to grow at an 8.29% CAGR, underpinned by Chinese production and Indian, Australian, and Japanese procurements.
What role does autonomy play in future demand?
Fully autonomous modes are forecast to expand at a 7.72% CAGR as onboard AI reduces reliance on vulnerable datalinks.
How are export controls affecting suppliers?
Stricter MTCR and national security rules shrink addressable markets for Western primes while giving nonaligned producers room to grow.
Page last updated on:


