
Military Power Solutions Market Size and Share
Market Overview
| Study Period | 2019 - 2031 |
|---|---|
| Market Size (2026) | USD 8.12 Billion |
| Market Size (2031) | USD 10.99 Billion |
| Growth Rate (2026 - 2031) | 6.24 % |
| Fastest Growing Market | Europe |
| Largest Market | North America |
| Market Concentration | Medium |
Major Players *Disclaimer: Major Players sorted in no particular order Image © Mordor Intelligence. Reuse requires attribution under CC BY 4.0. | |
Military Power Solutions Market Analysis by Mordor Intelligence
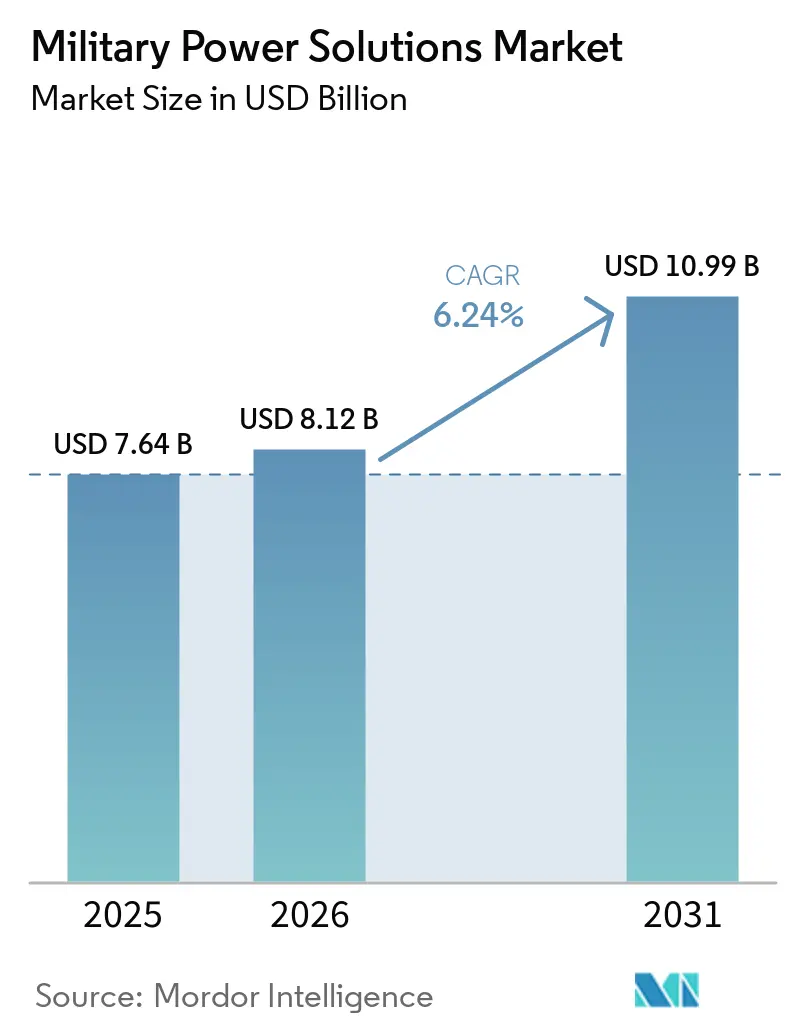
The military power solutions market size was valued at USD 7.64 billion in 2025 and is forecast to grow from USD 8.12 billion in 2026 to USD 10.99 billion by 2031, registering a 6.24% CAGR between 2026 and 2031. Defense modernization is increasing the need for reliable generation, storage, conversion, and energy management across deployed forces. The US Department of Defense (DoD) requested USD 848.30 billion in discretionary funding for FY2026, including USD 13.40 billion for autonomous and remotely operated systems and USD 20.30 billion for science and technology.[1] The market is also supported by expanding electrical loads from unmanned systems, sensors, electronic warfare (EW), and directed-energy programs. Suppliers that can combine qualified hardware with dependable domestic or allied sourcing are better positioned for upcoming procurement programs. The military power solutions market is moving beyond routine replacement demand, as platforms require power upgrades throughout their operating lives.
Key Report Takeaways
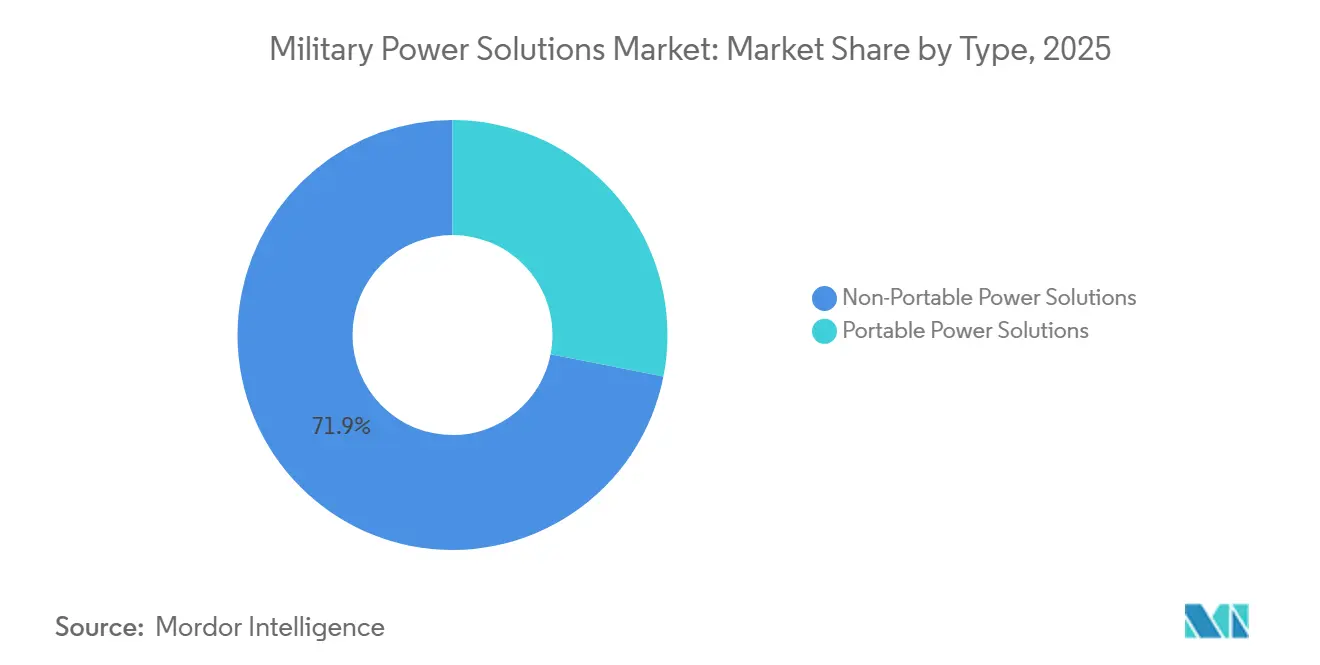
- By type, non-portable power solutions held 71.90% of the military power solutions market share in 2025 and are forecast to grow at a 7.46% CAGR through 2031.
- By power source, generators held 55.30% of the market share in 2025, while other power sources are projected to grow at a 6.97% CAGR through 2031.
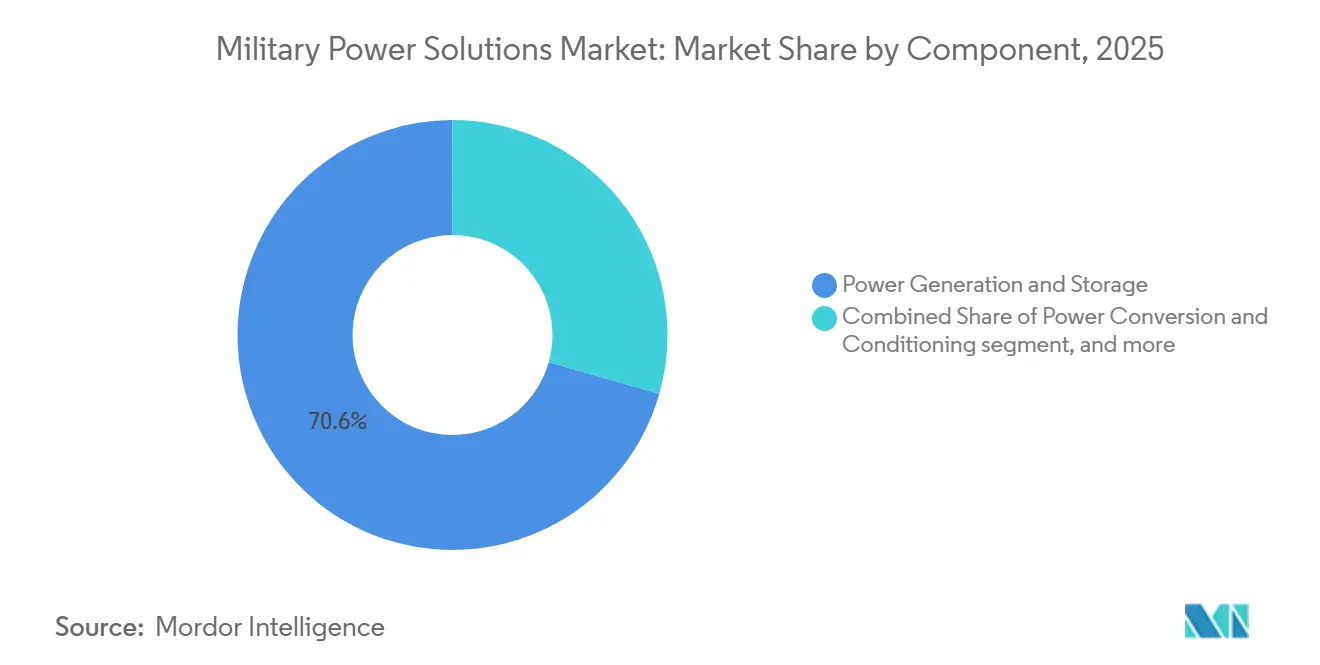
- By component, power generation and storage accounted for 70.60% of the military power solutions market share in 2025 and are projected to grow at a 7.48% CAGR through 2031.
- By domain, land systems held 62.40% of the market share in 2025 and are projected to grow at a 7.59% CAGR through 2031.
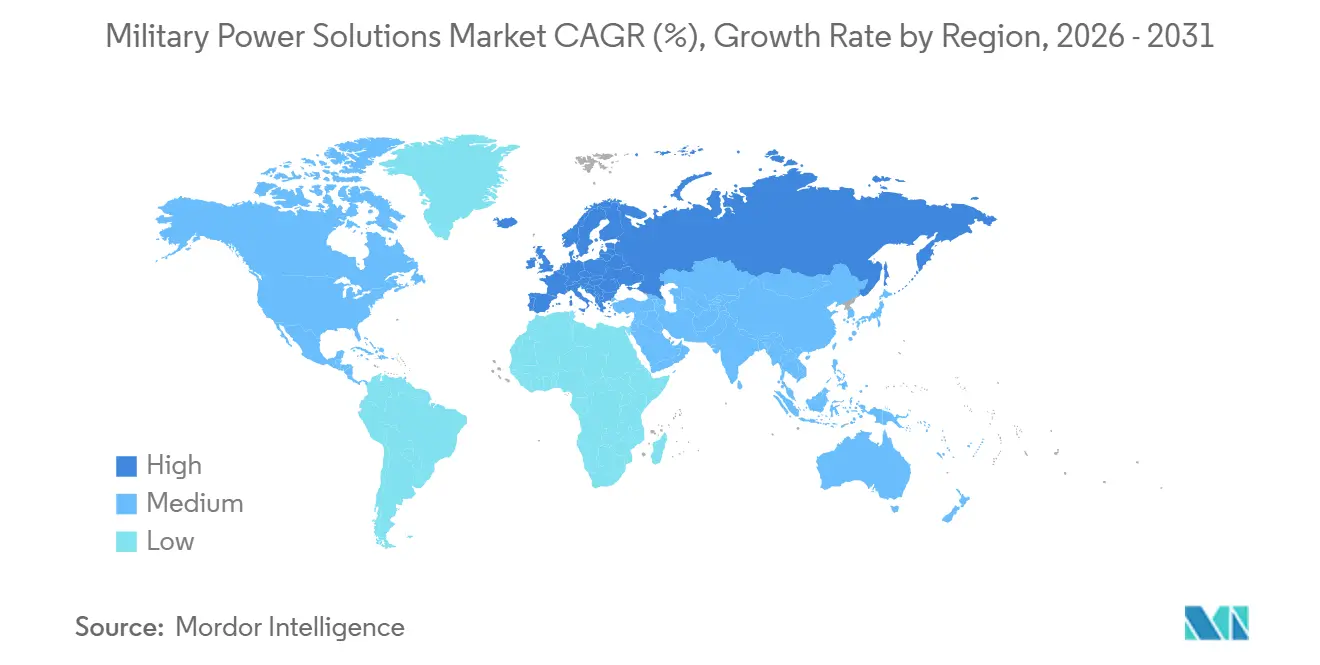
- By geography, North America held 38.60% of the market share in 2025, while Europe is projected to grow at a 7.78% CAGR through 2031.
Note: Market size and forecast figures in this report are generated using Mordor Intelligence’s proprietary estimation framework, updated with the latest available data and insights as of 2026.
Market Trends and Insights
Drivers Impact Analysis of Military Power Solutions Market*
| Driver | (~) % Impact on CAGR Forecast | Geographic Relevance | Impact Timeline |
|---|---|---|---|
| Accelerating defense modernization and electrification of military platforms | +1.80% | Global, with highest intensity in North America and Europe | Medium term (2-4 years) |
| Rapid expansion of unmanned systems and power-intensive mission electronics | +1.50% | Global, with North America and Asia-Pacific leading | Short term (≤ 2 years) |
| Deployment of directed-energy and EW systems driving high-power requirements | +1.20% | North America, Europe, and Asia-Pacific | Long term (≥ 4 years) |
| Demand for mobile and portable power in expeditionary operations | +0.60% | Global, with the Middle East and Africa and Asia-Pacific operationally important | Short term (≤ 2 years) |
| Growing adoption of tactical microgrids to strengthen battlefield energy resilience | +0.80% | North America and Europe | Medium term (2-4 years) |
| Strategic push for secure and sovereign defense power supply chains | +0.70% | North America, Europe, and Asia-Pacific | Long term (≥ 4 years) |
| Source: Mordor Intelligence | |||
Accelerating Defense Modernization and Electrification of Military Platforms
The military power solutions market benefits as armed forces replace hydraulic and pneumatic functions with electric actuation across land, naval, and air platforms. The US FY2026 request includes USD 20.30 billion for science and technology and USD 2.90 billion for microelectronics. Electric actuators and mission equipment increase the need for generation, storage, converters, and thermal controls. This can create a capacity gap on platforms that remain in service. European Union member states are estimated to spend EUR 454 billion (approximately USD 495 billion) on defense in 2026. The resulting upgrades can increase demand for regular replacements and favor qualified suppliers that integrate with legacy systems.
Rapid Expansion of Unmanned Systems and Power-Intensive Mission Electronics
The military power solutions market is being shaped by an increasing number of unmanned platforms and power-intensive mission systems. The US FY2026 request allocates USD 9.40 billion for unmanned aerial vehicles (UAVs), within a total of USD 13.40 billion for autonomous and remotely operated systems. These systems require charging, data processing, communications, and maintenance at the operational edge. A US Army analysis stated that robotic-system processing could require up to 12 MW for a brigade combat team by 2040. Project Odin uses MIL-STD-3071-compliant intelligent equipment to improve visibility into energy consumption. Suppliers that combine monitoring and control functions with hardware may have an advantage.
Deployment of Directed-Energy and EW Systems Driving High-Power Requirements
The military power solutions market is supported by directed-energy weapons (DEWs) and EW systems that need high, steady electrical output. The DoD aims to increase directed-energy capabilities from around 150 kW to 500 kW by the late 2020s. These systems need cooling and conditioning, which may require changes to generation, storage, and distribution. Shipboard lasers must operate alongside propulsion, sensors, and other mission loads. Ground vehicles face comparable export-power limits, favoring hybrid powertrains, storage, and thermal management. Suppliers need to qualify solutions early because new platform development schedules are long.
Growing Demand for Mobile and Portable Power in Expeditionary Operations
Portable systems remain important to the military power solutions market because expeditionary units operate away from fixed bases. Dismounted personnel and dispersed units require electricity to power radios, sensors, counter-unmanned systems, and small aircraft. This creates demand for lightweight, easy-to-field-replace batteries, compact generators, chargers, and management equipment. The need grows when vehicle-based generation cannot reach forward units. US Army guidance treats generation, storage, and distribution as connected functions in large-scale combat operations. Standardized portable modules can help users reduce resupply needs and manage wider use of electronic equipment.
Restraints Impact Analysis of Military Power Solutions Market*
| Restraint | (~) % Impact on CAGR Forecast | Geographic Relevance | Impact Timeline |
|---|---|---|---|
| Critical-mineral dependence creating battery supply and cost vulnerabilities | -1.00% | Global, with the US and EU most exposed | Medium term (2-4 years) |
| Stringent military qualification requirements driving high development and lifecycle costs | -0.80% | Global, most pronounced in North America and Europe | Long term (≥ 4 years) |
| Thermal management and safety challenges limiting high-energy battery deployment | -0.50% | Global | Medium term (2-4 years) |
| Legacy platform integration challenges and extended defense procurement timelines | -0.40% | North America and Europe | Long term (≥ 4 years) |
| Source: Mordor Intelligence | |||
Stringent Military Qualification Requirements Driving High Development and Lifecycle Costs
The military power solutions market has high entry barriers because equipment must meet demanding military qualification rules. Batteries and power equipment are assessed for durability, electromagnetic compatibility, safety, and performance. The US Army Battery Program Office requires qualification inspections and Qualified Products List authorization before contract award. Testing can add years and costs before commercial products enter military service. Cybersecurity requirements create further overhead, particularly for smaller suppliers. These barriers favor firms with established defense-quality systems and can delay the adoption of solid-state, lithium-sulfur, and other emerging battery technologies.
Critical-Mineral Dependence Creating Battery Supply and Cost Vulnerabilities
Critical mineral availability restrains the military power solutions market because advanced batteries require materials with concentrated global supply. The US Senate testimony in 2026 stated that the country remained fully reliant on imports for battery-grade graphite. Export restrictions can raise battery costs and extend lead times for graphite, cobalt, rare earths, and related components. New mines and processing facilities need long development periods, so policy changes cannot immediately secure supply. Manufacturers must use inventory planning, supply agreements, material substitution, and recycling while meeting strict qualification requirements. This uncertainty can delay procurement and encourage buyers to approve multiple suppliers.
*Our forecasts treat driver/restraint impacts as directional, not additive. The impact forecasts reflect baseline growth, mix effects, and variable interactions.
Military Power Solutions Market Segment Analysis
By Type:
Non-Portable Systems Lead Current Demand and Future GrowthNon-portable power solutions held 71.90% of the market share in 2025 and are projected to expand at a 7.46% CAGR through 2031. The segment includes vehicle-integrated, shipboard, and fixed-installation equipment that forms the foundation of military energy infrastructure. Its position reflects the installed base of vehicles, ships, bases, and other systems that require continuous power. Electrical loads from sensors, communications, EW, and active protection systems support demand for higher-capacity equipment. Vehicle and ship upgrades can occur during maintenance and retrofit cycles.
The military power solutions market size for non-portable systems is also supported by fixed-site and formation-level microgrids. These systems require integrated generation, storage, conditioning, and distribution that operate under military conditions. Portable solutions accounted for the remaining 28.10% of demand and supported soldier-worn equipment, small unmanned systems, communications, and remote sensors. Their users prioritize low weight, endurance, charging access, and field replacement. US Army guidance treats portable generation, storage, and distribution as connected logistics functions.



By Power Source:
Generators Retain Scale While Other Sources Grow FasterGenerators held 55.30% of the market share in 2025 because allied forces have established diesel infrastructure, qualified suppliers, and field support systems. They provide prime power for bases, vehicles, tactical equipment, and remote operations. The US DoD awarded Cummins USD 500 million in December 2025 for 500 kW mobile generator sets supplied to Poland through foreign military sales (FMS). Generators can also provide dispatchable capacity within microgrids alongside storage and solar systems. The category remains central to the military power solutions market.
Other power sources are projected to grow at a 6.97% CAGR through 2031, the highest rate in the segmentation. This group includes fuel cells, solar-hybrid systems, and hydrogen-based systems that offer lower acoustic and thermal signatures. SFC Energy received a EUR 42.70 million (USD 48.07 million) in May 2026 to supply mobile fuel cell systems in Ukraine. Batteries support silent watch, robotics, and unmanned vehicles, including EnerSys's MIL-PRF-32565C-compliant Hawker ARMASAFE iON-X product.[2] These sources carry different fuel, charging, maintenance, and signature tradeoffs.
By Component:
Generation and Storage Remain the Central Procurement AreaPower generation and storage accounted for 70.60% of the market share in 2025 and are forecast to grow at a 7.48% CAGR through 2031. The category produces or holds the energy used by military loads. Directed-energy systems, tactical microgrids, and unmanned fleets depend on reliable generation and storage. Batteries, generators, and fuel cells also require charging, fuel, maintenance, and lifecycle support. This makes generation and storage the central category for components.
Power conversion and conditioning remain essential for radar, EW, communications, and processing loads that need stable voltage and rapid response. Rugged converters and inverters must meet electromagnetic, weight, and space requirements. Power distribution and management are gaining value as users seek visibility over consumption. Project Odin uses intelligent equipment to deliver energy data through the Army command-and-control (C2) environment. The military power solutions market is consequently shifting part of its value toward integrated control capabilities.

By Domain:
Land Systems Provide Volume While Naval and Air Systems Demand Higher PerformanceLand systems held 62.40% market share in 2025 and are projected to grow at 7.59% CAGR through 2031. The category covers armored vehicles, tactical vehicles, ground-based air defense, remote sensors, and deployable equipment. Its scale reflects both the large global land-platform fleet and rising demand from drones, counter-drone systems, and command posts. Tactical microgrids and battery logistics add demand across widely dispersed formations. MIL-STD-3071 supports interoperable equipment for these systems.
Naval systems have lower unit volumes but the highest per-platform power requirements for propulsion, sensors, communications, combat systems, and potential laser weapons. This creates demand for integrated generation, storage, conversion, cooling, and load management. Air systems face strict weight, space, thermal, and reliability limits while supporting radar, EW, flight controls, and processing. Electrically actuated equipment further raises aircraft electrical loads. The military power solutions market must meet these needs without reducing mission performance.
Geography Analysis
North America Military Power Solutions Market
North America held 38.60% of the market share in 2025. US procurement scale supports demand for generation, batteries, power electronics, and management systems. The FY2026 budget request includes USD 13.40 billion for autonomous and remotely operated systems. EnerSys is developing US-based compliant lithium-cell capacity for aerospace and defense customers. North American demand combines new systems, upgrades, naval modernization, strict qualification rules, and domestic industrial policy.
Europe Military Power Solutions Market
Europe is projected to grow at a 7.78% CAGR through 2031, the fastest regional rate in the military power solutions market. European military expenditure reached USD 864 billion in 2025, the highest level recorded for the region by SIPRI. NATO reported that European allies and Canada increased core defense expenditure by nearly 20% in real terms during 2025. This spending supports the procurement of vehicles, generators, batteries, and microgrids. SFC Energy's May 2026 fuel-cell contract for Ukraine shows the role of government-backed demand.
APAC, South America and MEA Military Power Solutions Market
Asia-Pacific has sustained long-term demand as India, China, South Korea, and Japan modernize their forces. India allocated INR 2.19 lakh crore, equivalent to USD 26.10 billion, for defense capital expenditure in FY2026-27.[3] China set an official FY2026 defense budget of RMB 1.91 trillion (USD 276.70 billion). South America, the Middle East, and Africa are smaller markets for demand in FMS support equipment.
Competitive Landscape
Market Concentration
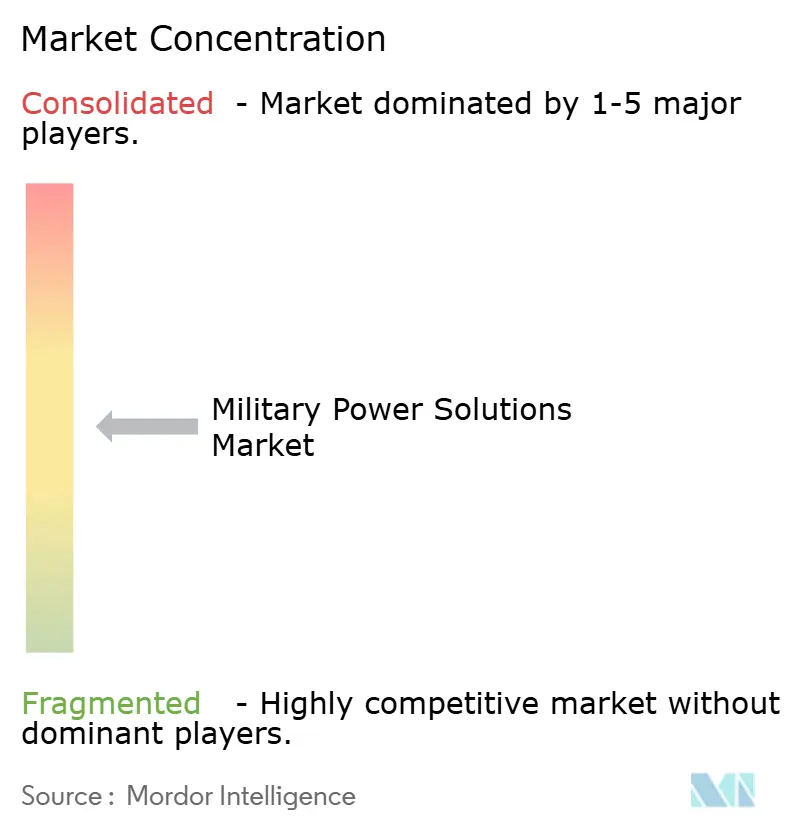
The military power solutions market is moderately consolidated among tier-one suppliers. EnerSys, Cummins, Saft Groupe SAS, Caterpillar, RTX Corporation, EaglePicher Technologies, and Rolls-Royce provide batteries, generators, power electronics, or related equipment. Mid-sized fuel-cell specialists and battery manufacturers compete for narrower applications. Qualification status is a major factor because defense buyers require proven reliability, compliance, and secure handling of controlled information. Long product histories can support repeat procurement.
EnerSys is pursuing domestic cell capacity for aerospace and defense customers that require compliant US sourcing. Cummins secured a USD 500 million US Army contract for mobile generator sets supplied to Poland through FMS. SFC Energy secured a EUR 42.70 million (USD 48.07 million) order for mobile fuel cells in Ukraine. These moves focus on compliant supply, output scale, and low-signature power. Large and specialized suppliers can therefore occupy different positions in the procurement landscape.
Energy management software is gaining relevance as tactical microgrids and dynamic electrical loads become more common. MIL-STD-3071 provides a framework for interoperable tactical power systems. Hybrid generation and storage can meet peak loads while limiting acoustic or thermal signatures. Qualified non-adversarial battery supply is also becoming a competitive requirement.
Military Power Solutions Industry Leaders
-
RTX Corporation
-
Caterpillar Inc.
-
Saft Groupe SAS
-
Cummins Inc.
-
EnerSys
- *Disclaimer: Major Players sorted in no particular order
Military Power Solutions Market Companies Covered in this Report
- EnerSys
- Cummins Inc.
- Saft Groupe SAS
- RTX Corporation
- EaglePicher Technologies, LLC
- SFC Energy AG
- Denchi Group Ltd.
- Concorde Battery Corporation
- Rolls-Royce Holdings PLC
- L3Harris Technologies, Inc.
- Advanced Conversion Technology, Inc.
- Epsilor-Electric Fuel Ltd.
- Caterpillar Inc.
- Eniquest Pty Ltd.
- Galvion Ltd.
Recent Industry Developments in Military Power Solutions Market
- May 2026: SFC Energy AG secured its largest order in company history, an EUR 42.70 million (USD 48.07 million) contract to supply advanced mobile fuel cell systems for military and civilian deployment in Ukraine, funded through Germany's Enablement Initiative. The contract triggered an upward revision of SFC's FY2026 revenue guidance to EUR 163–175 million (approximately USD 190–204 million) and its EBITDA guidance to EUR 29–34 million (approximately USD 34–40 million).
- July 2026: EnerSys updated plans for its defense-focused lithium cell manufacturing facility in Greenville, South Carolina, refining its strategy to serve aerospace and defense customers requiring foreign-entity-of-concern-compliant, US-based production, and backed by a revised USD 150 million Department of Energy grant.
- December 2025: Cummins Power Generation won a USD 500 million firm-fixed-price contract from the US Army for 500 kW skid-mounted mobile electric power generator sets for Poland, to be delivered through FMS.
Global Military Power Solutions Market Report Scope
Military power solutions are specialized electrical power systems designed to operate reliably in extreme, rugged, and off-grid combat and defense environments. Unlike standard commercial electronics, these systems withstand severe shock, vibration, extreme temperatures, and dust while delivering uninterrupted power for mission-critical operations.
The military power solutions market is segmented by type, power source, component, domain, and geography. By type, the market is segmented into portable power solutions and non-portable power solutions. By power source, the market is segmented into batteries, generators, and other power sources (including fuel cells and hybrid systems). By component, the market is segmented into power generation and storage, power conversion and conditioning, and power distribution. By domain, the market is segmented into land, air, and naval. The report also covers the market sizes and forecasts for the military power solutions market in major countries across different regions. For each segment, the market size is provided in terms of value (USD).
Segmentation Overview
| Portable Power Solutions |
| Non-Portable Power Solutions |
| Batteries |
| Generators |
| Others |
| Power Generation and Storage |
| Power Conversion and Conditioning |
| Power Distribution and Management |
| Land |
| Air |
| Naval |
| North America | United States | |
| Canada | ||
| Mexico | ||
| Europe | United Kingdom | |
| France | ||
| Germany | ||
| Russia | ||
| Rest of Europe | ||
| Asia-Pacific | China | |
| India | ||
| Japan | ||
| South Korea | ||
| Rest of Asia-Pacific | ||
| South America | Brazil | |
| Rest of South America | ||
| Middle East and Africa | Middle East | Saudi Arabia |
| United Arab Emirates | ||
| Rest of Middle East | ||
| Africa | South Africa | |
| Rest of Africa | ||
| By Type | Portable Power Solutions | ||
| Non-Portable Power Solutions | |||
| By Power Source | Batteries | ||
| Generators | |||
| Others | |||
| By Component | Power Generation and Storage | ||
| Power Conversion and Conditioning | |||
| Power Distribution and Management | |||
| By Domain | Land | ||
| Air | |||
| Naval | |||
| By Geography | North America | United States | |
| Canada | |||
| Mexico | |||
| Europe | United Kingdom | ||
| France | |||
| Germany | |||
| Russia | |||
| Rest of Europe | |||
| Asia-Pacific | China | ||
| India | |||
| Japan | |||
| South Korea | |||
| Rest of Asia-Pacific | |||
| South America | Brazil | ||
| Rest of South America | |||
| Middle East and Africa | Middle East | Saudi Arabia | |
| United Arab Emirates | |||
| Rest of Middle East | |||
| Africa | South Africa | ||
| Rest of Africa | |||
Key Questions Answered in the Report
What is the projected value of the military power solutions market by 2031?
The military power solutions market is projected to reach USD 10.99 billion by 2031, growing at a 6.24% CAGR through 2031.
Which type leads military power solutions demand?
Non-portable power solutions led with 71.90% share in 2025 and are also projected to grow at a 7.46% CAGR through 2031.
Why are fuel cells gaining use in defense applications?
Fuel cells can provide low-signature power for surveillance, communications, unmanned systems, and remote deployments.
Which component accounts for the largest share of military power spending?
Power generation and storage held 70.60% share in 2025 and is projected to grow at a 7.48% CAGR through 2031.
Which region is growing fastest through 2031?
Europe is projected to expand at a 7.78% CAGR, supported by sustained defense investment and modernization programs.
What limits adoption of advanced military batteries?
Qualification requirements, critical-mineral supply risk, thermal management, and integration with legacy platforms can delay adoption.